


INTRODUCTION
Osteoporosis is one of the most serious complications and common diseases in hemiplegic stroke patients [1], and stroke survivors are vulnerable to traumatic or nontraumatic fractures. Since they have long-term impairments, such as motor weakness, poor balance, cognitive dysfunction, and decreased activity during daily life [2], the risk of fractures within 12 months of a stroke is increased fourfold compared to age-matched controls [3]. Osteoporotic fractures lead to prolonged bed confinement, chronic pain, and higher mortality in poststroke patients [4]. Therefore, it is important to identify the risk factors related to the pathology of poststroke osteoporosis.
Prior studies investigated several pathophysiologies of osteoporosis after stroke, including decreased bone load due to immobility, endocrine changes, nutritional factors, and medications [5]. Above all, the reduction in mechanical stress on bones is considered to be a major determinant of bone loss [6]. Bone loss starts a few days after stroke, reaches a maximum in the first 3 to 4 months [7], and then gradually slows until about 1 year after the stroke [8]. In addition, bone loss is prominent on the paretic side [5-7]. These characteristics differ from senile osteoporosis or postmenopausal osteoporosis. Because earlier studies included both sexes as well as patients over 65 years old, the effects of senile and postmenopausal osteoporosis could not be eliminated. Recently, researchers have investigated the effects of stroke on bone mineral density (BMD) in male aged between 50 and 70 [9,10]. However, these studies had limitations in that they were designed retrospectively, and physical functions were measured only 3 months after stroke, precluding an analysis of the effects of initial physical function on ability after stroke.
Stroke patients with trunk instability have misalignment of the trunk, leading to body asymmetry, malalignment, and gait dysfunction [11]. Therefore, trunk stability is important for functional recovery in stroke patients. The vertebrae play an important role in supporting the weight of the upper body and resisting axial loads applied to the trunk [12]. Despite the importance of vertebrae for trunk balance in stroke patients, little attention has been paid to them. The vertebrae are composed mainly of trabecular bone, which is more metabolically active than cortical bone. For this reason, osteoporosis usually occurs in trabecular bone first [13]. Previous studies using micro-computed tomography scan analysis have suggested that the trabecular structure may be an important factor in mechanical bone strength [14], which is usually described in terms of mean BMD, as well as the microstructure of the trabecular bone [15]. Several studies reported a relationship between paretic femoral BMD and functional impairments such as balance and gait ability [16,17]. However, there is still insufficient data on correlations between lumbar BMD and trunk control ability in stroke patients.
To our knowledge, this was the first prospective study of bone fragility in subacute young male stroke patients. Based on previous studies that revealed primary lumbar bone loss in the early stages of osteoporosis, we hypothesized that subacute stroke patients with poor trunk balance are more likely to develop vertebral osteoporosis. The purpose of this study was (1) to investigate the correlation between lumbar BMD and trunk control ability evaluated by Trunk Impairment Scale (TIS) scores; (2) to explore the relationship between BMD and various clinical indicators at admission and 3 months following a stroke; and (3) to compare BMD between paretic and nonparetic legs.
MATERIALS AND METHODS
Study design and participants
This prospective study was conducted from November 2017 to March 2022 at the Department of Physical Medicine and Rehabilitation at Soonchunhyang University Bucheon Hospital in Korea. A total of 54 patients with subacute stroke admitted to the rehabilitation department were enrolled. All patients participated in conventional rehabilitation programs performed 5 days a week for 4 weeks delivered by affiliated physical and occupational therapists.
The patients were eligible to participate if they were male and between the ages of 50 and 65. Because postmenopausal status is a significant contributor to BMD loss [18], female were excluded from the study to eliminate the effect of postmenopausal osteoporosis. Additionally, senile osteoporosis is associated with reductions in sex steroids in the process of cortical bone loss. For male, this change accelerates and increases bone turnover after the age of 70 [19]. A previous review study [20] reported that 1 out of 6 senile osteoporosis screening guidelines for male included age over 65 years, with the remaining 5 including age over 70 years. Therefore, we used an age of less than 65 years as a strict criterion to examine only the effect of stroke on BMD.
The inclusion criteria were first ischemic or hemorrhagic stroke within 3 months and a unilateral stroke lesion. Strokes were diagnosed by magnetic resonance imaging or computer tomography. The exclusion criteria were a history of osteopenia or osteoporosis prior to the stroke, a history of hip or vertebral fractures, and surgery. Patients with thyroid disease, chronic renal failure, and liver dysfunction were also excluded.
This study was approved by Institutional Review Board (IRB) of Soonchunhyang University Bucheon Hospital (IRB no. SCHBC 2017-09-013). In accordance with the hospital’s ethical guidelines, the participants were provided with written and verbal information, which included the purpose and procedures of the study, before inclusion. When fully understood, informed consent to participate in the study was obtained from all patients.
Clinical data and assessment
We investigated the demographics of all patients, including age, body mass index (BMI), type of stroke, paretic side, and comorbidity. Information about other factors that induce bone mass reduction was also obtained during admission, including (1) medications, such as anticonvulsant drugs, antidepressants, antidiabetics, and proton pump inhibitors; and (2) diet types that can lead to malnutrition.
Outcome measures
All outcome measures were performed by physical and occupational therapists who were blinded to the recruitment, and therapists were randomly assigned to the patients. Trunk control ability was assessed with the TIS, which consists of 3 subscales that evaluate static sitting balance, dynamic sitting balance, and coordination. Each subscale is scored as follows: a scale of 0 to 7 for static balance, 0 to 10 for dynamic balance, and 0 to 6 for coordination (total score ranges from 0–23) [21].
The Berg Balance Scale (BBS), the Korean version of the Modified Barthel Index (K-MBI), and a manual muscle test (MMT) of the paretic side were used to assess functional ability. The BBS is commonly used to assess balance in stroke patients. It has 14 items in 3 categories: sitting, standing, and changing posture. Each item is rated on a 5-point scale of 0–4 (total score ranges from 0–56). The K-MBI consists of 10 items related to the activities of daily living. A higher score indicates a higher degree of self-care. The paretic MMT was used to measure the strength of the hip extensor and knee extensor needed to maintain a standing position (scores range from 0–5, respectively). These assessments were conducted at the time of admission and 3 months after stroke onset.
BMD measurement
BMD was measured using dual-energy X-ray absorptiometry (DEXA), which is a noninvasive method widely regarded as the gold standard for diagnosing osteoporosis and a guide for treatment decisions [22]. In this study, all of the patient’s DEXA scans were performed about 3 months after stroke. The BMD of the lumbar spine (L1 to L4), total proximal femur, and femoral neck of both lower extremities were measured. Lumbar spine BMD was evaluated using the T-score and absolute value (g/cm2) of the L1 to L4 spine. The BMD was assessed in accordance with the measurement criteria of the International Society for Clinical Densitometry (ISCD). Spines exhibiting artifacts or structural changes within the region of interest or a T-score difference of 1 standard deviation (SD) or greater compared to adjacent spines were excluded from the analysis [23].
The World Health Organization (WHO) reference classification for osteoporosis is a T-score of 2.5 SD lower than the mean of young adults. Osteopenia is defined as a T-score of 1.0 SD to 2.5 SD below the mean. Because the enrolled patients were over 50 years of age, we analyzed BMD T-scores and not Z-scores. According to the ISCD, the T-score is preferred over the Z-score for diagnosing osteoporosis in male over the age of 50 [23].
Statistical analysis
The demographic data of the continuous parameters are described by the mean±SD. The Shapiro–Wilk test was used to examine the normality of the distribution for each measurement. An independent t-test was applied to determine differences in BMD values between paretic and nonparetic lower extremities. Pearson’s correlation analysis was used to determine linear relationships between BMD values and clinical variables, which were BMI at admission, TIS, BBS, K-MBI, and paretic MMT scores. After correlation analysis, multiple linear regression analysis was used to identify the independent prognostic factors of BMD. Variables significantly associated with lumbar BMD in a univariable model (p<0.05) were included in a multivariable regression analysis through stepwise selection.
All statistical analysis were performed using IBM SPSS version 27.0 for Windows software (IBM Corp., Armonk, NY, USA). The statistical significance level was set at p<0.05. Correlation coefficients (r-values) were defined as follows: strong (r≥0.5), moderate (r≥0.3), and weak (r≥0.1) [24].
The sample size was calculated using a statistical program (PASS 12; NCSS, Kaysville, UT, USA) as a test for one correlation. The minimum sample size required for this study was 25, with 80% power and α error of 0.05 (2-tailed t-test) based on a previous study that reported the correlation between BBS and BMD scores in stroke patients [10]. Adjusting for an expected dropout of up to 60%, the estimated number of participants was 40.
RESULTS
A total of 54 stroke patients were enrolled in this study. Four patients dropped out due to transfer to other departments, and 25 patients did not visit the outpatient clinic after discharge. Among the remaining participants, 2 patients were excluded, as they refused to undergo BMD measurements. Ultimately, a total of 23 patients completed the study. A study flow chart is shown in Fig. 1. Postpower analysis demonstrated a power of 75%.
The demographic characteristics are summarized in Table 1. The participant’s mean age was 59.8±6.6 years, and the mean BMI was 25.1±2.8 kg/m2. Nine patients (39.1%) were diagnosed with an ischemic stroke, and the other patients had a hemorrhagic stroke (n=14; 60.9%). The subjects were admitted to the rehabilitation department a mean of 15.5±9.2 days after stroke onset, meaning that they received rehabilitation treatment in the early subacute stage. According to the BBS scores, most subjects needed an assistive device to walk (19.8±16.6; range, 0–56). The mean TIS score was 13.5±5.7 (range, 0–23). Twenty of the 23 patients (87.0%) had a grade of fair or above in lower extremity strength for the paretic hip extensor, and 19 patients (82.6%) for the paretic knee extensor (MMT grade ≥3, respectively). According to the WHO criteria, none of the participants had osteoporosis, 7 (30.4%) had osteopenia, and 16 (69.6%) were normal.
BMD in both paretic and nonparetic lower extremities
The independent student t-test was used to compare the BMD of the paretic and nonparetic lower extremities (Table 2). There were no significant differences in the Tscores between the lower extremities in both the femoral neck and the total proximal femur (p>0.05). The mean T-scores of the paretic and nonparetic femur neck were -0.29±1.20 and -0.27±1.23, respectively.
T-score of BMD and clinical assessments
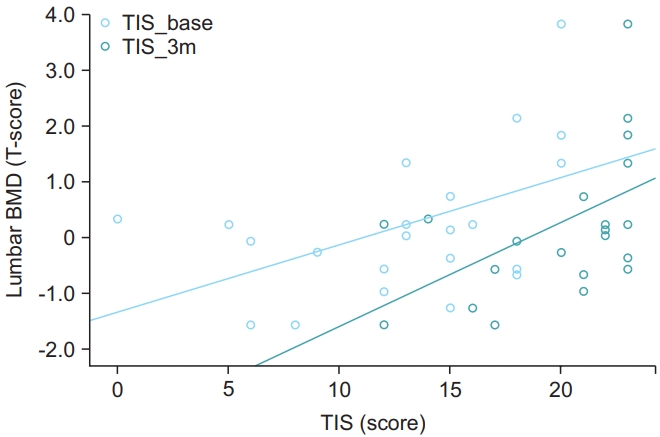
The correlations between BMD and the clinical parameters are shown in Table 3, and a scatter plot is shown in Fig. 2. Correlation analysis between BMI and T-scores at all sites showed a moderate association (paretic femur neck r=0.421, p=0.038; paretic total proximal femur r=0.456, p=0.029; nonparetic femur neck r=0.429, p=0.041; nonparetic total proximal femur r=0.464, p=0.026; lumbar r=0.494, p=0.017). Additionally, there was a strong positive correlation between lumbar T-scores and TIS at baseline (TIS_B) and TIS at 3 months after stroke (TIS_3m) (r=0.522, p=0.011; r=0.517, p=0.011, respectively). BBS at baseline (BBS_B) was moderately correlated with lumbar BMD (r=0.442, p=0.035) and nonparetic total proximal femur (r=0.415, p=0.049). No other significant correlations between the BMD of the paretic and nonparetic femurs and clinical variables, such as TIS, BBS, K-MBI, and MMT scores at baseline and 3 months after stroke, were found.
BMD in the lumbar spine and TIS
The most powerful predictor of bone demineralization in lumbar vertebrae was TIS scores at admission (Table 4). Univariable linear regression analysis showed a significant relationship between lumbar BMD and BMI, TIS_ B, TIS_3m, and BBS_B scores (p<0.05). Stepwise multivariable regression analysis revealed that TIS_B scores (β=0.481, p=0.008) and BMI (β=0.450, p=0.012) were independent predictors of lumbar T-scores in the early subacute phase. The absence of multicollinearity was confirmed in this study.
DISCUSSION
The present study was the first to investigate the association between trunk control ability and lumbar BMD prospectively in subacute young male stroke patients and demonstrated positive correlations between TIS_B and lumbar BMD. Through multivariable linear regression analysis, the results also showed that TIS_B was a more powerful predictor of lumbar BMD than TIS scores 3 months after stroke. This result suggests that patients with poor trunk balance in the early subacute stage are more susceptible to reduced lumbar BMD after 3 months.
Prolonged immobilization affects the musculoskeletal system [25]. Muscle atrophy and weakness occur within 2 weeks after bed rest and are primarily observed in the lower limbs and antigravity extensors [26]. Therefore, immobility could mainly affect the trunk extensor muscles, which are essential for the movement of the spine [27]. These findings suggest that minimizing the duration of immobilization through early rehabilitation is crucial for preventing trunk muscle loss and improving trunk stability.
The vertebral bodies have abundant trabecular bone [28], which is more active in bone remodeling than cortical bone, with turnover rates of 25% volume per year compared to 3% for cortical bone [29]. Therefore, bone loss occurs mainly in trabecular bone in the early stage of osteoporosis [30]. A previous study showed that changes in the BMD of patients with bed rest were not equivalent throughout the body but, in particular, rapidly decreased in the lumbar and metacarpal bones [31]. Immobilization leading to a lack of weight-bearing on bone is thought to be the major pathologic mechanism underlying bone fragility following stroke [17]. Bone has an inherent ability to add new bone to withstand increased weight loads and remove bone mass when unloaded or not in use. Mechanical loads applied to the bone generate multiple stimuli that are detectable by osteocytes [32,33]. The way that osteocytes detect and respond to mechanical loads is not fully understood. Nevertheless, some studies showed that nitric oxide released from osteocytes and osteoblasts in response to load inhibited bone resorption and advanced bone formation [34]. Other studies revealed piezoelectric effects on bone. Physical activities induce bone to grow by generating electrical charges, and electrical potential differences form inside the bone. When mechanical loading is applied to a bone, a negative charge is generated mainly on the loading side and a positive charge on the opposite side, which produces a potential difference. Bone formation by osteoblasts is related to negative potentials, whereas bone resorption is related to positive potentials [35]. Consequently, early rehabilitation treatment is important to prevent disuse osteoporosis by applying bone loading in the early stages of stroke recovery.
Bone loss in stroke patients was predominantly seen in the paretic extremities in many studies. Earlier work showed that BMD loss occurred in up to 14% of the proximal paretic femur and 17% of the paretic upper extremity during one year after stroke [36]. Ramnemark et al. [37] found a 17% reduction in paretic BMD in the humerus, 12% in the paretic femoral neck, and 4% in the nonparetic side of the femur. Another study measured regional BMD in the bilateral femur neck and distal radius in poststroke patients who were bedridden after stroke (minimum 3 to maximum 32 months) and did not exercise within that period. BMD was reduced in both lower extremities due to the long-term immobilization that resulted in decreased weight bearing on both sides [17]. However, there was no significant difference in BMD between both lower extremities in the present study. This may be because the rate of bone loss on the paretic side might be slowed by weight-bearing training, as patients received rehabilitation treatment earlier than in the above studies. In addition, the patient’s neurological deficits in the present study rapidly improved and the immobilization period was shortened, preserving bone loss on the paretic side. There was a significant improvement in BBS scores from 19.8±16.6 at the start of the study to 45.2±16.5 at the 3-month follow-up and in K-MBI scores from 37.9±21.9 at the start to 85.9±21.2 at 3 months.
There was no significant relationship between the BMD of the paretic lower limb and MMT, BBS, and K-MBI scores in this study. These findings are inconsistent with recent investigations that revealed positive correlations between the BMD of the paretic femur and MMT, BBS, and K-MBI scores in subacute male stroke patients [9,10]. We believe that the reasons for the difference from previous studies are as follows. First, the study by Palle et al. [38] analyzed the effects of nonstanding immobilization on the bones of 8 healthy male and allowed free movement only in the supine position and found that reduced mechanical loading induced histomorphological changes in bones. In other words, the amount of weight-bearing, rather than MMT, appears to be a major factor in maintaining bone density. Second, paretic leg function cannot be accurately evaluated by BBS scores because stroke patients tend to put most of the weight on the nonparetic lower extremity. Third, the K-MBI includes items irrelevant to weight-bearing ability, such as feeding, personal hygiene, and bladder and bowel control.
This study complements previous studies that evaluated BMD in subacute young adult male stroke patients. We focused on lumbar spine BMD in subacute stroke patients. A previous study [9] showed significant correlations between lumbar spine BMD and K-MBI scores. However, no study has examined the relationship between lumbar BMD and trunk control ability. The novelty of this study lies in the focus on trunk stability in subacute stroke patients along with lumbar BMD. TIS scores in the early stages of stroke have usually been considered a predictor of functional ambulation at discharge [39]. In addition, our findings indicate that an early assessment of trunk balance could predict lumbar spine BMD in patients with trunk instability. Furthermore, other previous studies were retrospective in design. To the best of our knowledge, this was the first prospective study of BMD in young adult male stroke survivors.
There were several limitations to this study. First, the sample size was relatively small. The dropout rate was up to 60%. Because stroke patients had difficulty visiting a rehabilitation clinic precisely 3 months after their stroke, about 80% of dropouts were outpatient visit follow-up losses. Nevertheless, this study is significant in that further studies with larger sample sizes could be more rationally designed based on the data from this study. Second, BMD values were measured only at 3 months after the stroke. Therefore, we could not determine whether changes in BMD resulted in long-term improvement in patient function. Third, this study did not recruit patients with diverse characteristics. With respect to feeding type, 19 (82.6%) patients had regular diets, and only 2 (8.7%) had soft diets and tube feeding. Therefore, we could not compare differences in BMD according to nutritional status. Also, for medications, 14 (60.9%), 11 (47.8%), 8 (34.8%), and 7 (30.4%) patients were prescribed anticonvulsant drugs, antidepressants, antidiabetics, and proton pump inhibitors, respectively. Therefore, a number of patients were on multiple drugs. Considering that osteoporosis can also be affected by nutritional and pharmacological factors, future research will be advanced by including participants with different dietary types and analyzing the effect of individual drugs on BMD. Finally, the current study measured BMD using DEXA. In early bone loss, the role of trabecular bone is important in influencing the mechanical strength of the bone [30]. However, DEXA is unable to measure the microarchitecture of trabecular bone, such as the number of trabeculae, connectivity, and thickness. Further studies can indirectly assess microarchitecture using the trabecular bone scale. Analyzing bone fragility using DEXA and trabecular bone scale together, rather than focusing on BMD alone to identify the pattern of trabecular bone loss in the early stages of stroke, is recommended.
In conclusion, this study suggests that initial trunk control ability is closely related to lumbar BMD in subacute stroke patients. Therefore, TIS scores can be used as a convenient and practical screening tool to predict patients at risk of vertebral bone loss in subacute stroke. Moreover, early rehabilitation programs that include trunk muscle strengthening and core balance training should be prescribed to prevent further lumbar vertebrae bone loss, trunk muscle atrophy, and prolonged immobilization.