


INTRODUCTION
In the United States, vascular problems (54%) and trauma (45%) account for most of the 1.6 million amputations performed. Among these, lower extremity amputations account for 65% [1]. Individuals who undergo lower-limb amputation are reported to experience more falls than healthy individuals because they have limited walking abilities and problems with balance [2]. They also show a decrease in physical activity associated with the time after amputation and age [3]. Approximately 31,000 transfemoral amputations (TFAs) are performed annually in the United States [4].
The decreased muscle volume within the involved limb influences the overall locomotor function of people with lower-limb amputation [5]. Studies have shown that individuals who undergo TFA have increased energy consumption during walking compared with those who undergo trans-tibial amputation [6-8]. In individuals who undergo TFA, the thigh muscles play an important role in the lower extremitiesвҖҷ function [9,10]. In addition, gait asymmetry was observed according to the peak torque of the hip flexor, hip extensor, and hip flexor to hip extensor ratio in patients with TFA [11]. Physically active individuals who underwent TFA generate stronger maximal muscle torque than inactive amputees [12].
In an uninjured population, the main determinant of maximum muscle force is muscle size [13]. Additionally, prior research has supported a positive correlation between muscle volume and the level of spontaneous activation of muscle groups [14]. Previous studies used magnetic resonance (MR) images to identify structural changes associated with aging and disuse in individuals who have undergone TFA [15-17]. According to the findings, three-dimensional (3D) modeling using MR images is a feasible means of verifying hip adductor volume and can be used to properly assess the cause of structural abnormalities, such as hip flexion contracture [16,17]. We hypothesized that a post-amputation decrease in femoral musclesвҖҷ volume of the involved limb may affect clinical functions, such as gait and balance, in a person with TFA. Therefore, this study aimed to evaluate the femoral muscle volume of the non-involved and involved limbs using 3D modeling based on MR images and clinical function in individuals who underwent TFA, and using prostheses to determine the relationship between lower-limb function and muscle volume of the involved limb.
MATERIALS AND METHODS
From June 2014 to May 2018, participants who visited the studyвҖҷs rehabilitation center were asked to participate in the study based on the following inclusion criteria: (1) aged 19 to 65 years; (2) underwent a unilateral TFA; (3) had no definite anatomical change due to trauma or surgery in the involved limb over the last 3 years post-amputation; (4) used a prosthesis to walk and perform daily activities; and (5) scored a good or higher grade in the manual muscle strength test of the amputated lower extremity. Individuals with a neurologic injury that may have involved lower-limb function or muscle volume, diseases of the central nervous system, cognitive dysfunction, or poor adherence to the study protocol were excluded. This cross-sectional study was approved by the Institutional Review Board of Chungnam National University Hospital (IRB No. 2014-09-030). All participants read and signed a study informed consent form approved by the local Ethics Committee.
Clinical assessments
Validated tools and equipment were used to check participantsвҖҷ walking, balance, and oxygen consumption rate during walking. Participants used their prostheses during all assessments, which were carried out on the same day by the same researcher. To evaluate lower-limb function, a 10-m walk test (10mWT), 6-minute walk test (6MWT), and the Berg Balance Scale (BBS) assessment were performed. The 10mWT was performed on 10 m of level-ground [18]. The 10mWT used the average of three measurements. The 6MWT was performed while walking on a 30-m level-ground track for 6 minutes. The BBS with prosthesis was performed following a previously reported method with a total score of 56 points [19].
The respiratory gas analysis was performed using a Cosmed K4B2 (Cosmed, Rome, Italy) while walking for 6 minutes at a comfortable speed on a treadmill and resting for 5 minutes. Comfortable walking was defined as walking intensity on the Borg scale between 9вҖ“12 points (very light to fairly light). The oxygen consumption rate (VO2; mL/kg/min), energy consumption per minute (kcal/min), mean gait velocity (m/min), and metabolic equivalent of task (MET) were recorded during the gait analysis. A Romberg balance test was performed using a balance system (NEW Balance System SD; Biodex Medical Systems, Shirley, NY, USA) while the participants were wearing their prostheses; the participants stood with their feet close together and balance ability was assessed. If they could not perform the test maintaining the correct posture, it was modified as needed, such as increasing feet width. Based on the equipmentвҖҷs manufacturerвҖҷs instructions, the overall stability index, anterior/posterior index, and medial/lateral index were used to assess sway. The overall stability index represents the variance in the center of pressure displacement in all directions, where a high score is indicative of a lot of movement during the test. The anterior/posterior index represents the variance in the center of pressure displacement for motion in the sagittal plane. The medial/lateral index represents the variance in the center of pressure displacement for motion in the frontal plane. Larger balance indices indicate more imbalance or sway.
Three-dimensional modeling with MR images
The study participants underwent femoral MR imaging (Magnetom Skyra 3T; Siemens, Erlangen, Germany) of both non-involved and involved limbs while in a supine position. Using MR images, one skilled researcher visually reconstructed the muscle by applying a specific color to the cross-section, and the volume of each muscle was estimated using the medical image processing software (Mimics; Materialise, Leuven, Belgium). Based on the anatomical function, the muscles were classified into four groups: hip flexor (sartorius, rectus femoris), hip adductor (adductor brevis, longus, magnus, and gracilis), hip extensor (gluteus maximus, semimembranosus, semitendinosus, biceps femorisвҖҷ short head, and biceps femorisвҖҷ long head), and knee extensor (vastus intermedius, medialis, and lateralis). However, the iliopsoas and gluteus maximus were excluded from volumetric analysis owing to insufficient volume measurements from the femoral MR images.
We evaluated the hip flexor/hip extensor because it may affect gait asymmetry. The ratio of hip flexors (sartorius, rectus femoris) to hip extensors (semimembranosus, semitendinosus, biceps femoris) was measured for analysis.
Statistical analysis
The demographic data and functional assessments are presented as meanВұstandard deviation or median and interquartile range (IQR). The femoral length and femoral muscle volume of the involved side were compared with the non-involved side using the nonparametric Mann-Whitney U test. Partial Spearman rank correlation analysis was used to analyze differences in muscle mass and hip flexor/hip extensor ratio with functional indicators, respectively. The statistical analysis was conducted using SPSS version 21.0 (IBM, Armonk, NY, USA). A p-value of <0.05 was considered statistically significant.
RESULTS
Of 40 potential participants, seven men who met the inclusion criteria were enrolled in the study. Of the 40 participants, 33 were unable to participate owing to bilateral lower limb amputation, inability to perform daily activities using a prosthesis, associated neurologic diseases and nervous injuries, or refused to participate in the study (Supplementary Fig. S1 ). The mean age of the participants was 50.29Вұ11.79 years, the average height was 1.73Вұ0.05 m, and the mean time after amputation was 7.21Вұ4.91 years. Participants wore an ischial containment socket (n=6) or a quadrilateral socket (n=1) and a silicon liner with lanyard suspension (n=2) or a silicon liner with suction-type suspension (n=5). Additional demographic information is summarized in Table 1.
The results of the clinical assessments are shown in Table 2. The mean walking speed was 1.26Вұ0.171 m/s during the 10mW T, and the mean walking distance was 301.66Вұ96.50 m for the 6MWT. The mean oxygen consumption rate during walking on the treadmill was 15.56Вұ3.28 mL/kg/min, and exercise intensity was moderate (4.08Вұ0.87 METs). In the balance test, the mean BBS score was 48.29Вұ4.61 points. The medial/lateral index was higher than the anterior/posterior index, resulting in higher left and right instabilities in the dynamic balance system.
In five participants whose bilateral femoral area remained intact according to the MR images, 3D modeling based on their femoral MR images was performed using an image processing program (Fig. 1). For two of the seven participants, MRI of the uninvolved limb could not be obtained. Muscle volume analysis was performed, except for the gluteus maximus muscle, which was excluded owing to the limitations of the femoral MR image data. Femur length was defined as the X-ray from the femoral head to the distal bony end of the involved limb. Statistical differences in femur length were found between the non-involved and involved sides (p<0.01), total muscle volume (p<0.01), and functional muscle group volume (p<0.01), except for the hip adductor group. In particular, the knee extensor muscle volume decreased the most (Table 3).
In addition, the correlations between the clinical assessment results with femur length and volume were confirmed using partial Spearman correlation analysis. There was no correlation between muscle volume and tread length, walking speed in 10mWT, and 6MWT. In the balance test, there was no correlation between muscle volume and tread length.
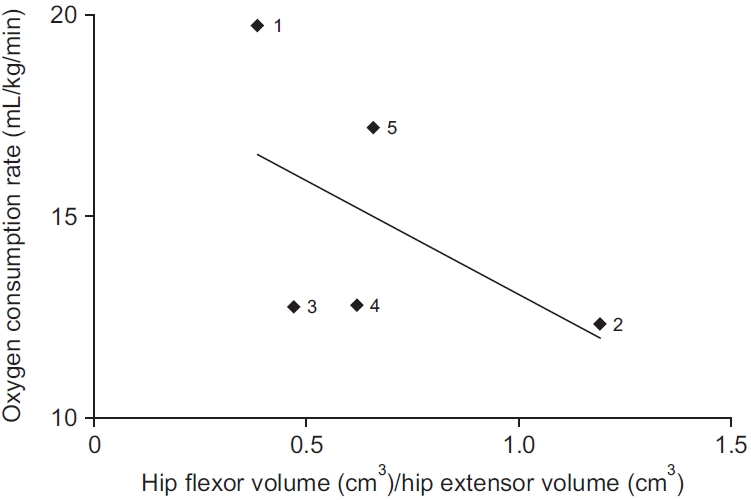
For the respiratory gas analysis, the hip flexor volume to hip extensor volume ratio in the involved limb and oxygen consumption rate during comfortable gait showed a negative correlation (r=-0.96, p=0.04) (Table 4).
DISCUSSION
Using femoral MR imaging and 3D reconstruction techniques, this study quantified the volume of femoral muscle groups in individuals with unilateral TFA and showed that while using prostheses, the ratio in muscle volume at the amputated limb is correlated with oxygen consumption rate of locomotor function.
For the 10mW T, the participants were requested to move quickly and the walking speed is reported to be slightly higher than during other evaluations [20]. For this study, the mean walking speed was <1 m/s when walking comfortably during the 6MWT. Participants seemed to walk well with their prostheses; however, the walking speed was similar to that of healthy 80-year-olds [21]. The energy consumption of a slow walk is generally 2 METs in a healthy individual [22]. In this study, the comfortable walking speed measured in the respiratory gas analysis was less than 1 m/s, but the MET value was 4.08Вұ0.87. As reported by Waters and Mulroy [8], the energy consumption while walking at a comfortable pace in individuals after TFA was greater than that in healthy individuals.
In the present study, the mean BBS was 48.29Вұ4.61. The BBS scores of healthy elderly people aged 70вҖ“75 years are reported to be 49.7вҖ“55.3, suggesting that the balance function of participants with TFA is lower than that of elderly people [23]. There was no correlation between the balance test and the difference in femur length and muscle volume. However, participants' artificial knee joint and foot-ankle assembly were not considered in the results. Therefore, the effects of the involved limb muscle volume on balance function should be confirmed by a well-designed clinical study.
It is well known that a person with TFA walks slower and consumes more energy during gait than a nonamputee counterpart [6,24]. The results of the present study show the association between muscle volume in the involved and uninvolved limbs in participants with a good walking performance rather than a comparison to participants without amputation.
In a previous study, the hip flexor to hip extensor ratio and isokinetic strength test affected the asymmetry of the anterior-posterior ground reaction force of the involved limb [11]. According to this study, the higher the volume of the hip flexor/volume of the hip extensor, the lower the oxygen consumption rate (Fig. 2). A study by Wentink et al. [25] showed no significant difference in muscle activity via surface EMG of the affected limb during the stance and swing phases in patients with lower leg amputation. However, in individuals with a transfemoral amputation, activity was found in the hamstring group in terminal stance compared to healthy individuals in gait analysis. The oxygen consumption rate may increase because of hamstring contraction. This may be the mechanism by which amputees increase socket fitting at the end of the stance phase, to prepare for the prosthesis lifting in the swing phase [26]. Based on previous reports, it can be considered that excessive activity of the hamstring may be required if the fitting of the stump and socket is not appropriate.
There are several study limitations to consider. For example, the sample size was small despite the broad inclusion criteria. To overcome the limitations, MR images and clinical tests were used to evaluate each participant comprehensively, and the data were analyzed using non-parametric statistical methods. In addition, baseline muscle volume could not be assessed because of the cross-sectional study design. As a result, the muscle volume difference between sides might be overestimated owing to the excessive use of the non-amputated side after TFA. Finally, because we checked the muscle volume from the femoral MR images only, the gluteal muscles, which play an important role in prosthesis control, were excluded from the analysis. One participant underwent pelvis MR imaging; therefore, additional 3D modeling could be performed. In the amputated limb, the volume of the hip flexor and adductor muscle groups were 26.9% and 21.4% smaller than those of the non-involved limb, respectively. In the hip external rotator, extensor, and adductor groups, the overall muscle volume difference was less than 10% between limbs. Consequently, we speculate that the decrease in muscle volume is most dominant in the amputated knee flexor and extensor, and the hip muscle volume, including the hip adductor group, seems to be maintained in individuals who walk with a prosthesis.
In individuals who undergo unilateral TFA, the ratio in the muscle volume between hip flexor and hip extensor is associated with oxygen consumption rate while using a prosthesis. Our results show that the larger the ratio of hip flexor volume/hip extensor volume, the lower the oxygen consumption rate. The muscle volume of the involved limb was not associated with a low balance index; however, this study lacked consideration of knee joint or foot-ankle assembly in the prosthetic. In future studies with a larger sample size, it will be helpful to investigate the relationship between the muscle and the function of the TFA by applying dual-energy X-ray absorptiometry, computed tomography, or MR imaging to evaluate the amputated limb muscle. In addition, including the pelvic and femoral muscle groups will add to the knowledge about physiological outcomes.