


INTRODUCTION
Amputation should be performed when it is unavoidable to sustain life. It causes not only functional loss, but also mental devastation and limitation of social activities [1,2]. To make an analytical policy for amputees, accurate statistics, such as the number of amputees, should be investigated. According to the statistics of amputees reported in previous studies, there are differences in the prevalence by country or race, and the causes of amputation are reported differently depending on the social, environmental, and health system states [3].
The United States reports 185,000 amputations each year, from 1.6 million in 2005 to be 3.6 million by 2050 [4]. In Saskatchewan, Canada, the incidence of amputation per 100,000 was reported to be 31.86 in the lower extremities and 5.84 in the upper extremities [5]. It was also noted that the number of minor lower limb amputations, such as those below the ankle amputation, increased, while the number of major amputations decreased [5]. In South Korea, 38.3 amputations occurred per 100,000 people, and finger amputation accounted for 93.7%, being the highest, according to Korean workers’ compensation insurance data in 2019 [6]. In particular, the number of amputations due to trauma decreased from 85.9% in the 1950s to 58.3% in the 1990s under the influence of industrialization, changes in transportation systems, and the diversity of diseases in South Korea [7]. On the other hand, amputations due to peripheral vascular disease gradually increased; that is, the incidence of lower extremity amputation was 10–15 times higher in patients with diabetes than in those without diabetes [7,8].
Disabled people have a higher prevalence of chronic diseases than non-disabled people, because of mobility restrictions and insufficient medical services. According to the Korea national data in 2018, 19.1% of disabled people were diagnosed with diabetes, while 11.1% of non-disabled people had diabetes, and the need for regular monitoring of diabetic risk factors was emphasized [9,10]. Amputation may affect the quality of life depending on the amputation level. Lower extremity amputation causes difficulties in social activities due to mobility limitations, and upper extremity amputation has been reported to have a low quality of life due to difficulties in specific daily activities [11]. Therefore, based on statistics, such as the prevalence of upper and lower amputations, detailed medical strategies can be approached.
The specific aims were to analyze (1) the trends of estimated prevalence of amputation cases in each year (2011, 2014, 2017, and 2020), (2) the trends of estimated prevalence of amputation cases between the upper and lower limbs according to the level and causes of amputations, and (3) the trends of changes in the health-related behaviors of amputees.
DATA SOURCE AND STATISTICAL ANALYSIS
Data were derived from the National Survey of Disabled Persons (NSDP) in Korea from 2011 to 2020. The NSDP has been conducted by the Korean Ministry of Health and Welfare and the Korean Institute for Health and Social Affairs since 1980. Data in the NSDP were cross-sectionally collected from a sample of persons with disabilities. The basic sampling frame for NSPD was extracted from the nationwide registration census, and then a representative sample of the disabled who lived in households was interviewed and surveyed once every three years [12]. In this study, we used data from 2011, 2014, 2017, and 2020. The NSDP includes individual data on the disability characteristics, health, socioeconomic status, and discrimination experiences of individuals with disabilities. For this study, among the physical disabilities, only data on amputation was extracted and the changes were compared in terms of the number of amputees and health-related characteristics at the time of investigation four times (2011, 2014, 2017, and 2020).
The number of amputees is estimated as the total number of all amputees divided by disabled persons. The crude prevalence rate was the number of amputees per ten thousand (10,000). Amputation was classified into upper and lower limbs, and the upper limb and the lower limb were divided into three levels—”above the elbow, between the elbow and wrist, and below the wrist” and “above the knee, between the knee and ankle, and below the ankle,” respectively, according to the amputation site. The causes of amputation were grouped into three categories: congenital, disease, and accidental events. Hereditary and chromosomal abnormalities, congenital developmental abnormalities, and chronic maternal diseases or infections were included as congenital causes. Accidents caused by violence, traffic accidents, disasters, and trauma were classified as accident events, and acquired causes of various diseases were included as causes of the disease.
For health-related characteristics in amputees, drinking, smoking, physical activity, chronic diseases (high blood pressure, diabetes, and depression), unmet healthcare needs, and regular health checkups were analyzed since 2011.
A stratified, multistage probability sampling design was used to collect data from the NSCP survey. To represent Koreans with disabilities, sampling weights were applied to the data, which weighted the sample for the disabled and reflected the sampling fraction. To compare the proportion of estimated prevalence of amputee, descriptive statistics was performed to calculate the estimated prevalence.
PREVALENCE OF AMPUTEES AMONG THE DISABLED PERSONS
As shown in Table 1, the total number of disabled people in 2020 was 2.62 million, of which 175,315 were amputees, a slight increase compared to 2011.
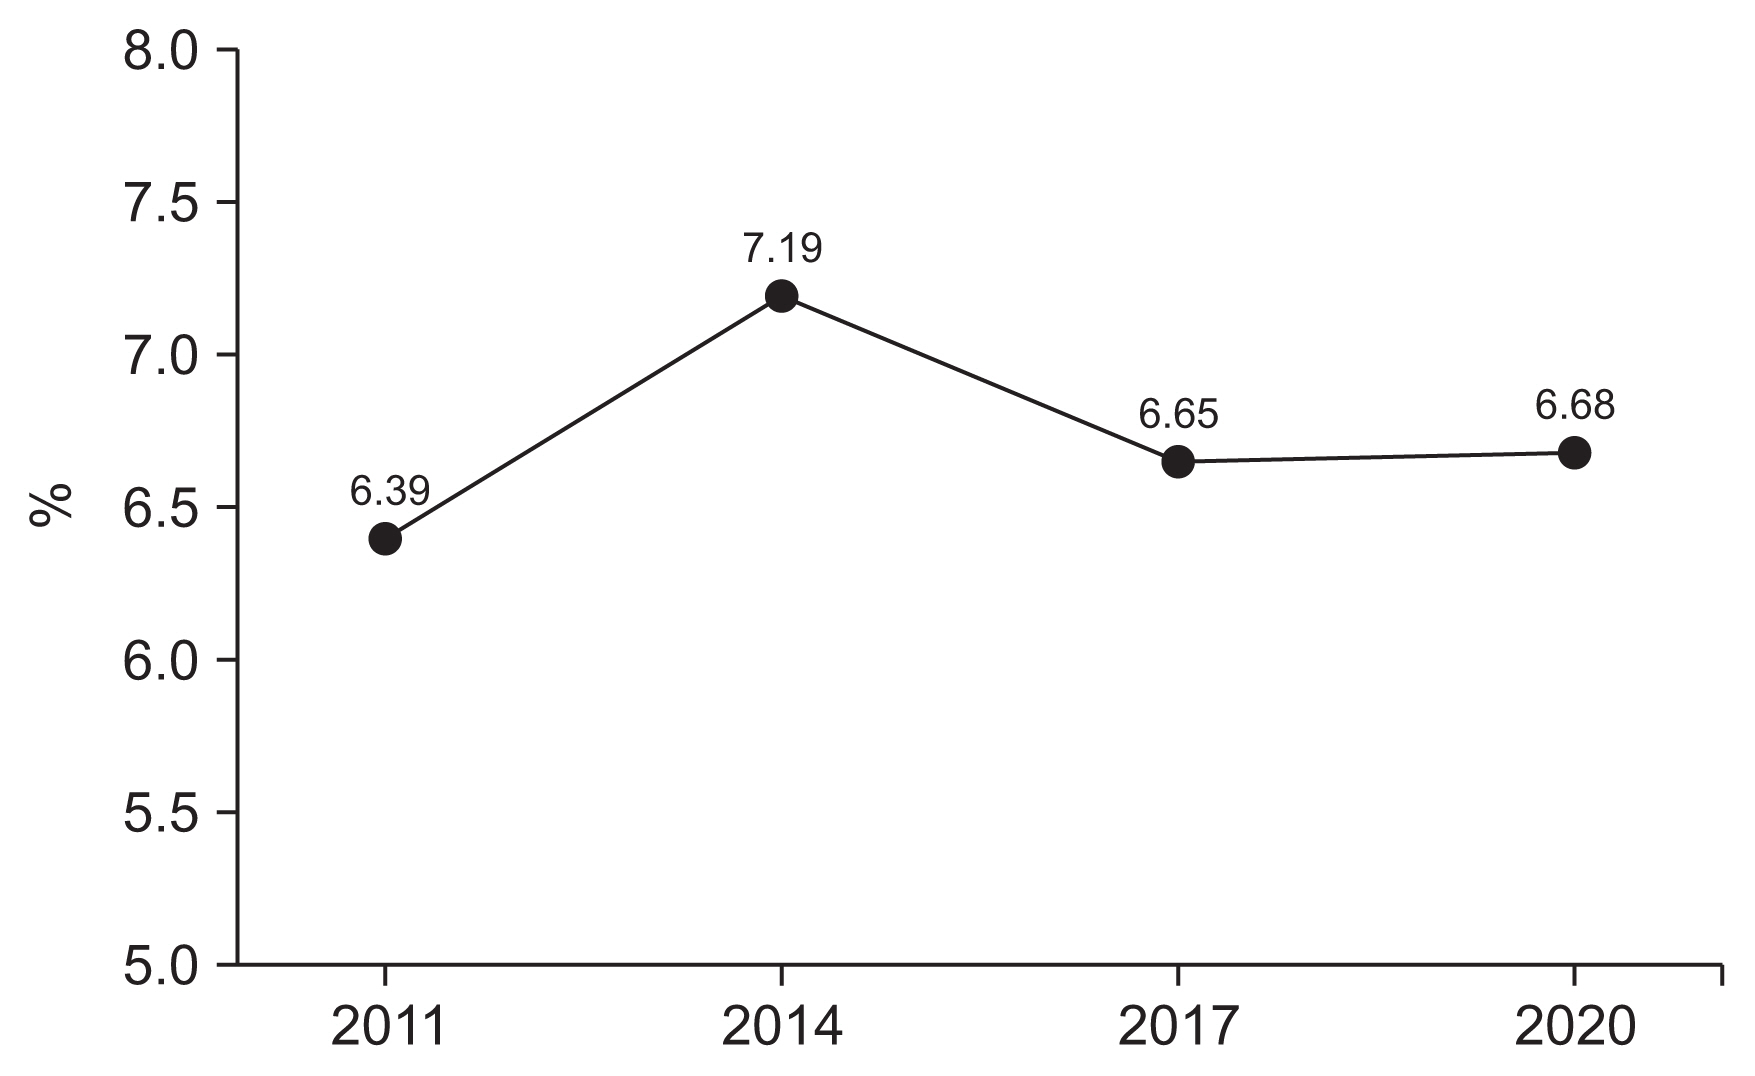
When analyzing the crude rates in 2011, 2014, 2017, and 2020, 639, 719, 665, and 668 persons per 10,000 persons with disabilities were amputees, respectively (Fig. 1).
Trends in amputation prevalence by level of and causes of amputations in the upper and lower limbs
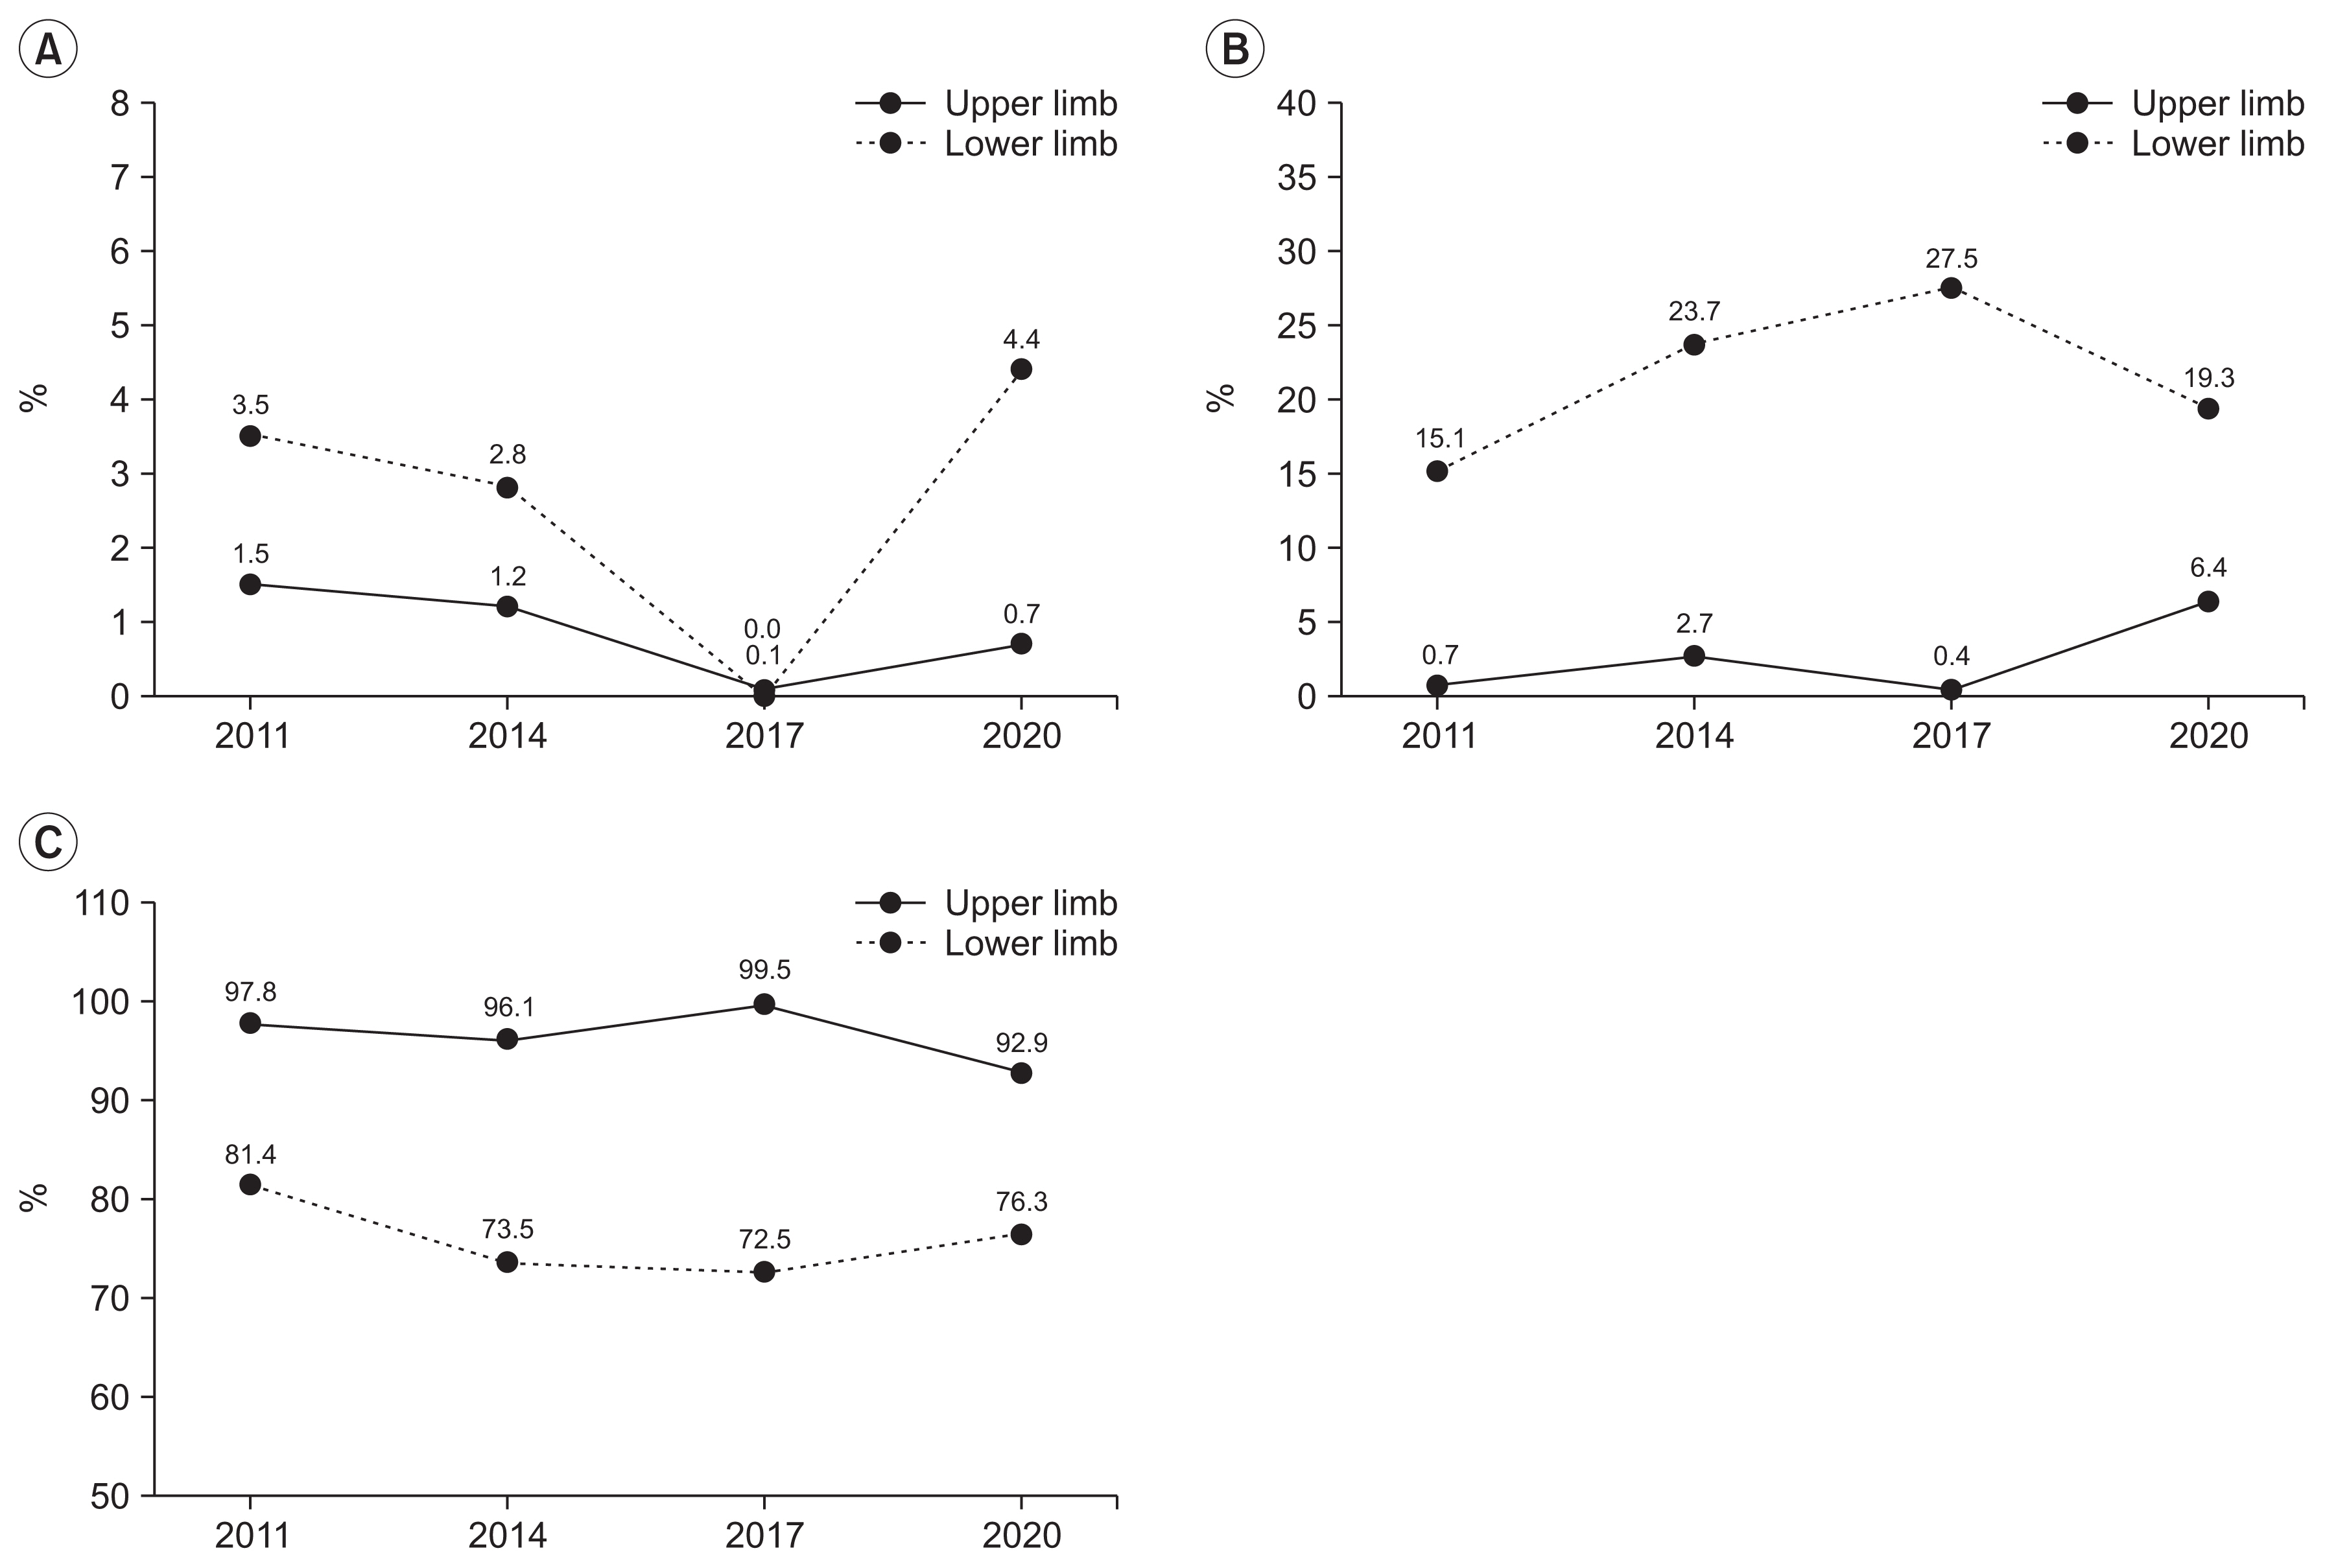
When the prevalence of amputation was estimated by year according to limb level, the prevalence of upper limb amputations was estimated to be 80.1% in 2011, 78.5% in 2014, 82.1% in 2017, and 71.6% in 2020 (Fig. 2). Among the upper limbs, amputation under the wrist was the most common among amputees in all the years. That is, 69.2% of amputees in 2011, 67.9% in 2014, 69.6% in 2017, and 54.7% in 2020 had amputations below the wrist. The estimated prevalence in the lower limbs was 19.9% in 2011, 21.5% in 2014, 17.9% in 2017, and 28.4% in 2020. Amputation between the knee and ankle was the most common among the lower limbs, with 9.6% in 2011, 11.5% in 2014, 7.1% in 2017, and 15.1% in 2020 (Table 2).
In this study, the prevalence of upper-extremity amputation was higher than that of lower-extremity amputation compared to previous studies [5], but the results were similar to those of other studies, except for amputation under the wrist [5]. It is supposed that there were many wrist amputations due to trauma, and that they had a longer lifespan than other amputees, which may have affected the prevalence. The order of prevalence of lower-extremity amputation was between the knee and ankle, below the ankle, and above the knee. Compared with 2011, the number of lower limb amputations increased in 2020, which is presumed to be due to the increase in dysvascular diseases caused by diabetes.
Analysis of the trends of the causes of amputation revealed that accidental events were the most common in both the upper and lower limbs. However, among the causes of amputation, those caused by accidental injury are decreasing, whereas those caused by diseases are increasing. It is noteworthy that when disease is the cause of amputation, it occurs more frequently in the lower extremities than in the upper extremities. The ratio of disease being a causative agent in the upper to lower limbs was 0.7% vs. 15.1% in 2011, 2.7% vs. 23.7% in 2014, 0.4% vs. 27.5% in 2017, and 6.4% vs. 19.3% in 2020 (Table 2, Fig. 3).
In the study of the prevalence of amputation in the United States, the causes of amputation were reported as dysvascular disease 54%, trauma 45%, and cancer 1% [4]. South Korea reported that the most common cause of amputation was trauma, accounting for approximately 72.3% of cases [7]. However, in previous studies, the prevalence of lower-extremity amputation was higher than that of upper-extremity amputation. In this study, it is presumed that trauma, the main cause of amputation, was largely reflected because the prevalence of upper extremity amputation, which had a rather high rate of trauma as the cause, was high. Overall, the increase in amputations due to dysvascular disease is consistent with the results of previous studies [1,9,13].
Trends of demographics and health-related characteristics in amputee
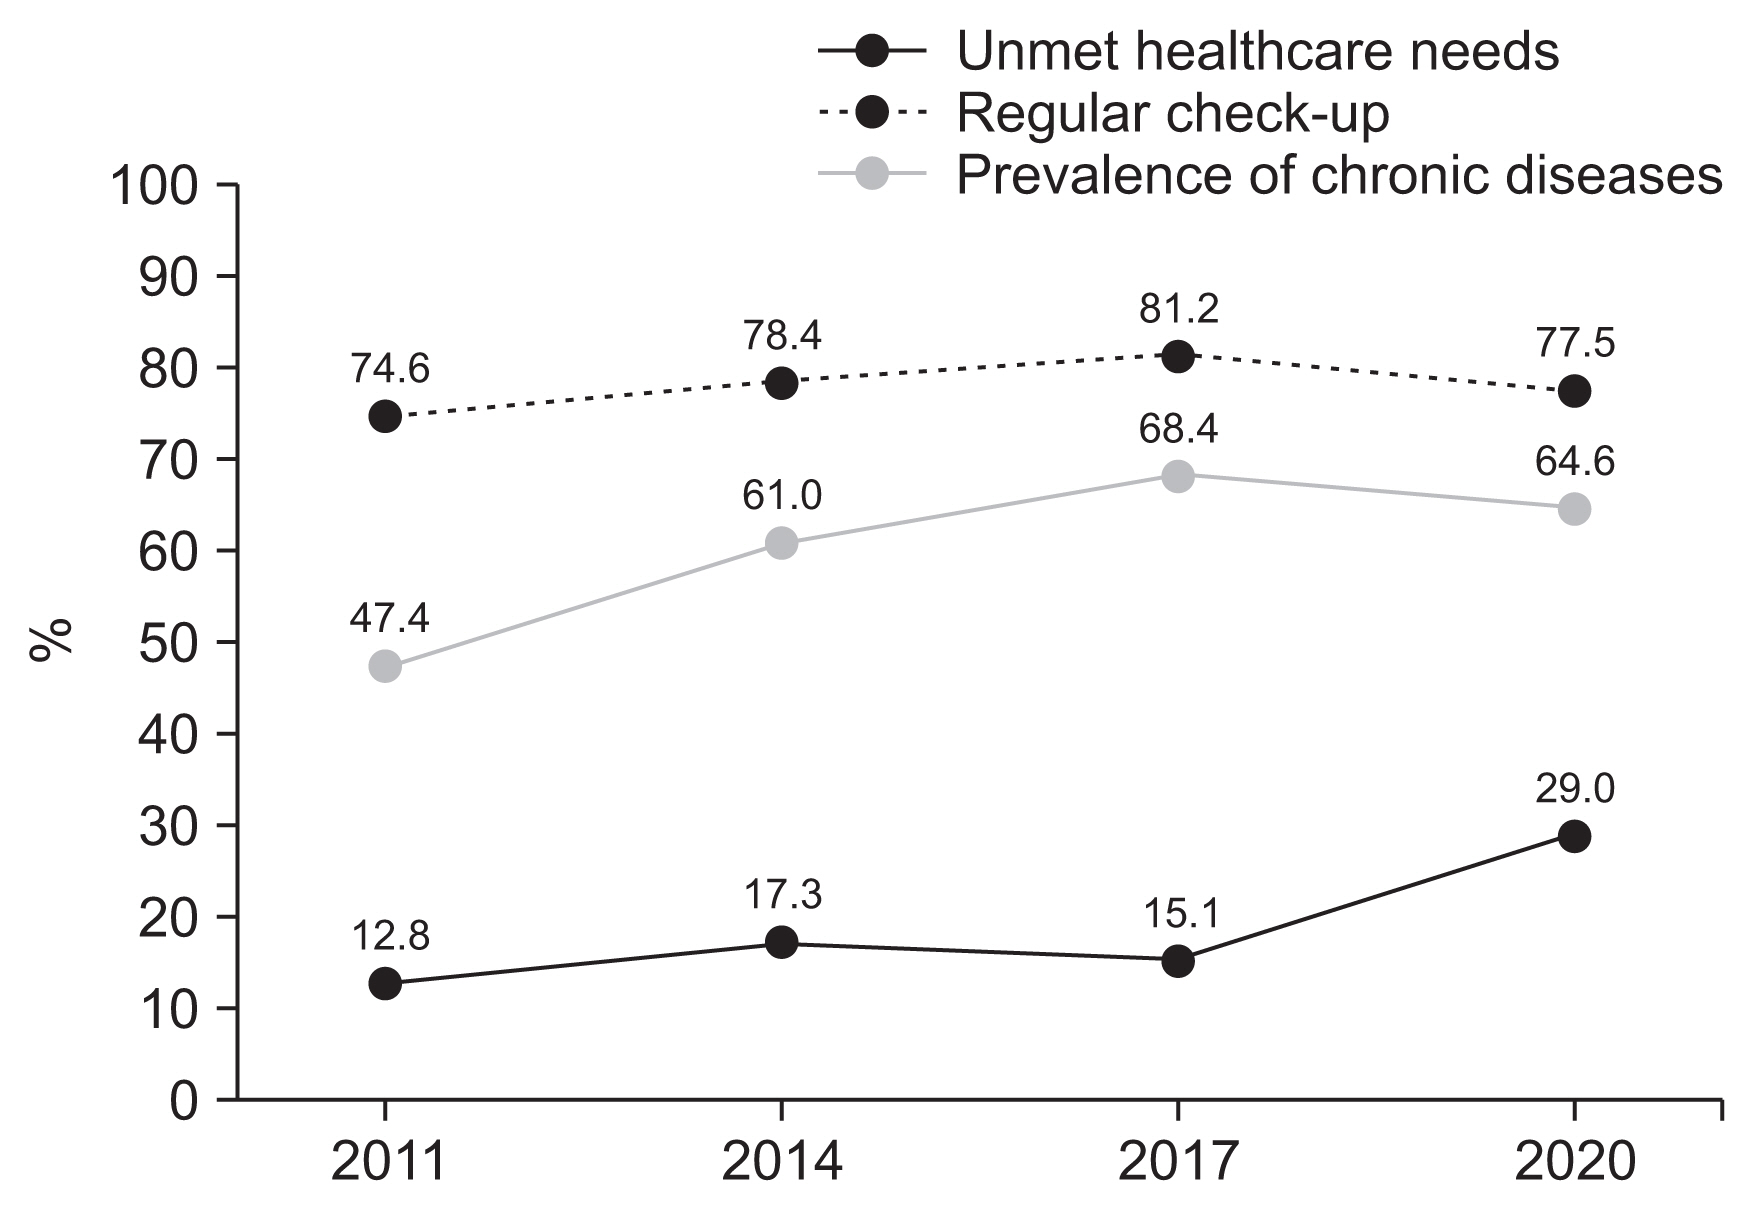
Table 3 and Fig. 4 present the trends of demographics and health-related characteristics, such as health behaviors (alcohol drinking, smoking, physical activity), chronic disease, unmet healthcare needs, and regular health checkups since 2011.
In sex distribution changes, the proportions of female amputees increased as 16.8% in 2011, 16.3% in 2014, 19.0% in 2017, and 23.3% in 2020. The mean age gradually increased, from 55.7 years in 2011 to 62.57 years in 2020. Analyzing the distribution by age group, prevalence of amputations in those in their 50s and older tended to increase, whereas that in those in their 40s and younger tended to decrease. The fact that amputation occurs more frequently in men and that the average age is aging is consistent with previous studies [4], and caution should be taken when amputation is increasing, particularly in women.
The distribution of people with jobs among amputees decreased, 61.2% in 2011, 58.2% in 2014, 59.1% in 2017, and 47.0% in 2020. The distribution of inappropriate health behaviors, such as alcohol drinking and smoking, among amputees decreased. The distribution of individuals with chronic diseases among amputees increased from 2011 to 2017, while the distribution of depression decreased from 2014 to 2020. The prevalence of diabetes in amputees was 29.6% in 2014, 33.0% in 2017, and 35.7% in 2020. The distribution of unmet healthcare needs increased as 12.8% in 2011, 17.3% in 2014, 15.1% in 2017, and 29.0% in 2020. However, the proportion of regular health checkups increased.
In previous studies, diabetes and peripheral vascular disease were reported as the major causes of amputation [13,14]. As a result of this study, it was identified that there is a need for a relevant study on how the increase in lower-extremity amputation is related to the increase in chronic diseases. There were positive improvements in health behaviors, such as drinking and smoking, of amputees. Alcohol consumption and smoking among amputees have continued to decrease since 2011, but the number of amputees with chronic diseases has increased. Although poor health behaviors are a major factor in chronic diseases, our data did not show consistent results. Therefore, it can be assumed that external factors influence an increase in chronic diseases. In fact, chronic disease management was insufficient owing to corona-virus disease 2019 (COVID-19) in 2020, and these results are estimated to be remarkable for amputees. Low regular health checkups and high unmet healthcare needs seem to indicate insufficient chronic disease management.
CONCLUSION
The number of amputees among people with disabilities is increasing in South Korea, and upper-limb amputation occurs more frequently than lower-extremity amputation. This is because amputations below the wrist account for a greater proportion in South Korea than in other countries. The mean age and chronic disease in amputees increased since 2011, and the increasing proportion of dysvascular diseases as the cause of amputation is consistent with that reported in other studies. A limitation of this study was that it was possible to estimate the amputation rate using national data, but information on the incidence rate was insufficient. In the future, a large-scale study is needed to longitudinally survey the occurrence of amputation and its causes. Nevertheless, this study is expected to be helpful not only for statistical research on amputees but also for establishing health and medical policies for the disabled.