This is an Open Access article distributed under the terms of the Creative Commons Attribution Non-Commercial License (http://creativecommons.org/licenses/by-nc/4.0/) which permits unrestricted non-commercial use, distribution, and reproduction in any medium, provided the original work is properly cited.
To present new classification methods of knee osteoarthritis (KOA) using machine learning and compare its performance with conventional statistical methods as classification techniques using machine learning have recently been developed.
Methods
A total of 84 KOA patients and 97 normal participants were recruited. KOA patients were clustered into three groups according to the Kellgren-Lawrence (K-L) grading system. All subjects completed gait trials under the same experimental conditions. Machine learning-based classification using the support vector machine (SVM) classifier was performed to classify KOA patients and the severity of KOA. Logistic regression analysis was also performed to compare the results in classifying KOA patients with machine learning method.
Results
In the classification between KOA patients and normal subjects, the accuracy of classification was higher in machine learning method than in logistic regression analysis. In the classification of KOA severity, accuracy was enhanced through the feature selection process in the machine learning method. The most significant gait feature for classification was flexion and extension of the knee in the swing phase in the machine learning method.
Conclusion
The machine learning method is thought to be a new approach to complement conventional logistic regression analysis in the classification of KOA patients. It can be clinically used for diagnosis and gait correction of KOA patients.
Osteoarthritis (OA), which is defined as the degeneration of joint cartilage and the underlying bone, is the most common joint disease. It can also be described by joint symptoms including pain and stiffness and/or structural pathology affecting many joint tissues [1]. It is clinically known that the knee joint is the most common site afflicted by OA despite the potential for any joint involvement [2]. Knee osteoarthritis (KOA) is the most common source of pain, disability, and functional loss in adults, consequently leading to abnormal gait patterns. As KOA seems to be much more prevalent today due to the increased life expectancy and body mass index (BMI) in modern times, early intervention is required through accurate early diagnosis of KOA [3].
There are various tools to classify KOA including radiological, arthroscopic, and functional scales [4]. The mainstay for diagnosing KOA is plain radiography and the Kellgren-Lawrence (K-L) grading system, which assigns a grade from 0 (no presence of OA) to 4 (severe OA), is the most commonly used [5].
Gait analysis systems can provide information on the biomechanical response of the human body to musculoskeletal disorders like KOA with non-invasive methods [6]. Some studies investigated the kinematic changes during the gait cycle and reported decreased knee joint motion during flexion, a decreased knee flexion angle during the stance phase, and an increased knee flexion angle at heel strike [7-10]. Others showed kinetic changes in KOA patients including a reduced internal knee extensor moment to reduce the loading on the knee joint, increased first peak knee external adduction moment, and initial contact with the ground with a more extended knee [10,11].
Previous studies on gait analysis mainly used spatiotemporal parameters such as step length and gait speed; kinematic parameters such as joint angle; and kinetic parameters such as ground reaction force and moment. In terms of the statistical techniques used in the study, conventional statistics such as a t-test or Mann-Whitney U test were used [10,12]. In statistically more precise studies, principle component analysis or multiple regression analysis were used [6,13,14].
We can obtain dynamic and segmented gait data, which is difficult to obtain through plain radiography, by gait analysis. When this is applied to a clinical trial, there is the advantage that rehabilitative interventions for the gait patterns of KOA patients can be performed together. However, a vast amount of gait data from gait analysis still remains limited for clinical use, and machine learning techniques have been introduced to compensate for this limitation and improve the classification accuracy.
Recently, there have been many attempts to classify and distinguish abnormal pathologic gait patterns via combining machine learning-based techniques with gait analysis system in the medical field [15-18]. When analyzing gait patterns through machine learning-based techniques, a machine classifier is necessary and the support vector machine (SVM) has been established as a successful technique for pattern recognition [19].
Therefore, this study aimed to present anew classification method of KOA patients using machine learning and evaluate the accuracy of classification by comparing it to conventional statistical analysis methods.
MATERIALS AND METHODS
Subjects
This study was performed on age-matched KOA patients (n=84) and normal participants (n=97). KOA was diagnosed through plain radiography and graded according to the K-L grading system. Subjects without knee pain, joint stiffness, gait problems, or a history of being diagnosed with KOA were considered normal participants. Before all subjects decided to participate in this study, the purpose and methods of the study was fully explained to them. Additionally, participants provided informed consent.
Prior to beginning the study, we asked subjects to maintain their usual lifestyle. In preparation for any problems, we contacted them over the phone during the experiment to check their condition or whether they had any health problems. When subjects visited our institution, they provided their own elementary demographic information including sex and age, and KOA patients were assessed for the severity of their disease through plain radiography. All demographic characteristics including age, height, weight, and BMI are described as the mean values in both the control and KOA groups (Table 1). Also, KOA patients were clustered into three groups according to the K-L grade of their affected limb via plain radiography: mild, as definite osteophyte and possible joint space narrowing on the anteroposterior weightbearing radiograph; moderate, as multiple osteophytes, definite joint space narrowing, sclerosis, and possible bony deformation; and severe, as large osteophytes, marked joint space narrowing, severe sclerosis and definite bony deformation. The affected limb was defined as a more symptomatic side in bilateral KOA patients and an ipsilateral side in unilateral KOA patients. This study was approved by Hanyang University Guri Hospital Institutional Review Board (No. 2016-06-014).
Gait analysis and experimental equipment
All subjects completed ten walking trials with a 10-m gait course. Gait trials were done in a quiet environment with proper speed for participants. We subdivided each gait cycle to easily understand and utilize it for research. Gait cycles were divided into the stance phase (SP) and swing phase (SW), and then, the SP into the initial double support phase (IDS), single support phase (SS), and terminal double support phase (TDS). Three-dimensional (3D) kinematic data from the hip, knee, and ankle joints were also gathered. All subjects performed all components of the experiments in the same environments and conditions.
In this study, a major piece of equipment for analyzing gait patterns was the inertial measurement unit (IMU)- based system (Human Track; RBiotech Co. Ltd., Seoul, Korea). Its main components consisted of a gyroscope, magnetic sensor, and accelerometer. For measuring angular velocity and proper acceleration, the triaxial gyroscope and accelerometer were used, respectively. We obtained information on the azimuth angle through a magnetic sensor. The 3D motion information was obtained using the gyroscope, accelerometer, and magnetic sensor in all three axes. The wearable IMU used in this study was wireless and attached to the lower abdomen, both sides of mid-thigh level, tibial shaft, and feet dorsum. According to Aminian et al. [20], gait analysis using a gyroscope was able to effectively estimate spatiotemporal parameters. In a previous study, the validity of applying the IMU system consisting of a gyroscope, accelerometer, and magnetometer to gait analysis was also verified [21]. Because temporal gait parameters are used to compute higher-level gait features and the accuracy of spatiotemporal parameter measurement using IMU was evaluated as appropriate, our study could also measure the gait cycle and divide it into four phases using IMU [22].
The hardware of the gait analysis system used in this study consisted of PC and wireless IMU sensors (Fig. 1). Using a Bluetooth module with 100 Hz serial peripheral interface (SPI) communication, the PC received signals from the sensors without direct connection.
Extraction of kinematic parameters and segmentation of the gait cycle
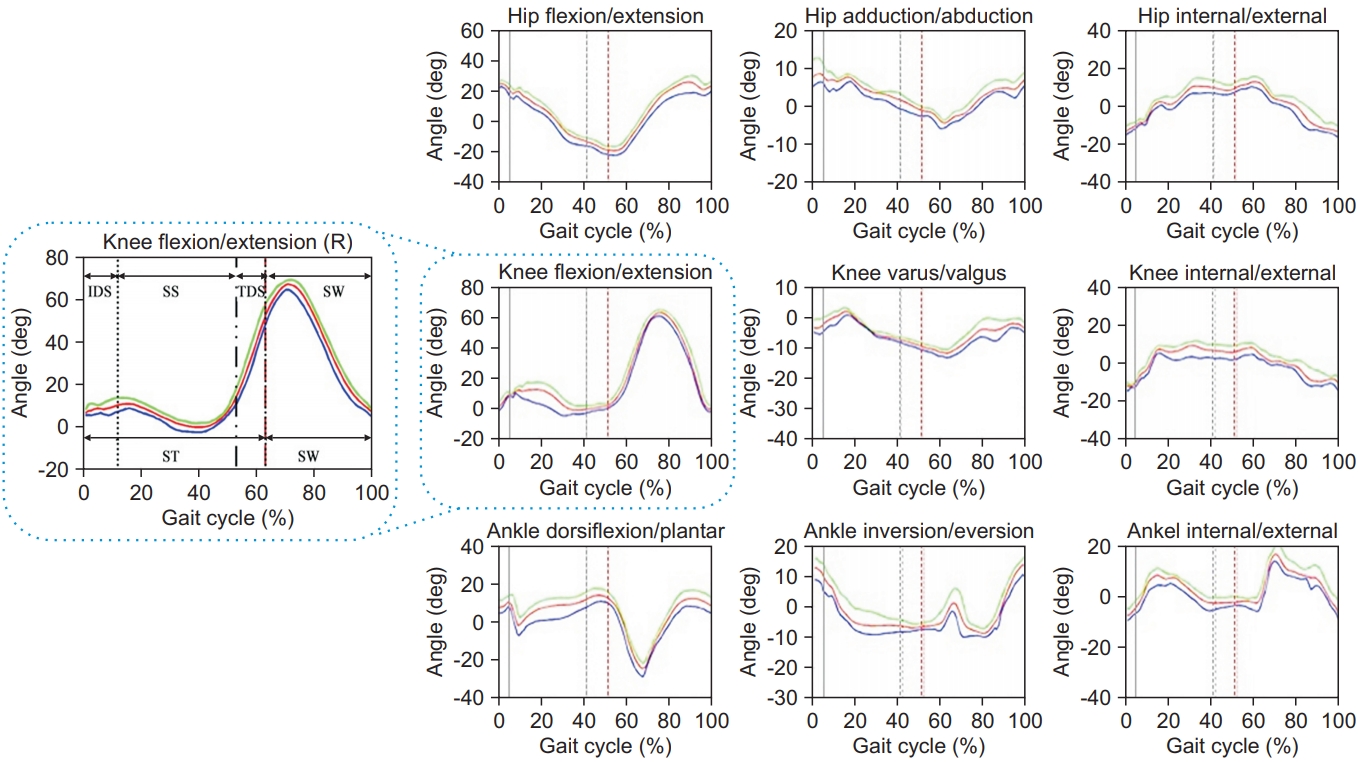
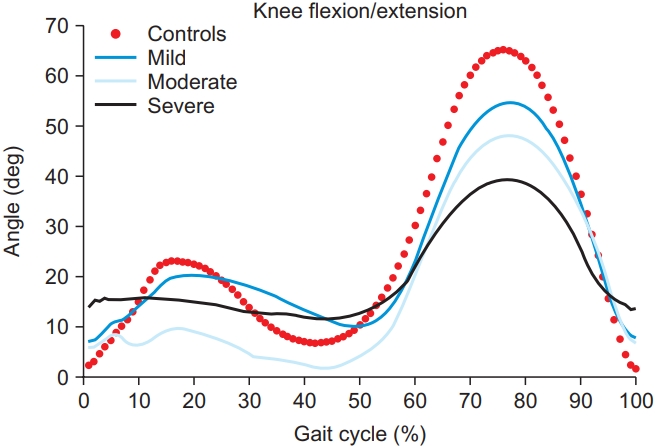
Utilizing the motion information gathered from all sensors attached to the patients, the 3D joint angles were calibrated. In this study, the gait data on both sides of the limbs were averaged based on the gait cycle. This is because we believed that if we analyzed the left and right sides separately, the number of cases would be too large to lead to a meaningful performance of the machine learning method. Based on the data, we were able to show how the joint angle changed throughout the whole gait cycle (Fig. 2). And then, 72 gait features could be listed to classify KOA patients, which described the kinematic components of the gait patterns (Table 2). Through the process of subdividing joint angles during the gait cycle, abnormal gait patterns and their cause could be explained.
Machine learning application for the classification of knee osteoarthritis
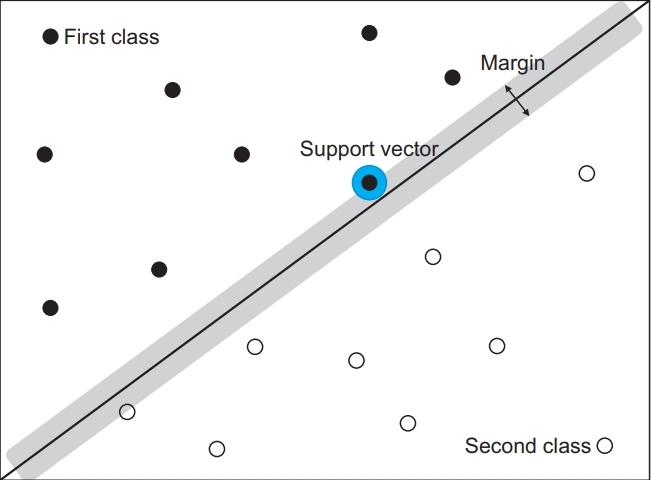
To classify KOA patients and severity, a machine learning algorithm was used in this study. The SVM is a supervised learning model with associated learning algorithms used to find a support vector. A support vector is an optimal hyperplane that separates two data classes. The SVM figures out the hyperplane with a maximum-margin via process finding two data in two groups with the shortest distance. It is a brief overview of the SVM (Fig. 3), and if it cannot draw a dividing line in two-dimensional space, the kernel function can be applied in a higher dimensional space to classify data.
With the z-scores calculated, all gait features were normalized and then applied to the classifiers. In this study, a 5-fold cross-validation scheme was performed to assess the possibility of generalization of the classifier, and the results were attained through the accuracy result. After splitting data set into five subsets, one subset was used as a test set and the remaining four subsets were used as training sets.
From all gait analyses, we collected the feature set data and operated it using the MATLAB Classification Learner Tool. Using the SVM classifier, we calculated the distance between data from KOA patients and normal subjects and generated a model capable of classifying each cluster by distance. A flow chart of our classification algorithm is shown in Fig. 4. By using this algorithm, we generated a model that can classify KOA patients through a machine learning technique. For successful feature selection that is notably sensitive to feature interactions, the ReliefF algorithm was used. A feature score for each feature was calculated and applied to find the highest scoring features for feature selection. A flow diagram of this algorithm is shown in Fig. 5.
Statistical analysis
We also performed a logistic regression analysis to compare the results of conventional medical statistical methods and machine learning in classifying KOA patients and normal subjects. Age, gender, height, weight, duration of one gait cycle, gait speed, cadence, and the maximum knee flexion angle were used as covariates and the presence of KOA (KOA patients group vs. normal subjects group) was used as dependent variable in the logistic regression model. Odds ratios (ORs) and 95% confidence intervals (CIs) were used to show the associations in the logistic regression analysis, and Nagelkerke’s R2 statistic was calculated to determine the variance in classification of KOA patients and normal subjects. Statistical analysis was performed with SPSS Statistics software (IBM SPSS, First Armonk, NY, USA).
RESULTS
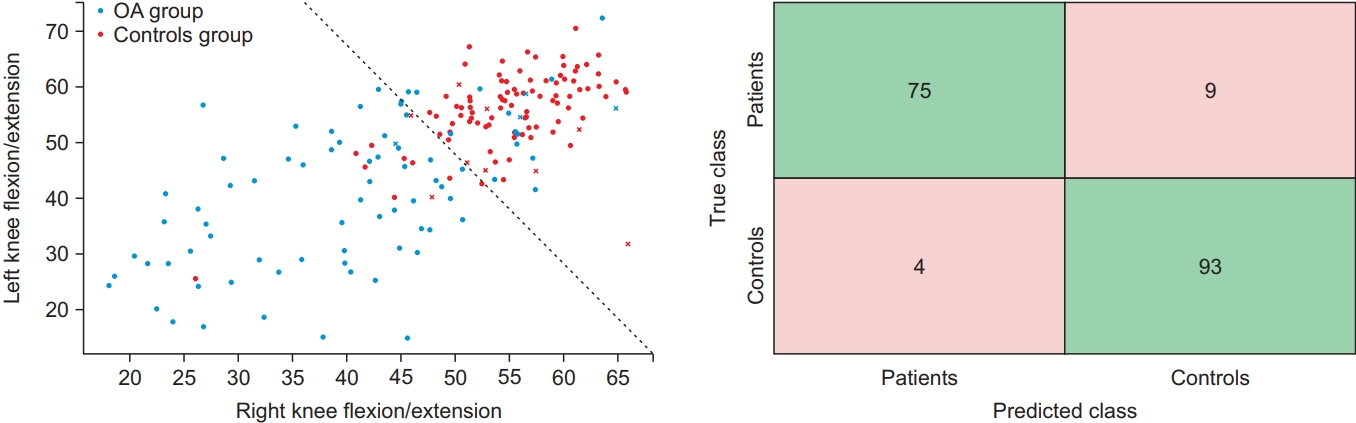
Primarily, the result values of basic gait parameters for each group are shown in Supplementary Table S1. The mean and standard deviation values for the range of motion (ROM) of the aforementioned 72 gait features are shown in Supplementary Table S2. All subjects were divided into two groups (KOA and control) based on the 72 gait features. We used the MATLAB Classification Learner to assess the accuracy of the SVM classifier, which was 92.8% (Table 3). Then, machine learning-based classification through the SVM classifier was shown as a scatter plot with two-dimensions. We constructed a 2×2 confusion matrix with actual and predicted values, and visualized the performance of machine learning-based classification (Fig. 6).
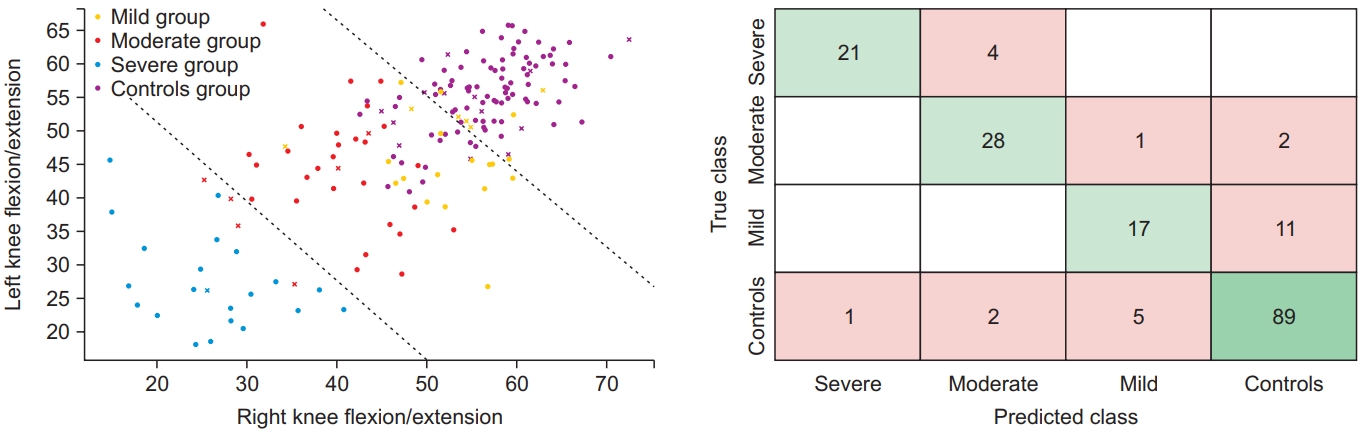
We also classified the severity of KOA patients by the 72 gait features. Calculated in the same way as mentioned above, the accuracy of the SVM classifier was 81.2%. To know how the number of the features affects our classification, a forward feature selection algorithm was used in this study. By using the ReliefF algorithm, we found the best combination of kinematic features among all 72 features. As a result, we found the 10 features which showed the highest accuracy of 85.6% and were superior to classification with all 72 features (Table 4).
As the same as above, we displayed machine learningbased classification through an SVM classifier in scatter plot form with two-dimensions. We also constructed a 4×4 confusion matrix with actual and predicted values, and visualized the performance of machine learningbased classification (Fig. 7).
Regarding the feature selection process using the ReliefF algorithm, Fig. 8 shows the accuracy of each feature set and the highest accuracy of classification was found to be 85.6% when optimal 10 features were used. It is noteworthy that classifiers trained with a suitable number of features showed better performance in classification.
In addition, among the 72 gait features representing the kinematic data of subjects, the three most critical features in abnormal gait were listed by the level of their contributions. When classifying KOA patients and normal subjects, the primary contributions were left knee flexion and extension in the SW, secondary contributions were right knee flexion and extension in SW, and the tertiary contributions were ankle dorsiflexion and plantarflexion in the SS. When classifying mild, moderate, and severe KOA patients and normal subjects, the primary and secondary contributions were the same as those from the previous classification, and the tertiary contributions were internal and external knee rotation in the SS.
In the classification of KOA severity in this study, Fig. 9 presents the most crucial features in the sagittal plane of the knee.
In the logistic regression analysis for the classification of KOA patients and normal subjects, the final model included the maximum knee flexion angle of the right (OR=1.106; 95% CI, 1.038–1.179; p=0.002) and left (OR=1.110; 95% CI, 1.039–1.186; p=0.002) knee and cadence (OR=1.076; 95% CI, 1.017–1.138; p=0.010). The final logistic regression model explained 58.0% (Nagelkerke’s R2) of the variance in the classification of KOA patients and normal subjects and correctly classified 83.9% of cases (Table 5).
DISCUSSION
Today, as physicians have begun to recognize that KOA is caused by various factors including genetic, inflammatory, and mechanical processes, KOA, to a certain extent, is thought to be a preventable disease. Therefore, early intervention is required through accurate early diagnosis of KOA.
The severity of KOA can be assessed by radiologically (K-L grading system), arthroscopically (Collins system), and functionally (Western Ontario and McMaster Universities Osteoarthritis index) [23,24].
The most widely used method of radiologic grading and KOA identification is described by Kellgren and Lawrence as the K-L grading system [5,23]. Although it has been used for decades, debates regarding its limitations are ongoing. The K-L grading system has difficulty in evaluating the progress of disease and can be harmful due to the repetitive radiation exposure. Since many studies have adapted this classification in various ways, it can also be inconsistent with its original description [5,25]. Simultaneously, some previous studies have criticized the consistency of the pre-standardized classification of KOA. Schiphof et al. [26] performed an epidemiological cohort study from 1966 to 2005 to summarize the different descriptions of KOA classifications from previous studies. Remarkably, disagreement on the definition and grading system of KOA between some major OA cohort studies was shown despite their accordance with following the original K-L grading system. Some studies even had inconsistencies within themselves.
In the past few decades, the technology related to human motion analysis has shown remarkable advancements and as a result, our understanding of human body motion and the accuracy of gait analysis have significantly improved. Consequently, gait analysis can be utilized in the medical field and considered a clinically useful technique.
Recently, the effort to use gait analysis as a methodology for KOA research and actual clinical application has increased significantly [15]. Many studies on KOA using gait analysis investigated representative gait patterns of KOA patients and reported differences in gait parameters compared to normal subjects [10,11,27-29].
Mills et al. [30] conducted a systematic review and meta-analysis on the biomechanical deviations of KOA patients. It revealed spatiotemporal parameters as a great scale to determine the severity of KOA. Astephen et al. [31] implied that as the disease progressed, the role which the biomechanical factors played depended on the different stages of severity. Previous studies have reported the kinetics and kinematics for different stages of KOA. In terms of kinetics, Mundermann et al. [10] reported a sufficient hip adduction moment and reduced second peak knee adduction moment in less severe KOA patients, and reduced hip adduction moment and increased first peak knee adduction moment in more severe KOA patients considering the gait compensatory mechanism. Similarly, Chang et al. [32] reported that a greater hip abduction moment occurring during gait reduced the progression of ipsilateral medial KOA in relatively less advanced KOA patients. Meissier et al. [33] and Al-Zahrani and Bakheit [12] conducted studies in more severe KOA patients and reported significantly reduced ROM in the hip, knee, and ankle joints. They reported that these kinematic gait abnormalities observed in severe KOA patients were due to the instability of the knee joint, and rehabilitative interventions that improved knee stability enhanced the walking ability of severe KOA patients. KOA is a joint disease, which inevitably affects all lower limb joints including both sides of the hip, knee, and ankle. In addition, through analysis of the gait of KOA patients in a number of previous studies, the most significantly changed kinematic parameter was determined to be the knee flexion ROM [6,34]. Therefore, in this study, we proceeded using ROM data in the kinematic parameters.
However, previously used camera-based gait analysis cannot be easily performed due to challenges such as appropriate space, costs, and time required for testing [35]. It also requires complicated image processing and appropriate lighting conditions to operate normally [36]. To compensate for the limitations shown in camera-based methods, this study used a wireless form of wearable IMU. The strength of wearable IMU systems is that they are radiation-free, small-sized, and cost effective, and it made them to be widely used. Beange et al. [37] reported that the IMU system not only had a higher accuracy compared to Vicon but also was sufficient to be used in clinical settings.
Today, almost every part of our daily lives is affected by machine learning and big data. In general, clinicians can feel unfamiliar with big data and machine learning. However, machine learning is a similar method in principle to traditional statistics. Machine learning has emerged as an important and powerful technique in the medical field. By applying machine learning to clinical settings, we can expect advances at the level of global health. By developing a prognostic algorithm, better assessments can improve the care for patients with various diseases and thereby improve the prognosis. A large part of the role of anatomical pathologists and radiologists will be replaced by machine learning. Finally, through machine learning, diagnosis will become more consistent and accurate [38].
Shetty et al. [17] reported the successful classification of Parkinson’s disease from amyotrophic lateral sclerosis, Huntington’s disease, and healthy controls using a machine learning method. This study used a Gaussian radial basis function kernel based SVM classifier and achieved an overall classification accuracy of 83.33% after feature vector selection. Mezghani et al. [18] classified asymptomatic and KOA subjects. They analyzed gait patterns by measuring the 3D ground reaction force, and the data was classified using the nearest neighbor rule. Finally, with the wavelet decomposition using force components in the frontal and transverse planes, the accuracy of classification between the two groups was 94%.
In this study, using all 72 gait features for machine learning-based classification, the results revealed a classification accuracy of 92.8% between the KOA and control groups, and 81.2% among three groups according to the severity of KOA. Then, the process of feature selection needed to classify KOA patients according to the severity was performed by ReliefF algorithm, and we found that not all features were necessary to classify the severity of KOA. Consequently, when 10 optimal features were used in classification, the accuracy showed the highest value of 85.6%. These results suggest that the process of feature selection increased efficiency in data processing and the accuracy of classification by excluding unnecessary gait features. Therefore, the eventual reduction in the number of used features is helpful for optimizing machine learning algorithms and helping clinicians to easily understand the process. This improvement of accuracy via feature selection was supported by previous studies about classification of scoliosis and diagnosis of glaucoma [16,39].
From the gait analysis in this study, the data on kinematic and spatiotemporal parameters were gathered from the sensors attached to the patients. Based on the data, dynamic changes of the joint angle according to the four segmented stages (IDS, SS, TDS, and SW) are described in Fig. 2.
As previous studies that incorporated gait analysis into KOA assessment have mainly used conventional statistics such as t-tests and regression analyses [40], we also conducted a logistic regression analysis as a conventional medical statistical method to compare the results with the machine learning-based method for the classification of KOA patients and normal subjects. From the logistic regression analysis using both the demographic characteristics and spatiotemporal parameters, we found the final model with the maximum knee flexion angle and cadence. This final logistic regression model correctly classified 83.9% of cases, which was lower than the machine learning-based method which correctly classified 92.8% of cases. Even though the independent variables used in the two methods were not identical to each other, we could acquire the additional evidence of methodological validity in the machine learning-based classification method.
There are several limitations in our study. First, although gait speed is known to affect gait kinematics, we conducted this study without controlling for gait speed. We thought that instead of controlling gait speed by performing gait trials on a treadmill, it was more important to analyze the subjects’ gait patterns in their daily lives under the same experimental conditions. Second, this study failed to control for the effects of pain which are one of the most common symptoms of KOA patients and can also affect the kinematics of gait. Third, we did not perform radiographic evaluation of the normal control group because of the risk of radiation exposure. Thus, we could not compare radiologic findings between KOA patients and normal subjects. Fourth, in this study, we conducted the study based only on the K-L grade of the affected limb which was defined as the more symptomatic side, and patients with symmetric severity of KOA were excluded from the study. In the future, it would be a good idea to collect enough study subjects and conduct research on patients with symmetric severity of KOA. Fifth, although we were able to achieve considerable reliability in the machine learning-based classification of KOA patients, research on either modification of abnormal gait patterns or future treatment was not included in this study. Therefore, the study on these aspects needs to be conducted afterwards.
In conclusion, this study proposed a new KOA classification method using machine learning for KOA patients and normal subjects and compared its performance with the conventional statistical processing technique. We recognized that the machine learning-based method could complement conventional logistic regression analysis in the classification of KOA patients and normal subjects. Furthermore, the machine learning technique is thought to be able to overcome a clinician’s lack of access due to limitations on the complexity and massive amount of data presented in gait analysis. In addition, we expect that the results of this study can be used for the diagnosis of KOA patients and rehabilitative intervention through gait correction.
ACKNOWLEDGMENTS
This work was supported by the Medical Device Technology Development Program (No. 201900000002517, Development of patient custom active rehabilitation total solution) funded by the Ministry of Trade, Industry and Energy (MOTIE) and by Institute for Information & communications Technology Promotion (IITP) grant funded by the Korean government (MSIT) (No. 2017-0-01800, Development of AR sports training platform based recognition technology on smart glass).
CONFLICTS OF INTEREST
No potential conflict of interest relevant to this article was reported.
AUTHOR CONTRIBUTION
Conceptualization: Jang SH, Park JH, Cho J. Methodology: Jang SH, Cho J. Formal analysis: Yang JH, Park JH, Cho J. Project administration: Yang JH, Jang SH, Cho J. Visualization: Yang JH, Cho J. Writing – original draft: Yang JH. Writing – review and editing: Yang JH, Jang SH, Cho J. Approval of final manuscript: all authors.
A hardware of the gait analysis system consisting of PC and wireless IMU sensors (A), and gait trial of knee osteoarthritis patient (B) and normal subject (C). IMU, inertial measurement unit.
Fig. 2.
The gait waveform data of one representative normal subject’s lower limb was divided and expressed by each segmented gait phase.
Fig. 3.
Conceptualization of the support vector machine (SVM). The purpose of the SVM is to identify a hyperplane that precisely divides the data points. A hyperplane is a decision boundary that segregates data into classes. The data points close to the hyperplane are support vectors, and these affect the position of the hyperplane.
Fig. 4.
Flow diagram for the classification algorithm of knee osteoarthritis patients. SVM, support vector machine.
Fig. 5.
Flow diagram of feature selection for improving the SVM classification of knee osteoarthritis severity. SVM, support vector machine; OA, osteoarthritis.
Fig. 6.
The results of classification of knee osteoarthritis (OA) patients and normal subjects using an SVM classifier as a confusion matrix. The number of correct predictions is 75 and 93 for true positive and negative cases, respectively; and the number of incorrect predictions is 4 and 9 for false positive and negative cases, respectively. SVM, support vector machine.
Fig. 7.
The results of knee osteoarthritis severity classification using the SVM classifier as a confusion matrix. The number of correct predictions is colored green in 4×4 confusion matrix. SVM, support vector machine.
Fig. 8.
The accuracy of knee osteoarthritis severity classification according to the number of features selected by the ReliefF algorithm.
Fig. 9.
The difference in waveform data according to the severity of knee osteoarthritis in the sagittal plane of the knee joint from one representative subject in each group.
Table 1.
Characteristics of patients with knee osteoarthritis and control subjects
Control group (n=97)
Osteoarthritis group
Mild (n=28)
Moderate (n=31)
Severe (n=25)
Age (yr)
62.1±7.7
64.7±7.5
69.3±9.5
71.1±6.4
Height (cm)
158.3±12.2
157.5±7.0
159.3±7.2
159.5±9.4
Weight (kg)
59.40±9.37
61.10±10.30
62.20±10.90
60.50±9.50
BMI (kg/m2)
22.75±3.70
24.50±0.70
24.30±8.30
23.10±2.70
Values are presented as mean±standard deviation.
BMI, body mass index.
Table 2.
Kinematic gait parameters used to classify osteoarthritis patients
Feature ID
Feature name (left limb)
Feature ID
Feature name (right limb)
1
Hip flexion extension in IDS
37
Hip flexion extension in IDS
2
Hip flexion extension in SS
38
Hip flexion extension in SS
3
Hip flexion extension in TDS
39
Hip flexion extension in TDS
4
Hip flexion extension in SW
40
Hip flexion extension in SW
5
Hip adduction abduction in IDS
41
Hip adduction abduction in IDS
6
Hip adduction abduction in SS
42
Hip adduction abduction in SS
7
Hip adduction abduction in in TDS
43
Hip adduction abduction in in TDS
8
Hip adduction abduction in SW
44
Hip adduction abduction in SW
9
Hip internal external rotation in IDS
45
Hip internal external rotation in IDS
10
Hip internal external rotation in SS
46
Hip internal external rotation in SS
11
Hip internal external rotation in in TDS
47
Hip internal external rotation in in TDS
12
Hip internal external rotation in SW
48
Hip internal external rotation in SW
13
Knee flexion extension in IDS
49
Knee flexion extension in IDS
14
Knee flexion extension in SS
50
Knee flexion extension in SS
15
Knee flexion extension in TDS
51
Knee flexion extension in TDS
16
Knee flexion extension in SW
52
Knee flexion extension in SW
17
Knee varus valgus in IDS
53
Knee varus valgus in IDS
18
Knee varus valgus in SS
54
Knee varus valgus in SS
19
Knee varus valgus in in TDS
55
Knee varus valgus in in TDS
20
Knee varus valgus in SW
56
Knee varus valgus in SW
21
Knee internal external rotation in IDS
57
Knee internal external rotation in IDS
22
Knee internal external rotation in SS
58
Knee internal external rotation in SS
23
Knee internal external rotation in in TDS
59
Knee internal external rotation in in TDS
24
Knee internal external rotation in SW
60
Knee internal external rotation in SW
25
Ankle dorsiflexion plantarflexion in IDS
61
Ankle dorsiflexion plantarflexion in IDS
26
Ankle dorsiflexion plantarflexion in SS
62
Ankle dorsiflexion plantarflexion in SS
27
Ankle dorsiflexion plantarflexion in TDS
63
Ankle dorsiflexion plantarflexion in TDS
28
Ankle dorsiflexion plantarflexion in SW
64
Ankle dorsiflexion plantarflexion in SW
29
Ankle inversion eversion in IDS
65
Ankle inversion eversion in IDS
30
Ankle inversion eversion in SS
66
Ankle inversion eversion in SS
31
Ankle inversion eversion in in TDS
67
Ankle inversion eversion in in TDS
32
Ankle inversion eversion in SW
68
Ankle inversion eversion in SW
33
Ankle internal external rotation in IDS
69
Ankle internal external rotation in IDS
34
Ankle internal external rotation in SS
70
Ankle internal external rotation in SS
35
Ankle internal external rotation in in TDS
71
Ankle internal external rotation in in TDS
36
Ankle internal external rotation in SW
72
Ankle internal external rotation in SW
IDS, initial double support phase; SS, single support phase; TDS, terminal double support phase; SW, swing phase.
Table 3.
Accuracy results in classification of knee osteoarthritis and normal subjects using SVM
Classifier
Accuracy (%)
Specificity (%)
Sensitivity (%)
SVM
92.8
94.9
91.2
SVM, support vector machine.
Table 4.
Accuracy results in classification of severity of knee osteoarthritis using SVM and SVM with feature selection algorithm classifier
Classifier
Accuracy (%)
PPV (%)
Sensitivity (%)
SVM
81.2
79.7
70.4
SVM with feature selection algorithm
85.6
84.7
81.7
SVM, support vector machine; PPV, positive predictive value.
Table 5.
Logistic regression analysis with gait features and clinical factors
3. Wallace IJ, Worthington S, Felson DT, Jurmain RD, Wren KT, Maijanen H, et al. Knee osteoarthritis has doubled in prevalence since the mid-20th century. Proc Natl Acad Sci U S A 2017;114:9332-6.
4. Samuel AJ, Kanimozhi D. Outcome measures used in patient with knee osteoarthritis: with special importance on functional outcome measures. Int J Health Sci (Qassim) 2019;13:52-60.
5. Kohn MD, Sassoon AA, Fernando ND. Classifications in brief: Kellgren-Lawrence classification of osteoarthritis. Clin Orthop Relat Res 2016;474:1886-93.
6. Deluzio KJ, Astephen JL. Biomechanical features of gait waveform data associated with knee osteoarthritis: an application of principal component analysis. Gait Posture 2007;25:86-93.
7. Astephen JL, Deluzio KJ, Caldwell GE, Dunbar MJ. Biomechanical changes at the hip, knee, and ankle joints during gait are associated with knee osteoarthritis severity. J Orthop Res 2008;26:332-41.
8. Zeni JA Jr, Higginson JS. Differences in gait parameters between healthy subjects and persons with moderate and severe knee osteoarthritis: a result of altered walking speed? Clin Biomech (Bristol, Avon) 2009;24:372-8.
9. Favre J, Jolles BM. Gait analysis of patients with knee osteoarthritis highlights a pathological mechanical pathway and provides a basis for therapeutic interventions. EFORT Open Rev 2017;1:368-74.
10. Mundermann A, Dyrby CO, Andriacchi TP. Secondary gait changes in patients with medial compartment knee osteoarthritis: increased load at the ankle, knee, and hip during walking. Arthritis Rheum 2005;52:2835-44.
12. Al-Zahrani KS, Bakheit AM. A study of the gait characteristics of patients with chronic osteoarthritis of the knee. Disabil Rehabil 2002;24:275-80.
14. Astephen Wilson JL, Deluzio KJ, Dunbar MJ, Caldwell GE, Hubley-Kozey CL. The association between knee joint biomechanics and neuromuscular control and moderate knee osteoarthritis radiographic and pain severity. Osteoarthritis Cartilage 2011;19:186-93.
15. Elbaz A, Mor A, Segal G, Debi R, Shazar N, Herman A. Novel classification of knee osteoarthritis severity based on spatiotemporal gait analysis. Osteoarthritis Cartilage 2014;22:457-63.
16. Cho JS, Cho YS, Moon SB, Kim MJ, Lee HD, Lee SY, et al. Scoliosis screening through a machine learning based gait analysis test. Int J Precis Eng Manuf 2018;19:1861-72.
17. Shetty S, Rao YS. SVM based machine learning approach to identify Parkinson’s disease using gait analysis. In: Proceedings of 2016 International Conference on Inventive Computation Technologies (ICICT); 2016 Aug 26-27; Coimbatore, India.
18. Mezghani N, Husse S, Boivin K, Turcot K, Aissaoui R, Hagemeister N, et al. Automatic classification of asymptomatic and osteoarthritis knee gait patterns using kinematic data features and the nearest neighbor classifier. IEEE Trans Biomed Eng 2008;55:1230-2.
20. Aminian K, Najafi B, Bula C, Leyvraz PF, Robert P. Spatio-temporal parameters of gait measured by an ambulatory system using miniature gyroscopes. J Biomech 2002;35:689-99.
21. Cho YS, Jang SH, Cho JS, Kim MJ, Lee HD, Lee SY, et al. Evaluation of validity and reliability of inertial measurement unit-based gait analysis systems. Ann Rehabil Med 2018;42:872-83.
22. Allseits E, Lucarevic J, Gailey R, Agrawal V, Gaunaurd I, Bennett C. The development and concurrent validity of a real-time algorithm for temporal gait analysis using inertial measurement units. J Biomech 2017;55:27-33.
25. Spector TD, Cooper C. Radiographic assessment of osteoarthritis in population studies: whither Kellgren and Lawrence? Osteoarthritis Cartilage 1993;1:203-6.
26. Schiphof D, Boers M, Bierma-Zeinstra SM. Differences in descriptions of Kellgren and Lawrence grades of knee osteoarthritis. Ann Rheum Dis 2008;67:1034-6.
27. Baliunas AJ, Hurwitz DE, Ryals AB, Karrar A, Case JP, Block JA, et al. Increased knee joint loads during walking are present in subjects with knee osteoarthritis. Osteoarthritis Cartilage 2002;10:573-9.
30. Mills K, Hunt MA, Ferber R. Biomechanical deviations during level walking associated with knee osteoarthritis: a systematic review and meta-analysis. Arthritis Care Res (Hoboken) 2013;65:1643-65.
32. Chang A, Hayes K, Dunlop D, Song J, Hurwitz D, Cahue S, et al. Hip abduction moment and protection against medial tibiofemoral osteoarthritis progression. Arthritis Rheum 2005;52:3515-9.
33. Messier SP, Loeser RF, Hoover JL, Semble EL, Wise CM. Osteoarthritis of the knee: effects on gait, strength, and flexibility. Arch Phys Med Rehabil 1992;73:29-36.
34. McCarthy I, Hodgins D, Mor A, Elbaz A, Segal G. Analysis of knee flexion characteristics and how they alter with the onset of knee osteoarthritis: a case control study. BMC Musculoskelet Disord 2013;14:169.
35. Simon SR. Quantification of human motion: gait analysis-benefits and limitations to its application to clinical problems. J Biomech 2004;37:1869-80.
37. Beange KH, Chan AD, Graham RB. Evaluation of wearable IMU performance for orientation estimation and motion tracking. In: Proceedings of 2018 IEEE International Symposium on Medical Measurements and Applications (MeMeA); 2018 Jun 11-13; Rome, Italy.
39. Chan K, Lee TW, Sample PA, Goldbaum MH, Weinreb RN, Sejnowski TJ. Comparison of machine learning and traditional classifiers in glaucoma diagnosis. IEEE Trans Biomed Eng 2002;49:963-74.
40. Marriott KA, Birmingham TB, Leitch KM, Pinto R, Giffin JR. Strong independent associations between gait biomechanics and pain in patients with knee osteoarthritis. J Biomech 2019;94:123-9.
Knee osteoarthritis screening using multimodal gait signals transformed via Gramian angular field and integrated by a deep learning model Kai Sun, Zhenfu Huang, Minghui Hang, Wang Lu, Junjun Zhu Medical Engineering & Physics.2026; 147(1): 015002. CrossRef
Comparing prediction accuracy for 30-day readmission following primary total knee arthroplasty: the ACS-NSQIP risk calculator versus a novel artificial neural network model Anirudh Buddhiraju, Michelle Riyo Shimizu, Tony Lin-Wei Chen, Henry Hojoon Seo, Blake M. Bacevich, Pengwei Xiao, Young-Min Kwon Knee Surgery & Related Research.2025;[Epub] CrossRef
A Review of Neuro-ML Breakthroughs in Addressing Neurological Disorders Cosmina-Mihaela Rosca, Adrian Stancu Applied Sciences.2025; 15(10): 5442. CrossRef
Scoping Review of Machine Learning Techniques in Marker-Based Clinical Gait Analysis Kevin N. Dibbern, Maddalena G. Krzak, Alejandro Olivas, Mark V. Albert, Joseph J. Krzak, Karen M. Kruger Bioengineering.2025; 12(6): 591. CrossRef
Predicting Knee Cartilage Degradation and Osteoarthritis Onset Using a Hybrid Mathematical Modeling and Machine Learning Framework F. Mekrane, R. Ouladsine, A. Barkaoui, R. Ghandour IEEE Access.2025; 13: 107844. CrossRef
AI-Based Severity Classification of Dementia Using Gait Analysis Gangmin Moon, Jaesung Cho, Hojin Choi, Yunjin Kim, Gun-Do Kim, Seong-Ho Jang Sensors.2025; 25(19): 6083. CrossRef
Machine learning vs. traditional logistic regression: predictive performance and risk factor identification for child nutritional outcome in Pakistan Muhammad Shahid, Muhammad Ali Yahya, Jiayi Song, Hafiz Muhammad Naveed, Serhat Yuksel, Hasan Dincer, Muhammad Ali BMC Public Health.2025;[Epub] CrossRef
Augmented Gait Classification: Integrating YOLO, CNN–SNN Hybridization, and GAN Synthesis for Knee Osteoarthritis and Parkinson’s Disease Houmem Slimi, Ala Balti, Mounir Sayadi, Mohamed Moncef Ben Khelifa Signals.2025; 6(4): 64. CrossRef
Functional data analysis of ground reaction forces combined with clinical measures for early knee osteoarthritis detection Elisa Aragón-Basanta, Alvaro Page, Guillermo Ayala, Enrique Viosca-Herrero, Ana Alabajos-Cea, Luz Herrero-Manley Scientific Reports.2025;[Epub] CrossRef
CERAD-NAB and flexible battery based neuropsychological differentiation of Alzheimer’s dementia and depression using machine learning approaches Clara Dominke, Alina Maria Fischer, Timo Grimmer, Janine Diehl-Schmid, Thomas Jahn Aging, Neuropsychology, and Cognition.2024; 31(2): 221. CrossRef
Detection of knee osteoarthritis based on recurrence quantification analysis, fuzzy entropy and shallow classifiers Wei Zeng, Limin Ma, Yu Zhang Multimedia Tools and Applications.2024; 83(4): 11977. CrossRef
DETECTION OF KNEE OSTEOARTHRITIS BASED ON CENTER OF PRESSURE DATA AND THE BAT ALGORITHM MAHRAD POURYOSEF MIANDOAB, MOHAMMED N. ASHTIANI, ROOZBEH ABEDINI-NASSAB, SEYED MOHAMMAD REZA AKRAMI Journal of Mechanics in Medicine and Biology.2024;[Epub] CrossRef
Inertial measurement unit sensor-based gait analysis in adults and older adults: A cross-sectional study Dong Hyun Yoon, Jeong-Hyun Kim, Kyuwon Lee, Jae-Sung Cho, Seong-Ho Jang, Shi-Uk Lee Gait & Posture.2024; 107: 212. CrossRef
Classification of inertial sensor‐based gait patterns of orthopaedic conditions using machine learning: A pilot study Constanze Dammeyer, Corina Nüesch, Rosa M. S. Visscher, Yong K. Kim, Petros Ismailidis, Matthias Wittauer, Karl Stoffel, Yves Acklin, Christian Egloff, Cordula Netzer, Annegret Mündermann Journal of Orthopaedic Research.2024; 42(7): 1463. CrossRef
Gait classification of knee osteoarthritis patients using shoe-embedded internal measurement units sensor Ahmed Raza, Yusuke Sekiguchi, Haruki Yaguchi, Keita Honda, Kenichiro Fukushi, Chenhui Huang, Kazuki Ihara, Yoshitaka Nozaki, Kentaro Nakahara, Shin-Ichi Izumi, Satoru Ebihara Clinical Biomechanics.2024; 117: 106285. CrossRef
Explainable Deep-Learning-Based Gait Analysis of Hip–Knee Cyclogram for the Prediction of Adolescent Idiopathic Scoliosis Progression Yong-Gyun Kim, Sungjoon Kim, Jae Hyeon Park, Seung Yang, Minkyu Jang, Yeo Joon Yun, Jae-sung Cho, Sungmin You, Seong-Ho Jang Sensors.2024; 24(14): 4504. CrossRef
Smartphone IMU Sensors for Human Identification through Hip Joint Angle Analysis Rabé Andersson, Javier Bermejo-García, Rafael Agujetas, Mikael Cronhjort, José Chilo Sensors.2024; 24(15): 4769. CrossRef
Integrative approach to pedobarography and pelvis-trunk motion for knee osteoarthritis detection and exploration of non-radiographic rehabilitation monitoring Arnab Sarmah, Lipika Boruah, Satoshi Ito, Subramani Kanagaraj Frontiers in Bioengineering and Biotechnology.2024;[Epub] CrossRef
Markerless vision-based knee osteoarthritis classification using machine learning and gait videos Slim Ben Hassine, Ala Balti, Sabeur Abid, Mohamed Moncef Ben Khelifa, Mounir Sayadi Frontiers in Signal Processing.2024;[Epub] CrossRef
Machine learning-based detection of cervical spondylotic myelopathy using multiple gait parameters Xinyu Ji, Wei Zeng, Qihang Dai, Yuyan Zhang, Shaoyi Du, Bing Ji Biomimetic Intelligence and Robotics.2023; 3(2): 100103. CrossRef
Assessment of blood flow around the knee joint in patients with knee osteoarthritis by color Doppler ultrasound Jianan Wu, Ying Li, Xiao Zhang, Jing Liu, Zhihui Qian, Peng Ren, Ruixia Xu, Lei Ren, Luquan Ren European Journal of Radiology.2023; 166: 111005. CrossRef
Analysis and classification of gait patterns in osteoarthritic and asymptomatic knees using phase space reconstruction, intrinsic time-scale decomposition and neural networks Wei Zeng, Limin Ma, Yu Zhang Multimedia Tools and Applications.2023; 83(7): 21107. CrossRef
Precision oncology: Artificial intelligence, circulating cell‐free DNA, and the minimally invasive detection of pancreatic cancer—A pilot study Ray O. Bahado‐Singh, Onur Turkoglu, Buket Aydas, Sangeetha Vishweswaraiah Cancer Medicine.2023; 12(19): 19644. CrossRef
Design and development of foot worn piezoresistive sensor for knee pain analysis with supervised machine learning algorithms based on gait pattern M. Arumugaraja, B. Padmapriya, S. Poornachandra Measurement.2022; 200: 111603. CrossRef
Analysis of Gait Characteristics Using Hip-Knee Cyclograms in Patients with Hemiplegic Stroke Ho Seok Lee, Hokyoung Ryu, Shi-Uk Lee, Jae-sung Cho, Sungmin You, Jae Hyeon Park, Seong-Ho Jang Sensors.2021; 21(22): 7685. CrossRef
Novel Method of Classification in Knee Osteoarthritis: Machine Learning Application Versus Logistic Regression Model
Fig. 1. A hardware of the gait analysis system consisting of PC and wireless IMU sensors (A), and gait trial of knee osteoarthritis patient (B) and normal subject (C). IMU, inertial measurement unit.
Fig. 2. The gait waveform data of one representative normal subject’s lower limb was divided and expressed by each segmented gait phase.
Fig. 3. Conceptualization of the support vector machine (SVM). The purpose of the SVM is to identify a hyperplane that precisely divides the data points. A hyperplane is a decision boundary that segregates data into classes. The data points close to the hyperplane are support vectors, and these affect the position of the hyperplane.
Fig. 4. Flow diagram for the classification algorithm of knee osteoarthritis patients. SVM, support vector machine.
Fig. 5. Flow diagram of feature selection for improving the SVM classification of knee osteoarthritis severity. SVM, support vector machine; OA, osteoarthritis.
Fig. 6. The results of classification of knee osteoarthritis (OA) patients and normal subjects using an SVM classifier as a confusion matrix. The number of correct predictions is 75 and 93 for true positive and negative cases, respectively; and the number of incorrect predictions is 4 and 9 for false positive and negative cases, respectively. SVM, support vector machine.
Fig. 7. The results of knee osteoarthritis severity classification using the SVM classifier as a confusion matrix. The number of correct predictions is colored green in 4×4 confusion matrix. SVM, support vector machine.
Fig. 8. The accuracy of knee osteoarthritis severity classification according to the number of features selected by the ReliefF algorithm.
Fig. 9. The difference in waveform data according to the severity of knee osteoarthritis in the sagittal plane of the knee joint from one representative subject in each group.
Fig. 1.
Fig. 2.
Fig. 3.
Fig. 4.
Fig. 5.
Fig. 6.
Fig. 7.
Fig. 8.
Fig. 9.
Novel Method of Classification in Knee Osteoarthritis: Machine Learning Application Versus Logistic Regression Model
Control group (n=97)
Osteoarthritis group
Mild (n=28)
Moderate (n=31)
Severe (n=25)
Age (yr)
62.1±7.7
64.7±7.5
69.3±9.5
71.1±6.4
Height (cm)
158.3±12.2
157.5±7.0
159.3±7.2
159.5±9.4
Weight (kg)
59.40±9.37
61.10±10.30
62.20±10.90
60.50±9.50
BMI (kg/m2)
22.75±3.70
24.50±0.70
24.30±8.30
23.10±2.70
Feature ID
Feature name (left limb)
Feature ID
Feature name (right limb)
1
Hip flexion extension in IDS
37
Hip flexion extension in IDS
2
Hip flexion extension in SS
38
Hip flexion extension in SS
3
Hip flexion extension in TDS
39
Hip flexion extension in TDS
4
Hip flexion extension in SW
40
Hip flexion extension in SW
5
Hip adduction abduction in IDS
41
Hip adduction abduction in IDS
6
Hip adduction abduction in SS
42
Hip adduction abduction in SS
7
Hip adduction abduction in in TDS
43
Hip adduction abduction in in TDS
8
Hip adduction abduction in SW
44
Hip adduction abduction in SW
9
Hip internal external rotation in IDS
45
Hip internal external rotation in IDS
10
Hip internal external rotation in SS
46
Hip internal external rotation in SS
11
Hip internal external rotation in in TDS
47
Hip internal external rotation in in TDS
12
Hip internal external rotation in SW
48
Hip internal external rotation in SW
13
Knee flexion extension in IDS
49
Knee flexion extension in IDS
14
Knee flexion extension in SS
50
Knee flexion extension in SS
15
Knee flexion extension in TDS
51
Knee flexion extension in TDS
16
Knee flexion extension in SW
52
Knee flexion extension in SW
17
Knee varus valgus in IDS
53
Knee varus valgus in IDS
18
Knee varus valgus in SS
54
Knee varus valgus in SS
19
Knee varus valgus in in TDS
55
Knee varus valgus in in TDS
20
Knee varus valgus in SW
56
Knee varus valgus in SW
21
Knee internal external rotation in IDS
57
Knee internal external rotation in IDS
22
Knee internal external rotation in SS
58
Knee internal external rotation in SS
23
Knee internal external rotation in in TDS
59
Knee internal external rotation in in TDS
24
Knee internal external rotation in SW
60
Knee internal external rotation in SW
25
Ankle dorsiflexion plantarflexion in IDS
61
Ankle dorsiflexion plantarflexion in IDS
26
Ankle dorsiflexion plantarflexion in SS
62
Ankle dorsiflexion plantarflexion in SS
27
Ankle dorsiflexion plantarflexion in TDS
63
Ankle dorsiflexion plantarflexion in TDS
28
Ankle dorsiflexion plantarflexion in SW
64
Ankle dorsiflexion plantarflexion in SW
29
Ankle inversion eversion in IDS
65
Ankle inversion eversion in IDS
30
Ankle inversion eversion in SS
66
Ankle inversion eversion in SS
31
Ankle inversion eversion in in TDS
67
Ankle inversion eversion in in TDS
32
Ankle inversion eversion in SW
68
Ankle inversion eversion in SW
33
Ankle internal external rotation in IDS
69
Ankle internal external rotation in IDS
34
Ankle internal external rotation in SS
70
Ankle internal external rotation in SS
35
Ankle internal external rotation in in TDS
71
Ankle internal external rotation in in TDS
36
Ankle internal external rotation in SW
72
Ankle internal external rotation in SW
Classifier
Accuracy (%)
Specificity (%)
Sensitivity (%)
SVM
92.8
94.9
91.2
Classifier
Accuracy (%)
PPV (%)
Sensitivity (%)
SVM
81.2
79.7
70.4
SVM with feature selection algorithm
85.6
84.7
81.7
Regression coefficient
Standard error
p-value
OR
95% CI of OR
Lower
Upper
Maximum flexion angle
Right knee
0.101
0.032
0.002*
1.106
1.038
1.179
Left knee
0.104
0.034
0.002*
1.110
1.039
1.186
Cadence
0.073
0.029
0.010*
1.076
1.017
1.138
Constant
-17.911
3.626
0.000*
0.000
-
-
Table 1. Characteristics of patients with knee osteoarthritis and control subjects
Values are presented as mean±standard deviation.
BMI, body mass index.
Table 2. Kinematic gait parameters used to classify osteoarthritis patients
IDS, initial double support phase; SS, single support phase; TDS, terminal double support phase; SW, swing phase.
Table 3. Accuracy results in classification of knee osteoarthritis and normal subjects using SVM
SVM, support vector machine.
Table 4. Accuracy results in classification of severity of knee osteoarthritis using SVM and SVM with feature selection algorithm classifier
SVM, support vector machine; PPV, positive predictive value.
Table 5. Logistic regression analysis with gait features and clinical factors