Abstract
-
Objective
To compare the risk of depressive symptoms in adults with physical disabilities between rehabilitation-receivers and non-receivers.
-
Methods
A total of 3,568 adults with physical disabilities were retrieved from the 2014 Korean National Survey on People with Disabilities database. Four covariate adjustment methods (a multivariable regression model, inverse probability of treatment weighting [IPTW] adjusted for normalized weight, IPTW with stabilized weight, and greedy algorithm with 1:1 propensity score matching) were used to estimate the odds of having depressive symptoms. The dependent variable was depressive symptoms and the independent variable was the use of rehabilitation services. Baseline covariates were 19 demographic variables and 10 chronic condition variables.
-
Results
The four covariate adjustment methods revealed that adults with physical disabilities receiving rehabilitation services had a higher risk of depressive symptoms than those who did not receive these services (adjusted odds ratio, 1.191–1.294).
-
Conclusion
Our findings suggest that adults with physical disabilities receiving rehabilitation services have higher risk of developing depressive symptoms. Therefore, rehabilitation professionals need to pay attention to depressive symptoms and establish therapeutic strategies that can reduce such risk in rehabilitation settings.
-
Keywords: Rehabilitation, Depression, Disability study, Propensity score
INTRODUCTION
Physical disability defined as a condition in which an individual experiences deviation or loss in their body function or structure [
1] can result in difficulty, restriction, or dependence in performing basic and instrumental activities of daily living (ADLs and IADLs) [
2,
3]. In South Korea, with increasing number of people with physical disabilities [
4], the proportion of population with physical disabilities receiving rehabilitation services is also increasing. Therefore, developing a deeper understanding of people with physical disabilities is indispensable for rehabilitation professionals to provide more successful interventions for this population.
The International Classification of Functioning, Disability, and Health (ICF) based on a bio-psycho-social model recommends that rehabilitation professionals need to consider not only physical functions, but also psychological symptoms such as depressive symptoms or anxiety to better understand people with physical disabilities and deliver better interventions [
1]. To be specific, depressive symptoms can exacerbate individuals’ physical disability symptoms [
5] which may result in low health-related quality of life [
6] and higher healthcare expenditures [
7]. Considering adverse effects of depressive symptoms, rehabilitation professionals should monitor and track the risk of depressive symptoms and understand impacts of rehabilitation services on depressive symptoms to successfully manage health of people with physical disabilities.
Previous studies have acknowledged the importance of identifying the risk of depressive symptoms and reported a higher prevalence rate of depressive symptoms or depression in people with disabilities compared to the general population [
5,
8,
9]. These previous studies have revealed that disabilities can increase the risk of depressive symptoms itself. To investigate whether receiving rehabilitation services can affect the risk of depressive symptoms among adults with physical disabilities, it is imperative to compare the risk of depressive symptoms between rehabilitation receivers and non-receivers within the same patient group. However, to the best of our knowledge, no research has compared the risk of depressive symptoms between these two groups.
To accurately compare the risk of depressive symptoms, risk factors for depressive symptoms should be controlled to minimize effects of confounding factors. For instance, there are well-known risk factors for depressive symptoms or depression, including low income [
10], social support [
11], osteoarthritis [
12], low back pain [
13], age [
14], and sex [
15]. Among patients receiving rehabilitation, depressive symptoms are also associated with higher comorbidity and impairment, lower social support, lower self-efficacy, and specific work-related problems [
16]. Since previous studies have demonstrated various factors associated with depressive symptoms, it is important to effectively control for those factors related to depressive symptoms when investigating the risk of depressive symptoms.
The ICF model is an effective model for understanding and controlling for related risk factors of depressive symptoms. According to the ICF model, depressive symptoms are defined as impairments in an individual’s emotional function which belongs to the category of body function. Since impairments in body function can be affected by various factors such as health condition, personal and environmental factors, activities, and participation, related factors of depressive symptoms can be categorized according to the ICF model. Thus, information about relationships between depressive symptoms and its risk factors identified from the ICF model will be useful when estimating the risk of depressive symptoms by controlling for these risk factors.
Methodologically, propensity score (PS) matching methods are robust statistical methods effectively accounting for covariates. Although traditional regression adjustment methods are effective for controlling for confounders, these methods have limitations in addressing selection bias which is a typical limitation of observational studies [
17-
20]. In contrast, PS matching methods can mimic a randomized clinical trial by matching two comparison groups using conditional probability of receiving exposure given a set of covariates. For instance, various PS matching methods have been demonstrated to be robust after controlling for selection bias and confounders, such as inverse probability of treatment weighting adjustment (IPTW), IPTW with stabilized weight, and 1:1 matching [
18-
22].
Therefore, the objective of this study was to compare the risk of depressive symptoms between adults with physical disabilities who received rehabilitation services and those who did not receive these services by utilizing four different covariate adjustment methods.
MATERIALS AND METHODS
Study sample
We retrieved records of 104,703 adults with physical disabilities from the 2014 Korea National Survey on People with Disabilities (NSPD) database [
23]. The inclusion criteria for our study were: (1) the presence of physical impairments in the upper and/or lower extremities and/or spinal cord injury and (2) age older than 20 years. Physical impairments were defined as the state of being physically limited due to amputation, a medical disorder, or impairments of joints, extremities, or the spinal column. The study data set is de-identified and publicly available.
Definition of depressive symptoms and rehabilitation services
The presence of depressive symptoms was defined as a depressive mood or hopelessness that continued for 2 or more weeks and affected the participant’s daily activities during the past 12 months (September 2013 to August 2014). The survey participants were also asked if they had received rehabilitation services (treatment group vs. control group), including physical, occupational, speech, music, play, art, behavioral, and/or other therapies (e.g., exercise, horticultural therapy, therapeutic riding, and pottery psychotherapy). In other words, if participants received any of these rehabilitation services, we considered them to be receiving rehabilitation services.
Covariates based on the ICF model
Included covariates were categorized based on the ICF model.
Health condition
Health condition includes issues associated with chronic or acute illnesses [
1]. In this study, history of falls, self-rated health (1 ‘very poor’ to 5 ‘very good’), and chronic conditions present for 3 months or more were included as factors for health condition.
Body function
Body function was classified as physiological functions of body systems according to the ICF model [
1]. We selected physical function score as a factor for body function. It was estimated using an ADL instrument validated by an item response theory model [
24].
Activity
The ICF model defines activity as the execution of a task or action by an individual [
1]. Participation in physical activity (at least 3 days/week) was defined as a factor of activity.
Participation
Participation refers to involvement in life situations as noted in the ICF [
1]. Disability grades (1 ‘severe’ to 6 ‘mild’) assigned by the Korean government include assessment of participation levels. Thus, disability grade was categorized as a factor for participation.
Personal factors
Personal factors are defined as characteristics of an individual, including race, age, and health conditions [
1]. Thus, demographic variables such as age, years since primary impairment onset, sex, marital status (single or married/living with a partner), employment (currently working), low income (less than $1,388/month), education, smoking, and drinking were included as personal factors.
Environmental factors
The ICF model defines environmental factors as physical, social, and attitudinal environments in which people live and interact, including personal care providers and personal assistants, health professionals, and education and training services [
1]. Thus, in this study, outpatient visits (past 2 weeks including local hospitals, health centers, or dental clinics), preventative health services (education programs related to exercise, nutrition, smoking, and drinking in the past 12 months), mental health services (in the past 12 months), currently receiving depressive symptoms treatment, and social support (living with family member(s) or partner) were defined as environmental factors.
Statistical analysis
Descriptive analyses were conducted to describe demographic characteristics and covariates. To compare the two groups (rehabilitation receivers and non-receivers), chi-square test was used for categorical variables and Wilcoxon rank sum non-parametric test was used for continuous variables. Odds of depressive symptoms were estimated by using the four covariate adjustment methods (a traditional multivariable logistic regression and three PS matching methods) to examine the robustness of study results. The three PS matching methods were: (1) IPTW using propensity score with normalized weight, (2) IPTW with stabilized weight, and (3) greedy algorithms with 1:1 matching of the PS [
18,
21,
25].
First, we used a complete pooling approach in PS analyses [
26]. PS was estimated based on the likelihood of having depressive symptoms from a logistic regression model that accounted for participant’s characteristics (
Table 1). Normalized weights for the IPTW matching method were applied to avoid extreme values of weight by dividing each individual propensity score by the mean of all propensity scores. This allows a comparison to samples representative of specific populations [
18]. Therefore, normalized weight in the IPTW matching method does not result in a loss of observations.
While the robustness of IPTW with normalized weight has been demonstrated in observational studies, the null hypothesis is frequently rejected due to inflated sample size [
22]. In other words, this method often produces large variance estimates that result in high type I error rates. Thus, we also used IPTW with stabilized weight method to account for high propensity scores in treatment and control groups and validated point estimation from normalized weight for the IPTW method.
The most common PS matching method is the 1:1 matching method [
18,
19]. In this study, we used a greedy 1:1 matching algorithm without replacement using a caliper of width equal to 0.10 of the standard deviation (SD) of the logit of complete pooling PS [
25]. Consequently, this method allows matched sets of survey participants between treatment and control groups to share similar PS values estimated using covariates listed in
Table 1.
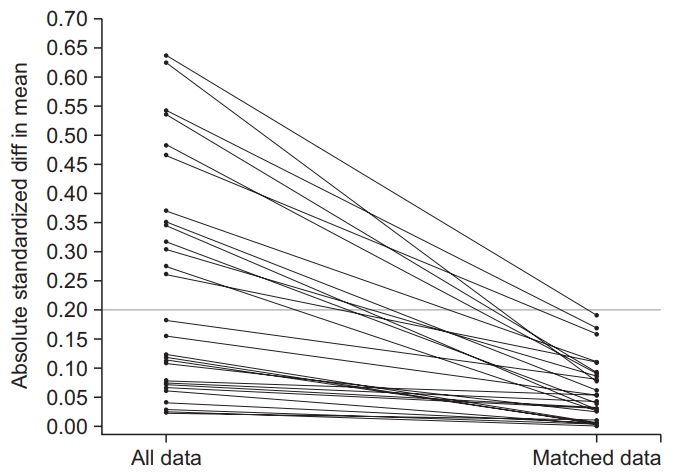
After performing the three PS matching methods, we re-calculated descriptive statistics between the two comparison groups to examine if covariates listed in
Table 1 were balanced. We also performed two PS diagnostic tests for the 1:1 matching method, including absolute standardized differences in means of all covariates [
19,
27] and percentage bias reduction of covariates [
26]. We considered an absolute standardized difference of less than 0.2 in means of all covariates as indicative of a good match between the two groups [
27]. If there were unbalanced covariates from the three PS matching methods, we additionally controlled for these covariates using logistic regression models. Lastly, we conducted sensitivity analysis to examine the magnitude of hidden bias in the risk of depression symptoms caused by unobserved covariates [
18,
28,
29]. Sensitivity analysis result was reported with a value of gamma at two-sided α=0.05 level. All analyses were performed using SAS version 9.4 software (SAS Institute Inc., Cary, NC, USA). Statistical significance was determined at an alpha level of 0.05 in two-sided tests.
RESULTS
We analyzed records of a total of 3,568 adults with physical disabilities. The average age was 62.7 years (SD=13.6). Among retained study sample, 775 participants were identified as having depressive symptoms, including 312 (27.3%) in the treatment group and 463 (18.9%) in the control group. The majority (n=1,126, 99.8%) of patients in the treatment group received physical therapy. Baseline covariate differences between treatment and control groups before matching are presented in
Table 1. Before matching, 23 out of 29 covariates were significantly different between the treatment group (n=1,126, 31.5%) and the control group (n=2,442, 68.5%).
PS ranged from 0.049 to 0.841 in the treatment group and from 0.031 to 0.834 in the control group (
Appendix 1). Baseline covariate differences between the two groups after performing the three matching methods are shown in
Table 2. After applying the IPTW with normalized weight and stabilized weight methods, all baseline covariates were balanced between the two comparison groups (all p>0.05).
After applying the 1:1 PS matching method, seven covariates were significantly different between treatment and control groups, including age, marital status, low income, current smoker, social support, osteoarthritis, and back pain (all p<0.05). However, these variables satisfied the criterion of minimum reduction in absolute standardized differences (
Fig. 1).
Total percentage bias reduction of covariates by the 1:1 PS matching method was 75.8%. We controlled for these seven significantly different variables when estimating odds of depressive symptoms.
Table 3 shows risks of depressive symptoms in adults with disabilities who have received rehabilitation services after applying covariate adjustment and the PS method plus further covariate adjustments.
Unadjusted risk of depressive symptoms was 63.9% (odds ratio=1.639; 95% confidence interval [CI], 1.389–1.933). However, this risk decreased to 19.1%–29.4% according to the four covariate adjustment methods, including a traditional multivariable logistic regression (adjusted odds ratio [AOR]=1.233; 95% CI, 1.013–1.501), IPTW normalized with logistic regression adjustment (AOR=1.191, 95% CI, 1.014–1.400), IPTW stabilized weight with logistic regression adjustment (AOR=1.191; 95% CI, 1.002–1.417), and 1:1 PS matching method with logistic regression adjustment (AOR=1.294; 95% CI, 1.065–1.574). Sensitivity analysis for the matched sample resulted in a gamma value of 1.11 at two-sided α=0.05 level, indicating that unobserved covariates could change our study results.
DISCUSSION
In this study, we compared the risk of depressive symptoms in adults with physical disabilities who received rehabilitation services to those who did not receive such services by utilizing four different covariate adjustment methods (a traditional regression model and three different propensity score matching methods). Our study findings revealed that adults with physical disabilities receiving rehabilitation services had higher risk of developing depressive symptoms (AOR, 1.191–1.294). To the best of our knowledge, this is the first study to compare the risk of depressive symptoms between rehabilitation receivers and non-receivers among the same adult population with physical disabilities. For instance, a recent study in Germany has investigated the prevalence of depression in rehabilitation settings (i.e., neurological, orthopedic, cancer rehabilitation, and others) and reported a higher prevalence of depression in those who have received rehabilitation than healthy individuals [
16]. However, this previous study only compared people with disabilities to healthy individuals.
In a rehabilitation setting, patients encounter unavoidable physical and emotional challenges such as pain, setbacks, and frustration [
30]. In particular, if people experience permanent physical disabilities, they could be exposed to these types of personal challenges while receiving rehabilitation. For example, patients with physical disabilities are likely to experience challenges such as frustration and depression when their recovery does not progress as rapidly as they expect [
30]. These challenges might increase the risk and likelihood of depressive symptoms in rehabilitation receivers. Our findings suggest that rehabilitation receivers require special care for depressive symptoms.
The ICF model proposes that rehabilitation professionals should follow a multidisciplinary approach to determining the best options for patients [
1]. However, in South Korea, rehabilitation services are primarily designed to provide services targeting physical functions or functional performance, not psychological symptoms such as depressive symptoms. This current rehabilitation practice is partially due to the current reimbursement policy and the lack of attention to or care for depressive symptoms in rehabilitation settings. Nevertheless, rehabilitation professionals can indirectly provide therapeutic interventions such as recreational activities to ameliorate clients’ depressive symptoms. Therefore, the current reimbursement policy needs to be revised for practitioners to administer systematic professional therapeutic strategies for people with psychological symptoms.
It is important to note that the identified risk of depressive symptoms in adults with physical disabilities who received rehabilitation services might stem from particular depressive symptoms covariates. After conducting the 1:1 PS matching method, the seven covariates (age, sex, low income, current smoker, social support, osteoarthritis, and back pain) showed significant differences between rehabilitation receivers and non-receivers within adults having physical disabilities (all p<0.05). All of these seven uncontrolled covariates are associated with depressive symptoms in adults with physical disabilities. Numerous studies examining risk factors for depressive symptoms support these findings [
10-
15]. While some of these risk factors are non-modifiable personal factors (age, sex, low income), other relevant variables are potentially modifiable factors, such as environmental factors (social support) and health condition (osteoarthritis and back pain). Therefore, rehabilitation professionals might need to address modifiable risk factors to reduce the risk of depressive symptoms in rehabilitation settings.
Of note, gamma level of 1.11 was relatively small. In other words, there are high probability that hidden bias can affect our results. Thus, a prospective study that controls for various depressive symptom covariates that are currently unavailable in this study is needed in the future to validate our current study findings.
In conclusion, Korean adults with physical disabilities who receive rehabilitation services show risk of developing depressive symptoms. Because depressive symptoms can cause a myriad of challenges for both the society and individuals, depressive symptoms in rehabilitation receivers should be carefully monitored to provide appropriate interventions.
CONFLICTS OF INTEREST
No potential conflict of interest relevant to this article was reported.
ACKNOWLEDGMENTS
This research was supported in part by grant (No. K12 HD055929) from the National Institutes of Health (NIH). Its contents are solely the responsibility of the authors. They do not necessarily represent official views of the NIH.
AUTHOR CONTRIBUTION
Conceptualization: all authors. Methodology: all authors. Formal analysis: Hong I. Funding acquisition: Hong I, Park HY. Project administration: Park HY. Visualization: Hong I, Lee MJ. Writing – original draft: Lee Y, Hong I. Writing – review and editing: all authors. Approval of final manuscript: all authors.
Fig. 1.Standardized difference of means of propensity score covariates (y-axis) before matching (all data, left on the x-axis) and after matching (matched data, right on the x-axis).
Table 1.Demographic characteristics of adults with physical disabilities who received rehabilitation services and those who did not receive rehabilitation services
Variable |
ICF category |
Rehabilitation (n=1,126) |
No rehabilitation (n=2,442) |
p-value |
Agea) (yr) |
PF |
67.5±11.2 |
60.4±14.0 |
<0.001*
|
Years since primary impairment onseta)
|
PF |
15.9±14.0 |
21.4±16.8 |
<0.001*
|
Maleb)
|
PF |
409 (36.3) |
1,529 (62.6) |
<0.001*
|
Marriedb)
|
PF |
648 (57.5) |
1,619 (66.3) |
<0.001*
|
Current employmentb)
|
PF |
385 (34.1) |
1,216 (49.8) |
<0.001*
|
Low incomeb)
|
PF |
692 (61.4) |
1,055 (43.2) |
<0.001*
|
Educationb)
|
PF |
|
|
<0.001*
|
Less than elementary school |
|
685 (60.8) |
987 (40.0) |
|
Middle school |
|
185 (16.4) |
387 (15.8) |
|
High school |
|
172 (15.2) |
674 (27.6) |
|
College beyond |
|
84 (7.4) |
394 (16.1) |
|
Current smokerb)
|
PF |
144 (12.8) |
614 (25.1) |
<0.001*
|
Current drinkerb)
|
PF |
771 (68.4) |
1,252 (51.2) |
<0.001*
|
Physical function scoresa)
|
BF |
49.6±7.3 |
50.1±7.2 |
0.007*
|
Physical activityb) (3 days/wk) |
A |
539 (47.8) |
1,096 (44.8) |
0.096 |
Disability gradesb)
|
P |
|
|
<0.001*
|
1 |
|
22 (1.9) |
64 (2.6) |
|
2 |
|
48 (4.2) |
145 (5.9) |
|
3 |
|
120 (10.6) |
321 (13.1) |
|
4 |
|
240 (21.3) |
481 (19.7) |
|
5 |
|
375 (33.3) |
660 (27.0) |
|
6 |
|
278 (24.6) |
715 (29.2) |
|
NA |
|
43 (3.8) |
56 (2.2) |
|
Social supportb)
|
EF |
816 (72.4) |
2,025 (82.9) |
<0.001*
|
Outpatient visit (past 2 wk)b)
|
EF |
858 (76.2) |
1,131 (46.3) |
<0.001*
|
Preventative health services (past 12 mo)b)
|
EF |
47 (4.1) |
66 (2.8) |
0.034*
|
Mental health services (past 12 mo)b)
|
EF |
30 (2.6) |
41 (1.7) |
0.074 |
Current depression treatmentb)
|
EF |
61 (5.4) |
79 (3.2) |
0.002*
|
History of fallsb)
|
HC |
48 (4.2) |
86 (3.5) |
0.279 |
Self-rated healthb)
|
HC |
|
|
<0.001*
|
Very poor |
|
216 (19.1) |
275 (11.2) |
|
Poor |
|
607 (53.9) |
953 (39.0) |
|
Fair |
|
246 (21.8) |
824 (33.7) |
|
Good |
|
53 (4.7) |
362 (14.8) |
|
Very good |
|
4 (0.3) |
28 (1.1) |
|
Chronic conditionsb)
|
HC |
|
|
|
Hypertension |
|
581 (61.6) |
931 (38.1) |
<0.001*
|
Dyslipidemia |
|
136 (12.0) |
210 (8.6) |
0.001*
|
Stroke |
|
47 (4.1) |
89 (3.6) |
0.443 |
Heart problem |
|
113 (10.0) |
147 (6.0) |
<0.001*
|
Osteoarthritis |
|
578 (51.3) |
557 (22.8) |
<0.001*
|
Rheumatoid arthritis |
|
62 (5.5) |
77 (3.1) |
<0.001*
|
Back pain |
|
357 (31.7) |
334 (13.6) |
<0.001*
|
Lung problem |
|
51 (4.5) |
100 (4.1) |
0.549 |
Diabetes |
|
238 (21.1) |
414 (16.9) |
0.003*
|
Cancer |
|
42 (3.7) |
81 (3.3) |
0.530 |
Table 2.Demographic characteristics after matching
Variable |
ICF category |
IPTW normalized weight
|
IPTW stabilized weight
|
1:1 Greedy PS matching
|
Rehabilitation (n=1,122) |
No rehabilitation (n=2,285) |
p-value |
Rehabilitation (n=1,122) |
No rehabilitation (n=2,285) |
p-value |
Rehabilitation (n=1,122) |
No rehabilitation (n=1,122) |
p-value |
Weighted (n=1,684) |
Weighted (n=1,722) |
Weighted (n=1,056) |
Weighted (n=2,342) |
Agea) (yr) |
PF |
64.1±15.7 |
63.4±11.8 |
0.108 |
64.1±12.4 |
63.4±13.7 |
0.141 |
67.5±11.2 |
66.5±12.0 |
0.016*
|
Years since primary impairment onseta)
|
PF |
18.9±20.9 |
19.1±13.6 |
0.696 |
18.9±16.5 |
19.1±15.8 |
0.713 |
15.9±14.0 |
16.3±13.4 |
0.124 |
Maleb)
|
PF |
872 (51.7) |
903 (52.4) |
0.693 |
547 (51.7) |
1,229 (52.4) |
0.715 |
408 (36.3) |
500 (44.5) |
<0.001*
|
Marriedb)
|
PF |
1,074 (63.7) |
1,095 (63.6) |
0.928 |
673 (63.7) |
1,490 (63.6) |
0.933 |
645 (57.4) |
589 (61.4) |
0.059 |
Current employmentb)
|
PF |
688 (40.8) |
736 (42.7) |
0.259 |
431 (40.8) |
1,001 (42.7) |
0.297 |
384 (34.2) |
404 (36.0) |
0.376 |
Low incomeb)
|
PF |
819 (48.6) |
855 (49.6) |
0.553 |
513 (48.6) |
1,163 (49.6) |
0.584 |
689 (61.4) |
629 (56.0) |
0.010*
|
Educationb)
|
PF |
|
|
0.944 |
|
|
0.956 |
|
|
0.086 |
Less than elementary school |
|
814 (48.3) |
829 (48.1) |
|
510 (48.3) |
1128 (48.1) |
|
684 (60.9) |
624 (55.6) |
|
Middle school |
|
273 (16.2) |
282 (16.4) |
|
171 (16.2) |
384 (16.4) |
|
183 (16.3) |
207 (18.4) |
|
High school |
|
392 (23.3) |
391 (22.7) |
|
532 (22.7) |
246 (23.3) |
|
172 (15.3) |
196 (17.4) |
|
College beyond |
|
204 (12.1) |
218 (12.7) |
|
297 (12.7) |
128 (12.1) |
|
83 (7.4) |
95 (8.4) |
|
Current smokerb)
|
PF |
337 (20.0) |
345 (20.0) |
0.981 |
211 (20.0) |
470 (20.0) |
0.983 |
144 (12.8) |
177 (15.7) |
0.047*
|
Current drinkerb)
|
PF |
1,005 (59.6) |
1,007 (58.4) |
0.477 |
426 (40.3) |
972 (41.5) |
0.511 |
768 (68.4) |
736 (65.6) |
0.151 |
Physical function scoresa)
|
BF |
49.4±9.4 |
49.8±6.5 |
0.173 |
49.4±7.4 |
49.8±7.6 |
0.205 |
49.6±7.3 |
49.3±7.8 |
0.532 |
Physical activityb) (3 days/wk) |
A |
817 (48.5) |
813 (47.2) |
0.454 |
512 (48.5) |
1,106 (47.2) |
0.489 |
539 (48.0) |
540 (48.1) |
0.966 |
Disability gradesb)
|
P |
|
|
0.965 |
|
|
0.975 |
|
|
0.934 |
1 |
|
49 (2.9) |
42 (2.4) |
|
30 (2.9) |
57 (2.4) |
|
22 (1.9) |
30 (2.6) |
|
2 |
|
88 (5.2) |
92 (5.3) |
|
55 (5.2) |
126 (5.3) |
|
47 (4.1) |
49 (4.3) |
|
3 |
|
196 (11.6) |
208 (12.1) |
|
123 (11.6) |
283 (12.1) |
|
120 (10.7) |
129 (11.5) |
|
4 |
|
324 (19.2) |
331 (19.2) |
|
203 (19.2) |
451 (19.2) |
|
240 (21.3) |
218 (19.4) |
|
5 |
|
525 (31.2) |
520 (30.2) |
|
329 (31.2) |
707 (30.2) |
|
374 (33.3) |
380 (33.8) |
|
6 |
|
448 (26.5) |
476 (27.6) |
|
281 (26.6) |
648 (27.6) |
|
276 (24.6) |
280 (24.9) |
|
NA |
|
50 (2.9) |
49 (2.8) |
|
31 (2.9) |
67 (2.8) |
|
43 (3.8) |
36 (3.2) |
|
Social supportb)
|
EF |
1,356 (80.5) |
1,370 (79.5) |
0.484 |
850 (80.5) |
1,863 (79.5) |
0.519 |
813 (72.4) |
866 (77.1) |
0.010*
|
Outpatient visitb) (past 2 wk) |
EF |
999 (59.3) |
1,008 (58.5) |
0.655 |
626 (59.3) |
1,372 (58.5) |
0.680 |
855 (76.2) |
818 (72.9) |
0.073 |
Preventative health servicesb) (past 12 mo) |
EF |
55 (3.3) |
56 (3.3) |
0.996 |
34 (3.3) |
77 (3.3) |
0.996 |
47 (4.1) |
36 (3.2) |
0.219 |
Mental health servicesb) (past 12 mo) |
EF |
33 (2.0) |
36 (2.1) |
0.813 |
21 (2.0) |
49 (2.1) |
0.827 |
30 (2.6) |
25 (2.2) |
0.495 |
Current depression treatmentb)
|
EF |
75 (4.5) |
72 (4.2) |
0.700 |
47 (4.5) |
99 (4.2) |
0.721 |
59 (5.2) |
58 (5.1) |
0.924 |
History of fallsb)
|
HC |
64 (3.8) |
66 (3.8) |
0.961 |
40 (3.8) |
89 (3.8) |
0.964 |
47 (4.1) |
48 (4.2) |
0.917 |
Self-rated healthb)
|
HC |
|
|
0.766 |
|
|
0.714 |
|
|
0.186 |
Very poor |
|
244 (14.5) |
242 (14.1) |
|
153 (14.5) |
330 (14.1) |
|
216 (19.2) |
192 (17.1) |
|
Poor |
|
794 (47.1) |
780 (45.3) |
|
498 (47.1) |
1061 (45.3) |
|
604 (53.8) |
578 (51.2) |
|
Fair |
|
472 (28.6) |
509 (29.6) |
|
296 (28.0) |
693 (29.6) |
|
245 (21.8) |
289 (25.7) |
|
Good |
|
163 (9.6) |
174 (10.1) |
|
102 (9.6) |
237 (10.1) |
|
53 (4.7) |
60 (5.3) |
|
Very good |
|
9 (0.5) |
14 (0.8) |
|
6 (0.5) |
20 (0.8) |
|
4 (0.3) |
3 (0.2) |
|
Chronic conditionsb)
|
HC |
|
|
|
|
|
|
|
|
|
Hypertension |
|
757 (44.9) |
753 (43.7) |
0.457 |
475 (44.9) |
1,024 (43.7) |
0.491 |
579 (51.6) |
564 (50.2) |
0.527 |
Dyslipidemia |
|
170 (10.1) |
175 (10.2) |
0.932 |
106 (10.1) |
239 (10.2) |
0.937 |
135 (12.0) |
133 (11.8) |
0.896 |
Stroke |
|
62 (3.7) |
64 (3.7) |
0.977 |
39 (3.7) |
87 (3.7) |
0.979 |
47 (4.1) |
47 (4.1) |
1.000 |
Heart problem |
|
131 (7.7) |
130 (7.6) |
0.862 |
82 (7.7) |
178 (7.6) |
0.872 |
111 (9.8) |
94 (8.3) |
0.213 |
Osteoarthritis |
|
575 (34.1) |
574 (33.3) |
0.638 |
360 (34.1) |
781 (33.3) |
0.663 |
575 (51.2) |
469 (41.8) |
<0.001*
|
Rheumatoid arthritis |
|
78 (4.6) |
72 (4.2) |
0.552 |
49 (4.6) |
99 (4.2) |
0.579 |
61 (5.4) |
60 (5.3) |
0.926 |
Back pain |
|
367 (21.8) |
354 (20.6) |
0.387 |
230 (21.8) |
482 (20.6) |
0.422 |
354 (31.5) |
275 (24.5) |
<0.001*
|
Lung problem |
|
80 (4.8) |
76 (4.4) |
0.609 |
50 (4.8) |
103 (4.4) |
0.634 |
51 (4.5) |
52 (4.6) |
0.920 |
Diabetes |
|
341 (20.2) |
330 (19.2) |
0.442 |
213 (20.2) |
449 (19.2) |
0.476 |
238 (21.2) |
249 (22.1) |
0.573 |
Cancer |
|
62 (3.7) |
60 (3.5) |
0.757 |
39 (3.7) |
82 (3.5) |
0.774 |
42 (3.7) |
44 (3.9) |
0.826 |
Table 3.Odds of depressive symptoms in adults with physical disabilities receiving rehabilitation services
Estimation method |
Depressive symptoms
|
AORa)
|
95% CI |
Unadjusted logistic regression |
1.639*
|
1.389–1.933 |
Adjusted multivariable logistic regression |
1.233*
|
1.013–1.501 |
Inverse probability of treatment weighting and normalized weight with logistic regression adjustment |
1.191*
|
1.014–1.400 |
Inverse probability of treatment weighting and stabilized weight with logistic regression adjustment |
1.191*
|
1.002–1.417 |
1:1 propensity score matching with logistic regression adjustment |
1.294*
|
1.065–1.574 |
REFERENCES
- 1. World Health Organization. International classification of functioning, disability and health: ICF. Geneva: World Health Organization; 2001.
- 2. Kang LJ, Hwang AW, Chen CL. Participation and environmental factors of children with physical disabilities in Taiwan. In: Tan U, editor. Physical disabilities: therapeutic Implications. Rijeka, Croatia: InTech; 2017. p. 43-56.
- 3. Lenze EJ, Rogers JC, Martire LM, Mulsant BH, Rollman BL, Dew MA, et al. The association of late-life depression and anxiety with physical disability: a review of the literature and prospectus for future research. Am J Geriatr Psychiatry 2001;9:113-35.
- 4. Kim WH, Park YG, Shin HI, Im SH. The World Report on Disability and recent developments in South Korea. Am J Phys Med Rehabil 2014;93(1 Suppl 1): S58-62.
- 5. Shen SC, Huang KH, Kung PT, Chiu LT, Tsai WC. Incidence, risk, and associated factors of depression in adults with physical and sensory disabilities: a nationwide population-based study. PLoS One 2017;12:e0175141.
- 6. Gallegos-Carrillo K, Garcia-Pena C, Mudgal J, Romero X, Duran-Arenas L, Salmeron J. Role of depressive symptoms and comorbid chronic disease on health-related quality of life among community-dwelling older adults. J Psychosom Res 2009;66:127-35.
- 7. Bock JO, Hajek A, Weyerer S, Werle J, Wagner M, Maier W, et al. The Impact of Depressive Symptoms on Healthcare Costs in Late Life: Longitudinal Findings From the AgeMooDe Study. Am J Geriatr Psychiatry 2017;25:131-41.
- 8. McDermott S, Moran R, Platt T, Issac T, Wood H, Dasari S. Depression in adults with disabilities, in primary care. Disabil Rehabil 2005;27:117-23.
- 9. Robinson-Whelen S, Taylor HB, Hughes RB, Wenzel L, Nosek MA. Depression and depression treatment in women with spinal cord injury. Top Spinal Cord Inj Rehabil 2014;20:23-31.
- 10. Brunger M, Spyra K. Prevalence of comorbid depressive symptoms in rehabilitation: a cross-indication, nationwide observational study. J Rehabil Med 2016;48:903-8.
- 11. Park JH, Kim KW, Kim MH, Kim MD, Kim BJ, Kim SK, et al. A nationwide survey on the prevalence and risk factors of late life depression in South Korea. J Affect Disord 2012;138:34-40.
- 12. Muller R, Peter C, Cieza A, Geyh S. The role of social support and social skills in people with spinal cord injury: a systematic review of the literature. Spinal Cord 2012;50:94-106.
- 13. Hawker GA, Gignac MA, Badley E, Davis AM, French MR, Li Y, et al. A longitudinal study to explain the pain-depression link in older adults with osteoarthritis. Arthritis Care Res (Hoboken) 2011;63:1382-90.
- 14. Hirsch O, Strauch K, Held H, Redaelli M, Chenot JF, Leonhardt C, et al. Low back pain patient subgroups in primary care: pain characteristics, psychosocial determinants, and health care utilization. Clin J Pain 2014;30:1023-32.
- 15. Wild B, Herzog W, Schellberg D, Lechner S, Niehoff D, Brenner H, et al. Association between the prevalence of depression and age in a large representative German sample of people aged 53 to 80 years. Int J Geriatr Psychiatry 2012;27:375-81.
- 16. Noh JW, Kwon YD, Park J, Oh IH, Kim J. Relationship between physical disability and depression by gender: a panel regression model. PLoS One 2016;11:e0166238.
- 17. Austin PC. An introduction to propensity score methods for reducing the effects of confounding in observational studies. Multivariate Behav Res 2011;46:399-424.
- 18. Rosenbaum PR, Rubin DB. The central role of the propensity score in observational studies for causal effects. Biometrika 1983;70:41-55.
- 19. Rosenbaum PR, Rubin DB. Reducing bias in observational studies using subclassification on the propensity score. J Am Stat Assoc 1984;79:516-24.
- 20. Rosenbaum PR, Rubin DB. Constructing a control group using multivariate matched sampling methods that incorporate the propensity score. Am Stat 1985;39:33-8.
- 21. Austin PC, Mamdani MM. A comparison of propensity score methods: a case-study estimating the effectiveness of post-AMI statin use. Stat Med 2006;25:2084-106.
- 22. Xu S, Ross C, Raebel MA, Shetterly S, Blanchette C, Smith D. Use of stabilized inverse propensity scores as weights to directly estimate relative risk and its confidence intervals. Value Health 2010;13:273-7.
- 23. Kim S, Lee Y, Hwang J, Oh M, Lee MK, Lee NH, et al. 2014 National Survey on people with disabilities. Sejong, Korea: Korean Institute for Health and Social Affairs; 2014.
- 24. Hong I, Lee MJ, Kim MY, Park HY. Item-level psychometrics of the ADL instrument of the Korean National Survey on persons with physical disabilities. Qual Life Res 2017;26:2867-75.
- 25. Coca-Perraillon M. Local and global optimal propensity score matching. In: Proceedings of the SAS Global Forum 2007; 2007;Apr 16-19 Orlando, FL. 1-9.
- 26. d’Agostino RB. Propensity score methods for bias reduction in the comparison of a treatment to a non-randomized control group. Stat Med 1998;17:2265-81.
- 27. Stuart EA. Matching methods for causal inference: a review and a look forward. Stat Sci 2010;25:1-21.
- 28. Rosenbaum PR. Observational studies. 2nd ed. New York: Springer; 2002.
- 29. Rosenbaum PR, Rubin DB. Assessing sensitivity to an unobserved binary covariate in an observational study with binary outcome. J R Stat Soc Series B Stat Methodol 1983;45:212-8.
- 30. Taylor J, Taylor S. Psychological approaches to sports injury rehabilitation. Gaithersburg, MD: Aspen Publishers; 1997.
Appendix
Figure & Data
Citations
Citations to this article as recorded by

- Chronic health conditions and disability are prevalent among community users of a digital mental health service: a scoping survey
Christine T. Shiner, Ian Li, Michael Millard, Alison E.J. Mahoney
Disability and Rehabilitation: Assistive Technology.2025; 20(3): 562. CrossRef - Relationships of Psychosocial Factors to Diabetes Self-efficacy
Seongkum Heo, JungHee Kang, Tammy Barbé, JinShil Kim, Rhonda H. Slocumb, Brandy Haley, Nina Wright
Journal of Cardiovascular Nursing.2025; 40(2): 133. CrossRef - Factors associated with the use of rehabilitation services among people with disabilities in Chile: A population-based study
Dania Silvia Paredes-Laguna, William Romeo Calderón-Curiñaupa, Sandra Liz Soto-Nuñez, Adriana Berenice Espinoza-Hoempler, J. Jhonnel Alarco
F1000Research.2025; 12: 73. CrossRef - Relationships of multidimensional factors to self-management in patients with diabetes: A Cross-sectional, correlational study
Seongkum Heo, JungHee Kang, Tammy Barbé, JinShil Kim, Tara F. Bertulfo, Pattie Troyan, Daphnee Stewart, Erica Umeakunne
Geriatric Nursing.2024; 55: 270. CrossRef - Factors Associated With Self-management in Adults With Type 1 or Type 2 Diabetes
Seongkum Heo, Tammy Barbé, JinShil Kim
Journal of Cardiovascular Nursing.2024;[Epub] CrossRef - Factors associated with the use of rehabilitation services among people with disabilities in Chile: A population-based study
Dania Silvia Paredes-Laguna, William Romeo Calderón-Curiñaupa, Sandra Liz Soto-Nuñez, Adriana Berenice Espinoza-Hoempler, J. Jhonnel Alarco
F1000Research.2023; 12: 73. CrossRef - Effects of short birth interval on different forms of child mortality in Bangladesh: Application of propensity score matching technique with inverse probability of treatment weighting
Mohammad Zahidul Islam, Md. Mostafizur Rahman, Md. Nuruzzaman Khan, Betregiorgis Hailu Zegeye
PLOS ONE.2023; 18(4): e0284776. CrossRef - The Role of Physical Activity and Depression on Quality of Life in Community-Dwelling Older Adults: Using Propensity Score Matching Approaches
Suyeong Bae, Monique R. Pappadis, Sanghun Nam, Ickpyo Hong
Journal of Aging and Physical Activity.2022; 30(5): 770. CrossRef - Perceived Physical and Mental Health and Healthy Eating Habits During the COVID-19 Pandemic in Korea
Yetsa A Tuakli-Wosornu, Uma Pandiyan, Catherine Stratton, Youngdeok Hwang, Abderrazak Hajjioui, Laura Paulina Muñoz-Velasco, Maryam Fourtassi, Rory Cooper, Joseph K Balikuddembe, Mark Peterson, Andrei Krassioukov, Angela Palomba, Deo Rishi Tripathi, Bo Yo
Journal of Korean Medical Science.2022;[Epub] CrossRef - Effects of short birth interval on neonatal, infant and under-five child mortality in Ethiopia: a nationally representative observational study using inverse probability of treatment weighting
Desalegn Markos Shifti, Catherine Chojenta, Elizabeth Holliday, Deborah Loxton
BMJ Open.2021; 11(8): e047892. CrossRef