 About
About Articles
 Information
Correlation Between Articulatory Diadochokinetic Parameters and Dysphagia Parameters in Subacute Stroke Patients
-
Back Min Oh, MD
 , Hyun Seok, MD, Sang-Hyun Kim, MD, Seung Yeol Lee, MD, Su Jung Park, MD, Beom Jin Kim, MD, Hyun Jung Kim, MD
- Received February 9, 2023 Revised May 1, 2023 Accepted May 14, 2023
- Abstract
-
- Objective
- To determine correlations of alternation motor rate (AMR), sequential motor rate (SMR), and maximum phonation time (MPT) with the severity of dysphagia in subacute stroke patients.
- Methods
- This was a retrospective chart review study. Data of 171 subacute stroke patients were analyzed. Patient’s AMR, SMR, and MPT data were collected from their language evaluations. Video fluoroscopic swallowing study (VFSS) was done. Data of dysphagia scales including penetration-aspiration scale (PAS), American Speech-Language-Hearing Association National Outcomes Measurement System (ASHA-NOMS) scale, clinical dysphagia scale (CDS), and videofluoroscopic dysphagia scale (VDS) were obtained. AMR, SMR, and MPT were compared between a non-aspirator group and an aspirator group. Correlations of AMR, SMR, and MPT with dysphagia scales were analyzed.
- Results
- AMR ("ka"), SMR, and modified Rankin Scale were significant associated factors between non-aspirator group and aspirator group, while AMR ("pa"), AMR ("ta"), and MPT were not. AMR, SMR, and MPT showed significant correlations with PAS score, ASHA-NOMS scale, CDS, VDS oral, and VDS pharyngeal scores. The cut-off value for distinguishing non-aspirator group and aspiration group was 18.5 for AMR ("ka") (sensitivity of 74.4%, specificity of 70.8%) and 7.5 for SMR (sensitivity of 89.9%, specificity of 61.0%). AMR and SMR were significantly lower in before-swallow aspiration group.
- Conclusion
- Articulatory diadochokinetic tasks that can be easily performed at the bedside would be particularly helpful in determining the oral feeding possibility of subacute stroke patients who cannot undergo VFSS, which is the gold standard for dysphagia assessment.
- GRAPHICAL ABSTRACT
- GRAPHICAL ABSTRACT
- INTRODUCTION
- INTRODUCTION
Dysarthria and dysphagia are common complications after stroke, which are highly related to each other. Many studies have found the co-existence of dysarthria and dysphagia among patients with neuromuscular diseases and ischemic stroke [1-3]. The rate of co-occurrence of dysarthria and dysphagia ranges from 28%–42% in stroke survivors [2-4]. Both speech articulation and swallowing process share some common neuroanatomical structures. For example, muscles of soft palate, larynx, and pharynx are innervated by efferent motor nerves of the vagus rising from the nucleus ambiggus [5]. The upper and lower lips, controlled by facial nerve and tongue, controlled by the hypoglossal nerve, are important oral structures and coordination of these structures are crucial for both speech articulation and swallowing process.Alternation motor rate (AMR) and sequential motor rate (SMR) are articulatory diadochokinetic parameters that can assess the severity of dysarthria by checking the regularity, rate, and the accuracy of articulators. AMR and SMR are used to evaluate the severity of dysarthria in stroke patients with high validity and reliability [6-8]. AMR includes rapid repetition of monosyllabic sounds such as ‘pa’, ‘ta’, and ‘ka’, while SMR includes repetition of a multisyllabic sound such as ‘pa-ta-ka’. Each sound production evaluates a different articulation point. ‘Pa’ is a bilabial sound produced by the movement of lips. ‘Ta’ sound is an alveolar sound produced by the movement of the tongue tip and alveolar ridge of mouth. ‘Ka’ is a velar sound produced by the movement of dorsum of tongue and soft palate [9]. To perform AMR and SMR correctly, patients need to be able to move their oral structures, such as lips, tongue tip, tong base, dorsum of tongue, and soft palate, in a finely coordinating manner and the integrity of their oral muscles should be intact. Any impairment in coordination or muscles strength of oral structures will result in reduced AMR and SMR [10].The oral phase of swallowing is a voluntary process that involves the complex movement of the oral structures to mix food with saliva to form a bolus that is propelled into the oropharynx to initiate the swallowing reflex. During the oral preparatory stage, the lips should be closed to prevent anterior leakage, and anterior part of the tongue should maintain contact with the hard palate to hold the bolus at the anterior part of mouth. The posterior part of the oral cavity is sealed by the contact of the dorsum of the tongue and the soft palate to prevent leakage into the pharynx before swallow [11]. During the oral propulsive stage, the anterior tip and sides of the tongue contract against the palate to progressively squeeze the entrapped bolus into the oropharynx. At the same time, the dorsum area of the tongue forms a passage that allows the bolus to enter the oropharynx. If the tongue is weak or paralyzed, the bolus may spill into the oral cavity or into the pharynx, which can lead to aspiration before swallowing [12]. Also, a previous study has shown that tongue base resection showed significant correlation with swallowing dysfunction who underwent oral cancer surgery [13].However, studies investigating the relationship between AMR, SMR, and the severity of dysphagia in subacute stroke patients have not been reported yet. We hypothesized that stroke patients with impaired AMR and SMR may experience oral stage swallowing difficulties and be at a higher risk for before-swallowing aspiration. We conducted a study to determine whether there is any correlation between AMR and SMR with certain parameters of oral stage dysphagia, and thus explore the relationships between the specific location of the tongue and oral stage swallowing problems.Moreover, phonation ability has a deep association with swallowing function [14]. The coordination of oral, laryngeal, pharyngeal muscles, and respiratory muscles in the upper airway is important in both phonation and swallowing processes. Maximum phonation time (MPT) is the longest period during which a patient can sustain phonation of a vowel sound. To perform MPT correctly, a patient needs to sustain a prolonged expiratory phase to make sufficient subglottal air pressure to induce the vocal cord vibration, which plays an important role in protecting the airway as well as producing sound by regulating the airflow. MPT can indirectly measure the efficiency of the laryngeal function and vocal cord vibration [15]. Since bronchial airflow is the most important determinant of MPT, we could assume that patients with shorter MPT may have lower subglottal airway pressure, which is one of the important factors for airway protection [16]. In a normal swallowing process, an increase in subglottic pressure occurs to release the air from the subglottic space into the pharynx for airway protection [17].We hypothesized that patients with shorter MPT may experience difficulty in expelling materials out from the airway, leading to impaired pharyngeal stage swallowing functions and an increased risk of during-swallowing aspiration. Thus, we conducted a study to determine whether there are any correlations between MPT and parameters of the pharyngeal stage swallowing functions, and to investigate the relationship between phonation ability and pharyngeal stage swallowing functions.
- METHODS
- METHODS
- Participants
- Participants
This was a retrospective study. Data were collected by reviewing charts of subacute stroke patients who were admitted to Soonchunhyang University Bucheon Hospital in Korea from January 2018 to December 2021. This study was approved by Institutional Review Board (IRB) of Soonchunhyang University Bucheon Hospital (IRB No. SCHBC 2022-07-007).Inclusion criteria were as follows: (1) patients with first ever stroke, including hemorrhagic stroke, and ischemic stroke; (2) those with subacute stage stroke less than six months of onset; (3) patients who had problems with articulation of speech and had completed a language assessment test; (4) patients who had symptoms of dysphagia and had undergone video fluoroscopic swallowing study (VFSS); and (5) the time difference between dysarthria evaluation and dysphagia evaluation was less than one week.Exclusion criteria were as follows: (1) patients who had a previous stroke history; (2) those who had other neurologic diseases such as brain tumor, hypoxic brain damage, or Parkinson’s disease; (3) patients who could not properly finish the language assessment test due to various reasons, such as severe cognitive deficit; and (4) patients with a tracheostomy tube.Mini-mental state examination (MMSE) and modified Rankin Scale (mRS) were collected for the cognitive function and degree of disability of patients, respectively. The stroke lesion location and size were confirmed by neuroimaging studies, including computed tomography or diffusion weighted imaging, at the time of admission. The lesion size was measured as the largest diameter visible on neuroimaging [18].Initially, data from 269 patients were collected. However, 19 patients with a previous stroke history, 11 patients with other neurologic diseases, 62 patients who could not accomplish speech evaluation test properly, and 6 patients who had a tracheostomy tube were excluded. Finally, data from 171 patients were analyzed.- Dysarthria assessment
- Dysarthria assessment
During the hospitalized period, all patients finished their language assessment test using the Korean version of Speech Mechanism Screening Test (SMST). The patient’s articulation was tested using AMR and SMR.To evaluate AMR ("pa"), patients were asked to breathe in air as much as possible and they were asked to make a ‘pa’ sound repeatedly as fast as possible for 5 seconds. The maximum number of ‘pa’ sound made by the patient was counted by a speech therapist. The same were done with a ‘ta’ sound for AMR ("ta") and a ‘ka’ sound for AMR ("ka"), respectively. The test was repeated three times and the mean value was calculated for each sound.To evaluate SMR, patients were asked to breathe in air as much as possible and they were asked to make a ‘pa-ta-ka’ sound repeatedly as fast as possible for 5 seconds. The maximum number of ‘pa-ta-ka’ sound that a patient made was counted by a speech therapist. The test was repeated three times and the mean value was calculated.To evaluate MPT, patients were asked to breathe in air as much as possible and they were asked to make an ‘ah’ sound as long as possible. The speech therapist measured the MPT with a stop watch. The test was repeated three times and the mean value was calculated. During AMR, SMR, and MPT evaluation, the tone and the height of the voice were phonated as comfortable as they could.- VFSS procedure and outcome measures
- VFSS procedure and outcome measures
Patients underwent VFSS to evaluate their swallowing ability. Foods for VFSS were yogurt (International Dysphagia Diet Standardization Initiative [IDDSI] level 4), rice porridge (IDDSI level 5), boiled rice (IDDSI level 7), and water (IDDSI level 0). Barium sulphate suspension was mixed with foods. The order of the food provided was a spoon of yogurt, followed by rice porridge, boiled rice, and 5 mL of water. The last step was cup drinking. It was done only if there was no aspiration during 5 mL of water. The procedure was stopped whenever foods were aspirated. The VFSS procedure was video-recorded. Recorded video was examined by two experienced doctors in the Department of Physical Medicine and Rehabilitation. Based on VFSS study results, we scored Penetration-Aspiration Scale (PAS), clinical dysphagia scale (CDS), videofluoroscopic dysphagia scale (VDS), and American Speech-Language-Hearing Association National Outcomes Measurement System (ASHA-NOMS) scale.PAS is an 8-point scale to describe penetration and aspiration event during swallowing. It is frequently used to evaluate the severity of dysphagia. Higher PAS scores indicate more severe dysphagia. PAS score 1 indicates normal swallowing function without penetration or aspiration. PAS scores 2 to 5 indicate penetration and PAS scores 6 to 8 indicate aspiration. PAS score for yogurt, rice porridge, boiled rice, 5mL of water, and cup drinking was scored respectively and the highest PAS value of in any diet tested was selected for the analysis.Also, the timing of aspiration was further divided into before-swallowing, during-swallowing, and after-swallowing aspiration. Aspiration before the swallow was defined as that occurring prior to the beginning of swallowing reflex. Aspiration during the swallow was defined as that occurring during the swallowing reflex. All subsequent aspirations were defined as aspiration after the swallow [19].CDS has 8 rating items with scores ranging from 0 to 100, with a higher score indicating a more severe dysphagia. CDS is commonly used to evaluate the swallowing function of stroke patients. It has been proven to have a good validity [20]. It evaluates aspiration, lip sealing, chewing and mastication, tongue protrusion, laryngeal elevation, and reflex coughing.VDS consists of 14 items with scores ranging from 0 to 100, with a higher score indicating a more severe dysphagia. It is composed of VDS oral phase scores and VDS pharyngeal phase scores. The items included in VDS oral phase are lip closure, bolus formation, mastication, apraxia, tongue to palate contact, premature bolus loss, and oral transit time. The items included in VDS pharyngeal phase score are triggering of pharyngeal swallow, vallecular residue, laryngeal elevation, pyriform sinus residue, coating on the pharyngeal wall, pharyngeal transit time, and aspiration. The scores for each item were analyzed. The scoring was done with the worst scores regardless of the type of food we used [21]. It is a quantitative assessment tool for dysphagia and has shown to correlate with VFSS findings with good validity. It can be applied to any dysphagic patients including stroke patients [22].ASHA-NOMS scale describes the swallowing ability of patients at seven different levels. It assesses how much supervision is required and determines how much diet restriction is needed for safe feeding. Level 1 indicates that an individual cannot swallow anything safely by mouth and that all nutrition and hydration should be received through enteral feeding. Level 7 indicates that an individual’s ability to eat independently is not limited by swallowing function and that swallowing would be safe and efficient for all consistencies [23].- Statistical analysis
- Statistical analysis
Collected data were analyzed with IBM SPSS Statistics 27.0 (IBM Corp., Armonk, NY, USA). Test for normality was done for all collected data by Shapiro–Wilk test. Quantitative data are presented as mean±standard deviation or median (interquartile range).Patients were categorized into two different groups according to their PAS scores. Patients with PAS 1 to 5 were categorized into a non-aspirator group and patients with PAS 6 to 8 were categorized into an aspirator group. To compare the variables between two groups, an independent two sample t-test or Mann–Whitney U-test was conducted as appropriate. Chi-squared test or the Fisher’s exact test was performed for categorical variables.To identify the independent risk factors of outcomes, a stepwise multivariable logistic regression analysis was performed that included all variables with a p-value<0.05 in the univariable analysis. Odd ratio and their 95% confidence interval (CI) were also calculated.Spearman’s partial correlation analysis was conducted to investigate the correlations of AMR, SMR, and MPT with dysphagia parameters. The correlation coefficient was adjusted by other possible effectors such as age, sex, MMSE, mRS, the size of the stroke lesion, the location of stroke lesion, the type of stroke, and the laterality of stroke lesion. The correlation was interpreted as very weak when between 0.00 to 0.19, weak when between 0.20 to 0.39, moderate when between 0.40 to 0.69, strong when between 0.70 to 0.89, and very strong when between 0.90 to 1.00 [24].The aspirator group was further divided into three different groups according to the timing of aspiration. Aspiration before-swallowing was assigned as group A, aspiration during-swallowing was assigned as group B, and aspiration after-swallowing was assigned as group C. The value of AMR ("pa"), AMR ("ta"), AMR ("ka"), SMR, and MPT were compared between the three groups by Kruskal–Wallis test. Post hoc analysis by Dunn’s procedure was done in the multiple comparison to correct type 1 error.Receiver operating characteristic (ROC) curve analysis was done to obtain optimal cut-off values for AMR ("ka") and SMR for distinguishing non-aspirator group and aspiration group by Youden index.
- RESULTS
- RESULTS
Data from a total number of 171 patients were collected. Basic characteristics, AMR, SMR, MPT, and dysphagia parameters of these patients are listed in Table 1. Dysphagia parameters such as ASHA-NOMS, CDS, VDS oral score, and VDS pharyngeal score were significantly different between non-aspirator group and aspirator group. Also, MMSE, mRS, location of the stroke lesion, AMR ("pa"), AMR ("ta"), AMR ("ka"), SMR, and MPT were significantly different between non-aspirator group and aspirator group, which led us to perform stepwise multivariable logistic regression analysis to find out the significant associated risk factors between the two groups.In Table 2, stepwise multivariable analysis showed that mRS, AMR ("ka"), and SMR were significant associated factors between the two groups. Other variables such as MMSE, location of the stroke lesion, AMR ("pa"), AMR ("ta"), and MPT were not significant associated risk factors.In Table 3, partial correlation was done to find out the correlation between AMR ("pa"), AMR ("ta"), AMR ("ka"), SMR, and MPT with the dysphagia parameters. AMR ("pa"), AMR ("ta"), AMR ("ka"), SMR, and MPT had significant correlation with PAS score, ASHA-NOMS scale, CDS score, PAS score for 5mL liquid and PAS score for cup drinking of water, and velopharyngeal reflux.AMR ("pa"), AMR ("ta"), AMR ("ka"), and SMR had moderate correlation with VDS oral score and weak correlation with VDS pharyngeal score. All 7 items included in VDS oral score showed significant correlations, while only 2 items included in VDS pharyngeal score showed significant correlation.MPT had weak correlation with VDS oral score and moderate correlation with VDS pharyngeal score. Only 3 items in VDS oral score had significant correlations, while 5 items in VDS pharyngeal score had significant correlation.In Table 4, AMR ("pa"), AMR ("ta"), AMR ("ka"), and SMR were significantly lower in the before-swallowing aspiration group compared to the other two groups. However, there was no significant difference in MPT between the three groups.In Fig. 1, cut-off values of AMR ("ka") and SMR for distinguishing non-aspirator group and aspiration group are shown. The cut-off value was 18.5 for AMR ("ka") with a sensitivity of 74.4% and a specificity of 70.8% on the ROC curve (area under curve [AUC]=0.796, 95%CI=0.730–0.862). The cut-off value was 7.5 for SMR with a sensitivity of 89.9% and a specificity of 61.0% on the ROC curve (AUC=0.836, 95% CI=0.776–0.896).
- DISCUSSION
- DISCUSSION
- Anterior lingual movements: correlation between AMR ("pa"), AMR ("ta") with oral and pharyngeal dysphagia parameters
- Anterior lingual movements: correlation between AMR ("pa"), AMR ("ta") with oral and pharyngeal dysphagia parameters
Table 3 showed that AMR ("pa") and AMR ("ta") had a moderate correlation with lip closure, bolus formation, mastication, tongue to palate contact, and oral transit time. Also, there were weak correlation with premature bolus loss and apraxia. These parameters are related to problems during the oral preparatory phase as well as the oral propulsive phase.AMR ("pa") and AMR ("ta") represents the anterior lingual movements. AMR ("pa") is a bilabial sound, representing the movement of the lips. AMR ("ta") is an alveolar sound, representing the anterior tip of tongue motility. Both lips and anterior tip of the tongue are important in oral preparatory phase when lips prevent anterior leakage and the anterior tip of tongue holds the bolus at the anterior part of the mouth against the hard palate. Anterior lingual movements are important when transition from oral preparatory phase in oral propulsive phase occurs. The oral propulsive phase is primarily driven by the tongue when the anterior tongue surface contacts the hard palate just behind the upper incisors, and the area of tongue to palate contact starts to expand backward to squeeze the bolus into the oropharynx [11]. Therefore, patients with impaired AMR ("pa") and AMR ("ta") may have difficulty in preventing anterior leakage, bolus formation, mastication, tongue to palate contact, delayed oral transit time, and premature bolus loss, which increases the risk of aspiration due to reduced anterior lingual motility.Also, AMR ("pa") and AMR ("ta") had a weak negative correlation with triggering of pharyngeal swallow and aspiration. There were no correlation with vallecular residue, laryngeal elevation, pyriform sinus residue, coating on the pharyngeal wall, and pharyngeal transit time. Therefore, we concluded that anterior lingual movements have a more correlation with oral stage dysphagia than pharyngeal stage dysphagia.However, the overall correlation coefficient showed only weak or moderate correlations. None of the dysphagia parameters had strong correlation. The correlation coefficient for PAS score and ASHA-NOMS scale showed weak correlations. AMR ("pa") and AMR ("ta") were not significant factors between the non-aspirator group and the aspirator group (Table 2). Therefore anterior lingual motility is thought to have relatively lesser impact on the swallowing process, especially for aspiration.- Posterior lingual movements: correlation between AMR ("ka"), SMR with oral and pharyngeal dysphagia parameters
- Posterior lingual movements: correlation between AMR ("ka"), SMR with oral and pharyngeal dysphagia parameters
Table 3 showed that AMR ("ka") and SMR had a moderate correlation with lip closure, bolus formation, mastication, tongue to palate contact, premature bolus loss, and oral transit time. Also, there was a weak correlation with apraxia. These parameters are related to problems during the oral preparatory phase as well as the oral propulsive phase.AMR ("ka") and SMR represent the posterior lingual motility. AMR ("ka") is a velar sound made by the dorsum of the tongue and soft palate. SMR also has ‘ka’ sound which requires the dorsum of the tongue and soft palate. During the oral preparatory stage, the oral cavity is sealed posteriorly with the dorsum of the tongue and soft palate to prevent the bolus from leaking into the oropharynx before swallowing. During the oral propulsive stage, the area of tongue to palate contact gradually expands backward, squeezing the bolus back along the palate into the oropharynx. The bolus aggregates on the pharyngeal surface of the tongue and in the valleculae to induce a swallowing reflex and start the pharyngeal phase of swallowing.Therefore, patients with impaired AMR ("ka") and SMR may have difficulties in bolus formation, mastication, tongue to palate contact, delayed oral transit time and be at a higher risk of premature bolus loss, which increases the risk of aspiration.Also, AMR ("ka") and SMR had a weak correlation with triggering of pharyngeal swallow and a moderate correlation with aspiration. There were no correlation with vallecular residue, laryngeal elevation, pyriform sinus residue, coating on the pharyngeal wall, and pharyngeal transit time.However, the overall correlation coefficient showed only weak or moderate correlations. None of the dysphagia parameters had a strong correlation. The correlations for the PAS score and the ASHA-NOMS scale were moderate, which were stronger compared with AMR ("pa") and AMR ("ta"). Also, AMR ("ka") and SMR were significant risk factor between the non-aspirator group and the aspirator group (Table 2). Therefore, posterior lingual motility is thought to be an important factor in the swallowing process.- Correlation between MPT with oral and pharyngeal dysphagia parameters
- Correlation between MPT with oral and pharyngeal dysphagia parameters
Table 3 showed that MPT had a weak correlation with lip closure, premature bolus loss and oral transit time. There were no correlations with bolus formation, mastication, apraxia, and tongue to palate contact. However, there were a moderate correlation with triggering of pharyngeal swallow, and a weak correlation with laryngeal elevation, coating on the pharyngeal wall, pharyngeal transit time, and aspiration. From there results, we could suggest that MPT is more related with pharyngeal stage dysphagia compared to oral stage dysphagia.A previous study found out that MPT is associated with triggering of pharyngeal swallowing and laryngeal elevation in Parkinson’s disease [25]. Another previous study showed that prolonged pharyngeal transit time is a significant predictor of aspiration pneumonia in the elderly [26]. This is consistent with our study results, showing that MPT had a negative correlation with triggering of pharyngeal swallow, delayed pharyngeal transit time, and laryngeal elevation, which are important airway protective mechanism during deglutition. Also, the airway is protected by swallowing apnea, a well-coordinated physiologic response where respiration stops during swallowing by laryngeal elevation and the action of the aryepiglottic folds. This apneic period tends to last about 0.5 to 1.5 seconds serving to prevent aspiration during inspiration by maintaining the higher subglottic pressure [27].MPT requires a patient to sustain a prolonged expiratory phase to make sufficient subglottal air pressure to induce the vocal cord vibration. MPT is strongly influenced by breathing capacity, expiratory pressure, and subglottic pressure [14]. MPT is known to indirectly measure the efficiency of the laryngeal function and vocal cord vibration [15]. This result is supported by a previous study that showed increase in MPT correlated with improvement in swallowing function in the oral and pharyngeal phase of patients with multiple system atrophy with dysphagia [28].We concluded that MPT has correlation with pharyngeal phase dysphagia more than oral stage dysphagia. Patients with shorter MPT may have reduced laryngeal elevation, lower subglottic air pressure, have delayed triggering of pharyngeal swallow reflex and delayed pharyngeal transit time, and therefore at an increased risk of aspiration. However the overall correlation coefficient was from weak to moderate and MPT was not a significant factor between the non-aspirator group and the aspirator group (Table 2).- Correlations with the presence of velopharyngeal reflux
- Correlations with the presence of velopharyngeal reflux
Table 3 showed that AMR ("pa"), AMR ("ta"), AMR ("ka"), SMR, and MPT had a significant weak correlation with the presence of velopharyngeal reflux. During the normal pharyngeal phase of swallowing, the soft palate is elevated by the contraction of levator veli palatine while the lateral and posterior pharyngeal walls contract medially and anteriorly to close the velopharyngeal port, separating the nasal cavity and oral cavity [11]. This process prevents the bolus from regurgitating into the nasal cavity. Velopharyngeal reflux can occur when the soft palate and pharyngeal walls are unable to form an effective seal.AMR and SMR utilize oral plosive sounds such as ‘pa’, ‘ta’, and ‘ka’. Oral plosive sounds are created when the air is stopped completely in the oral cavity and then suddenly explodes with its release. Air pressure needs to build up in the oral cavity up to 5–7 mmHg in order to produce there oral plosive sounds [29]. Therefore, in order to perform AMR and SMR correctly, not only lingual movements but also adequate elevation of the soft palate and contraction of the pharyngeal wall are required.Also, MPT utilizes prolonged phonation process. During phonation, the air passes through the vocal folds and travels through the pharyngeal cavity and then through the oral and nasal cavities, where changes in the space occur due to the various movements of the articulatory organs, resulting in the production of different types of sounds [9]. To make oral sounds, the pathway to the nose is usually blocked by the contraction of the levator veli palatine muscle that elevates the soft palate to attach to the back of the pharyngeal wall, blocking the path to the nasal cavity and allowing the airflow only to the oral cavity. On the other hand, when the soft palate is lowered, the airflow can pass through the nose, resulting in the production of nasal sounds. MPT utilizes the ‘a’ sound, which is produced without any obstruction in the middle part of the oral cavity, making it a vowel sound. To perform a longer MPT, a patient needs to be able to control their oropharyngeal structures in coordination.Therefore, we concluded that AMR, SMR, and MPT had significant correlations with the presence of velopharyngeal reflux.- Correlation between AMR, SMR, MPT, and PAS scores according to type of food
- Correlation between AMR, SMR, MPT, and PAS scores according to type of food
The partial correlation analysis showed that AMR ("pa"), AMR ("ta"), AMR ("ka"), SMR, and MPT had significant correlations between PAS scores of 5 mL of liquid and cup drinking. However, there were no significant correlations between the PAS scores of yogurt, rice porridge, and rice.Handling a liquid bolus requires very fast and elaborate movements of the oral structures as well as pharyngeal structures due to its slippery consistency. Liquid has the most vulnerable consistency that increases risk of aspiration. Thus, patients with impaired coordination of oral structures can be more susceptible in handling liquid materials, resulting in premature bolus loss and, therefore, a higher risk of aspiration. The study results were consistent with a previous study that showed increasing viscosity of foods would decrease the aspiration for stroke patients [30].- Correlation between AMR, SMR, MPT, and type of aspiration
- Correlation between AMR, SMR, MPT, and type of aspiration
In Table 4, AMR ("pa"), AMR ("ta"), AMR ("ka"), and SMR were significantly lower in group A. Aspiration before the swallow is commonly caused by either the premature entry of liquids into the pharynx due to impaired containment in the oral cavity or by delayed onset of laryngeal closure after a bolus is propelled into the pharynx [11]. A previous study suggested that premature bolus loss is a sign of reduced tongue strength and motility in stroke survivors [31]. Unfortunately, our study did not assess the strength of the tongue. However, tongue motility is reflected by AMR ("pa"), AMR ("ta"), AMR ("ka"), and SMR. Therefore, we could suggest that patients with impaired AMR ("pa"), AMR ("ta"), AMR ("ka"), and SMR were more susceptible to before-swallowing aspiration due to impaired tongue motility, incomplete bolus loss and premature spillage.MPT were not significantly different between the three groups. Impairments of airway protection can result from reduced laryngeal elevation or inadequate vocal fold closure. These impairments can lead to aspiration, usually during the swallow. Since MPT indirectly reflects laryngeal functions such as vocal cord vibration, bronchial airflow, subglottic air pressure, we expected that Group B would have a lower MPT compared to the other groups [16]. However, we could not find any difference between the tree groups. This may be partially due to some limitations of our study that did not measure intensity of vocalization, and there were no accurate criteria for the height of the voice or tone of the voice. Also, we did not assess vocal cord palsy. These limitations require further studies that encompass all these parameters and in more well-designed study.To our best knowledge, this is the first study to investigate the correlations of AMR and SMR with dysphagia in subacute stroke patients. There is a previous study that showed the correlation between AMR, SMR, and dysphagia in amyotrophic lateral sclerosis (ALS) patients [32]. The study showed that ALS patients who aspirated in 10 mL liquid bolus had lower AMR ("ka") compared to the ALS non-aspiration subjects. Also, SMR had a significant negative correlation with pharyngeal residue and aspiration. The authors suggest that alterations in speech production in ALS patients are due to decreased range, rate, and strength of the tongue, decreased oral pharyngeal musculature, decreased lingual coordination and impaired base of tongue movement, which increase the amount of pharyngeal residue and the risk of aspiration. The study suggested that AMR ("ka") and SMR are related to bolus propulsion through the pharynx in the swallowing process as well as posterior lingual movements during the articulation of speech. Our study showed similar results that posterior lingual movements, represented by AMR ("ka") and SMR, are important factors in dysphagia of subacute stroke patients. We further found out that the type of aspiration was mainly before-swallowing aspiration.AMR and SMR are simple to calculate, and they have minimal linguistic burden, which could allow patients with even severe dysarthria to complete the assessment [33]. AMR and SMR can also detect a subtle degree of dysarthria [34].This study has several limitations. First, for patients with severe aphasia or severe cognitive dysfunction, their articulation ability and phonation ability can be underestimated. Therefore, our study results lack reliability and validity for patients with severe aphasia or severe cognitive impairment, and caution is needed for clinical application of the study result.Second, we did not evaluate other oral structure related parameters such as maximal tongue protrusion length or maximal tongue base pressure and area that can be assessed by high resolution manometry, which are known to be related with dysphagia [35,36]. Also, we did not evaluate the strength of oral structures such as lips and tongue. Therefore, we could not find the relationship between tongue strength and swallowing functions. Previous studies used Iowa Oral Performance Instrument (IOPI Medical LLC, Woodinville, WA, USA) to measure tongue strength in a quantitative and objective manner. They found out that tongue strength is related with swallowing functions of the stroke survivors [37,38]. Another study found out that lingual strength training provides positive effects on lingual strength and articulator function, such as AMR and SMR, in stroke survivors [39]. We expect that our study results can be helpful in serving as a link to elucidate the relationship between tongue strength, AMR and SMR, and dysphagia of stroke survivors in more detail.Third, the onset time of stroke was less than six months. We did not enroll chronic stage stroke patients.Fourth, since this study was designed as a retrospective cross sectional chart review study, it was unable to find out the causal relationship or long-term relationship.Fifth, when evaluating PAS or VDS scores, we based the scores on the worst findings observed during the examination, regardless of the food consistency. It should be noted that the results may differ depending on the consistency of the food.Lastly, when performing MPT, there were no strict criteria for the tone of the voice, height of the voice and intensity of the voice, which may have led to errors. It would have been more solid if other voice evaluation indices such as richness, roughness, breathiness, pitch, and voice instability were taken into account. Also, we did not assess for the vocal cord palsy or coughing function, such as peak cough flow, of patients [40]. Therefore, subsequent studies with prospective and long-term observation with well-designed studies are required.Long-term follow-up studies on changes of AMR, SMR, and MPT during speech therapy or pulmonary rehabilitation exercise, in regard with the strength of the oral structures, could provide further information about relationships of AMR, SMR, and MPT with swallowing function in stroke patients.In conclusion, this study showed that AMR, SMR, and MPT had significant correlations with the severity of dysphagia. AMR ("ka"), SMR, and mRS were significant factors between the non-aspirator group and the aspirator group, while AMR ("pa"), AMR ("ta"), and MPT were not. Extra caution should be taken for dysphagia in patients with AMR less than 18.5 or SMR less than 7.5. Our study results suggest that articulatory diadochokinetic tasks that can be easily performed at the bedside would be particularly helpful in determining the oral feeding possibility of subacute stroke patients who cannot undergo VFSS, which is the gold standard for dysphagia assessment.
We went through chart review of 171 subacute stroke patients. Table 1 showed that MMSE, mRS, and brain lesion location were significantly different between the two groups. However, the mean value of MMSE was 22.67±5.49 in non-aspirator group and 20.79±5.38 for aspirator group. Both group had a mean MMSE higher than 20. All patients included in this study were able to accomplish VFSS procedure and speech language evaluation test without any problems. Also, stepwise multivariable logistic regression analysis showed that MMSE and brain lesion location were not significant factors between the two groups.In Table 2, mRS, AMR ("ka"), and SMR were the significant factors between non-aspirator group and aspirator group. AMR ("pa"), AMR ("ta"), and MPT were not significant factors between the two groups. Thus, we could suggest that AMR ("ka") and SMR, which represents posterior lingual movements, are the important risk factors between the two groups.The partial correlation analysis showed that AMR ("pa"), AMR ("ta"), AMR ("ka"), SMR, and MPT had negative correlation with the PAS score, positive correlation with the ASHA-NOMS scale, negative correlation with the CDS. We could suggest that patients with impaired AMR ("pa"), AMR ("ta"), AMR ("ka"), SMR, and MPT are more vulnerable to aspiration, require more diet modification and supervision during oral feeding, and have more severe oropharyngeal dysphagia. We would like to discuss additional results in more detail with VDS oral item scores and VDS pharyngeal item scores according to the different articulation points.
- Notes
- Notes
-
No potential conflict of interest relevant to this article was reported.
FUNDING INFORMATION None.
Conceptualization: Seok H, Kim SH, Lee SY, Kim HJ, Oh BM. Methodology: Kim SH, Kim HJ, Oh BM, Park SJ, Kim BJ. Formal analysis: Kim HJ, Oh BM. Project administration: Seok H, Kim SH, Lee SY, Kim HJ, Oh BM. Visualization: Kim HJ, Oh BM, Park SJ, Kim BJ. Writing – original draft: Kim HJ, Oh BM. Writing – review and editing: Seok H, Kim SH, Lee SY, Kim HJ, Oh BM, Park SJ, Kim BJ. Approval of final manuscript: all authors.
Fig. 1.
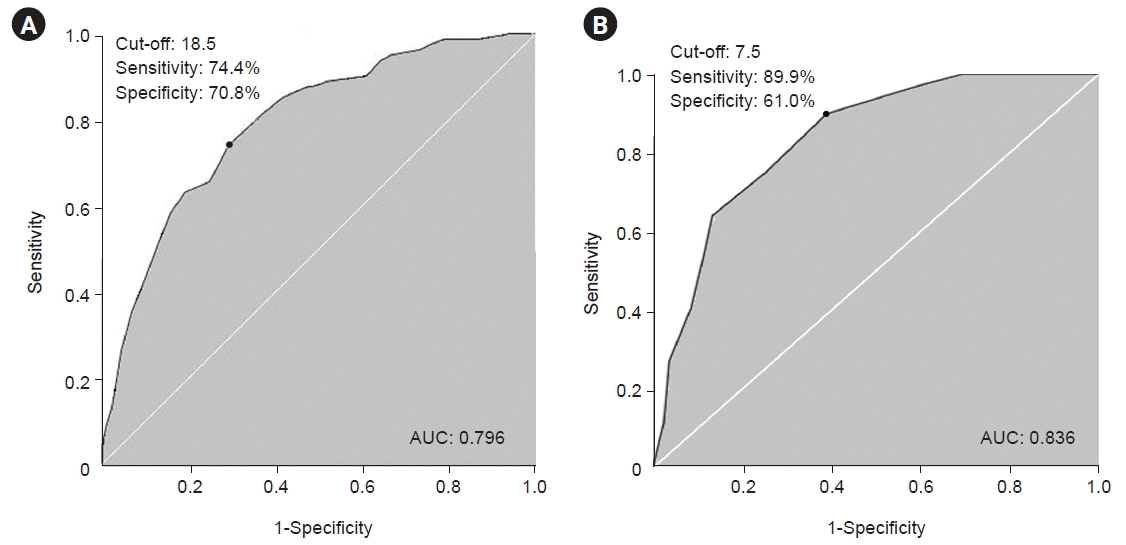
Table 1.
Values are presented as mean±standard deviation, number (%), or median (interquartile range).
AMR, alternation motor rate; SMR, sequential motor rate; MPT, maximum phonation time; VFSS, video fluoroscopic swallowing study; MMSE, mini-mental state examination; mRS, modified Rankin Scale; ASHA-NOMS, American Speech-Language-Hearing Association National Outcomes Measurement System; CDS, clinical dysphagia scale; VDS, videofluoroscopic dysphagia scale.
Table 2.
Table 3.
The correlation coefficient was adjusted by other possible effectors such as age, sex, MMSE, mRS, the size of the stroke lesion, the location of stroke lesion, the type of stroke, and the laterality of stroke lesion.
AMR, alternation motor rate; SMR, sequential motor rate; MPT, maximum phonation time; VDS, videofluoroscopic dysphagia scale; PAS, penetration-aspiration scale; ASHA-NOMS, American Speech-Language-Hearing Association National Outcomes Measurement System; CDS, clinical dysphagia scale.
Table 4.
- References
- References
REFERENCES
1. Knuijt S, Kalf JG, de Swart BJ, Drost G, Hendricks HT, Geurts AC, et al. Dysarthria and dysphagia are highly prevalent among various types of neuromuscular diseases. Disabil Rehabil 2014;36:1285-9.
[Article] [PubMed]2. Bahia MM, Mourão LF, Chun RY. Dysarthria as a predictor of dysphagia following stroke. NeuroRehabilitation 2016;38:155-62.
[Article] [PubMed]3. Flowers HL, Silver FL, Fang J, Rochon E, Martino R. The incidence, co-occurrence, and predictors of dysphagia, dysarthria, and aphasia after first-ever acute ischemic stroke. J Commun Disord 2013;46:238-48.
[Article] [PubMed]4. Falsetti P, Acciai C, Palilla R, Bosi M, Carpinteri F, Zingarelli A, et al. Oropharyngeal dysphagia after stroke: incidence, diagnosis, and clinical predictors in patients admitted to a neurorehabilitation unit. J Stroke Cerebrovasc Dis 2009;18:329-35.
[Article] [PubMed]5. Ludlow CL. Central nervous system control of voice and swallowing. J Clin Neurophysiol 2015;32:294-303.
[Article] [PubMed] [PMC]6. Kwon YG, Do KH, Park SJ, Chang MC, Chun MH. Effect of repetitive transcranial magnetic stimulation on patients with dysarthria after subacute stroke. Ann Rehabil Med 2015;39:793-9.
[Article] [PubMed] [PMC]7. Kim HJ, Lee KM. Development of the Korea Dysarthria Test following stroke. Ann Rehabil Med 2022;46:71-86.
[Article] [PubMed] [PMC]8. Shin MJ, Kim JO, Lee SB, Lee SY. Speech mechanism screening test (SMST). Seoul: Hakjisa; 2010.9. Kim SJ, Shin JY. Articulatory and phonological disorders. Seoul: Sigmapress; 2007.10. Fletcher SG. Time-by-count measurement of diadochokinetic syllable rate. J Speech Hear Res 1972;15:763-70.
[Article] [PubMed]11. Matsuo K, Palmer JB. Anatomy and physiology of feeding and swallowing: normal and abnormal. Phys Med Rehabil Clin N Am 2008;19:691-707. vii.
[Article] [PubMed] [PMC]12. Goyal R, Mashimo H. Physiology of oral, pharyngeal, and esophageal motility [Internet]. GI Motility Online; 2006 [cited 2022 Dec 1]. Available from: https://www.nature.com/gimo/contents/pt1/full/gimo1.html.13. Kodama N, Kumai Y, Miyamoto T, Matsubara K, Samejima Y, Orita Y. Factors affecting the swallowing dysfunction following oral cancer surgery. Ann Rehabil Med 2021;45:368-78.
[Article] [PubMed] [PMC]14. Yamaguchi S, Ishida M, Hidaka K, Gomi S, Takayama S, Sato K, et al. Relationship between swallowing function and breathing/phonation. Auris Nasus Larynx 2018;45:533-9.
[Article] [PubMed]15. Maslan J, Leng X, Rees C, Blalock D, Butler SG. Maximum phonation time in healthy older adults. J Voice 2011;25:709-13.
[Article] [PubMed] [PMC]16. Solomon NP, Garlitz SJ, Milbrath RL. Respiratory and laryngeal contributions to maximum phonation duration. J Voice 2000;14:331-40.
[Article] [PubMed]17. Eibling DE, Gross RD. Subglottic air pressure: a key component of swallowing efficiency. Ann Otol Rhinol Laryngol 1996;105:253-8.
[Article] [PubMed]18. Nakayama H, Jørgensen HS, Raaschou HO, Olsen TS. The influence of age on stroke outcome. The Copenhagen Stroke Study. Stroke 1994;25:808-13.
[Article] [PubMed]19. Tanaka T, Kagaya H, Ozeki Y, Fujii W, Iida T, Shibata S, et al. Revised classification of aspiration before, during, and after the swallow and its reliability. Jpn J Compr Rehabilit Sci 2016;7:51-4.
[Article]20. Jung SH, Lee KJ, Hong JB, Han TR. Validation of clinical dysphagia scale: based on videofluoroscopic swallowing study. J Korean Acad Rehabilit Med 2005;29:343-50.21. Chang MC, Kwak S. Videofluoroscopic swallowing study findings associated with subsequent pneumonia in patients with dysphagia due to frailty. Front Med (Lausanne) 2021;8:690968.
[Article] [PubMed] [PMC]22. Han TR, Paik NJ, Park JW, Kwon BS. The prediction of persistent dysphagia beyond six months after stroke. Dysphagia 2008;23:59-64.
[Article] [PubMed]23. American Speech-Language-Hearing Association. National Outcomes Measurement System (NOMS): adult speech-language pathology user’s guide. Rockville: American Speech-Language-Hearing Association; 2002.24. Cohen J. Statistical power analysis for the behavioral sciences. 2nd ed. New York: Lawrence Erlbaum Associates; 1988.25. Ko EJ, Chae M, Cho SR. Relationship between swallowing function and maximum phonation time in patients with Parkinsonism. Ann Rehabil Med 2018;42:425-32.
[Article] [PubMed] [PMC]26. Ko JY, Shin DY, Kim TU, Kim SY, Hyun JK, Lee SJ. Predictors of aspiration pneumonia in the elderly with swallowing dysfunction: videofluoroscopic swallowing study. Ann Rehabil Med 2021;45:99-107.
[Article] [PubMed] [PMC]27. Nishino T. The swallowing reflex and its significance as an airway defensive reflex. Front Physiol 2013;3:489.
[Article] [PubMed] [PMC]28. Park A, Jang SJ, Kim NE, Kim TH, Sohn YH, Kim H, et al. Swallowing outcomes following voice therapy in multiple system atrophy with dysphagia: comparison of treatment efficacy with Parkinson's disease. Dysphagia 2022;37:198-206.
[Article] [PubMed] [PMC]29. Ruda JM, Krakovitz P, Rose AS. A review of the evaluation and management of velopharyngeal insufficiency in children. Otolaryngol Clin North Am 2012;45:653-69. viii.
[Article] [PubMed]30. Clavé P, de Kraa M, Arreola V, Girvent M, Farré R, Palomera E, et al. The effect of bolus viscosity on swallowing function in neurogenic dysphagia. Aliment Pharmacol Ther 2006;24:1385-94.
[Article] [PubMed]31. Lee JH, Kim HS, Yun DH, Chon J, Han YJ, Yoo SD, et al. The relationship between tongue pressure and oral dysphagia in stroke patients. Ann Rehabil Med 2016;40:620-8.
[Article] [PubMed] [PMC]32. Knack AF. Evaluating the relationship between diadochokinesis and severity of dysphagia as it relates to forced vital capacity in individuals with amyotrophic lateral sclerosis [dissertation] Detroit, MI, Wayne State University. 2015.33. Wang YT, Kent RD, Duffy JR, Thomas JE. Dysarthria associated with traumatic brain injury: speaking rate and emphatic stress. J Commun Disord 2005;38:231-60.
[Article] [PubMed]34. Nishio M, Niimi S. Comparison of speaking rate, articulation rate and alternating motion rate in dysarthric speakers. Folia Phoniatr Logop 2006;58:114-31.
[Article] [PubMed]35. Cho H, Noh JS, Park J, Park C, Park ND, Ahn JY, et al. Decreased maximal tongue protrusion length may predict the presence of dysphagia in stroke patients. Ann Rehabil Med 2021;45:440-9.
[Article] [PubMed] [PMC]36. Lee SM, Lee BH, Kim JW, Jang JY, Jang EG, Ryu JS. Effects of chin-down maneuver on pharyngeal pressure generation according to dysphagia and viscosity. Ann Rehabil Med 2020;44:493-501.
[Article] [PubMed] [PMC]37. Kim HD, Choi JB, Yoo SJ, Chang MY, Lee SW, Park JS. Tongue-to-palate resistance training improves tongue strength and oropharyngeal swallowing function in subacute stroke survivors with dysphagia. J Oral Rehabil 2017;44:59-64.
[Article] [PubMed]38. Park HS, Oh DH, Yoon T, Park JS. Effect of effortful swallowing training on tongue strength and oropharyngeal swallowing function in stroke patients with dysphagia: a double-blind, randomized controlled trial. Int J Lang Commun Disord 2019;54:479-84.
[Article] [PubMed]