Decrement of Serum Vitamin D Level After Stroke
Article information

Abstract
Objective
To investigate the serum vitamin D level and its determinant factors in stroke patients.
Methods
Fifty-one stroke patients who had documented serum level of 25-hydroxyvitamin D(25(OH)D) were included. Patients were divided into subacute (n=23) and chronic groups (n=28). The mean levels of 25(OH)D of the two groups were compared. Correlations between each 25(OH)D level and post-stroke duration were also analyzed. To assess other possible influencing factors, patients were subdivided by ambulation ability and feeding methods for comparison of 25(OH)D level.
Results
The mean level of 25(OH)D was significantly lower in the chronic group than in the subacute group (12.3 vs. 16.3 ng/mL; p<0.05). The serum 25(OH)D level decreased according to the duration after stroke (r=−0.52, p=0.01). Patients with a history of total parenteral nutrition had lower 25(OH)D levels than subjects who had enteral nutrition in the subacute group (7.3 vs. 18.8 ng/mL; p<0.01). However, the levels of 25(OH)D were not different between the oral feeding and tube feeding groups. Among the chronic group subjects, patients who could walk without assistance had higher 25(OH)D levels than non-ambulatory patients (ambulatory vs. non-ambulatory group; 18.3 vs. 11.3 ng/mL; p<0.05).
Conclusion
After stroke onset, serum vitamin D level decreases with time regardless of feeding methods, and total parenteral nutrition may aggravate its deficiency. In terms of long-term care, non-ambulatory patients might be at a higher risk of vitamin D deficiency. Supplementation of vitamin D should be considered especially for stroke patients who are non-ambulatory and on total parenteral nutrition.
INTRODUCTION
In stroke patients, a significant correlation between serum vitamin D level and bone mineral density (BMD) was reported [12]. Several studies suggested that vitamin D deficiency after a stroke could increase not only the risk of fracture, but also cardiovascular disease and sarcopenia [34]. The integrity of the cardiovascular system and musculoskeletal structures are important for recovery after a stroke [56]. Patients with a low level of serum vitamin D at the onset of the stroke showed more severe disability [7]. Furthermore, stroke patients with enough vitamin D had more favorable outcomes, including improved muscle strength and bone density [238].
Although many studies have suggested the association of vitamin D with disease severity from a stroke, only a few have reported vitamin D deficiency after a stroke. In previous studies, chronic stroke patients presented a lower level of serum vitamin D than did healthy control people. However, possible factors reducing serum vitamin D level in stroke patients have not been assessed [79].
Since vitamin D is generated from exposure to sunlight and dietary supplements, stroke patients who have severe disabilities, including dysphagia, and are bed-ridden are likely to lack vitamin D [1011]. However, it is still unknown whether these factors after a stroke influence serum vitamin D level. Also, we thought assessment of serum vitamin D levels after a stroke may provide a clue to prevent vitamin D deficiency.
This study aimed to verify changes in serum vitamin D levels after stroke onset according to the lapse of time and whether this change effects on BMD. In addition, possible influencing factors in terms of physiologic vitamin D production and intake, such as ambulatory and dietary status, were assessed.
MATERIALS AND METHODS
Subjects
Stroke patients admitted to the rehabilitation department at CHA Bundang Medical Center from August 2014 to June 2015 were retrospectively identified. Diagnosis of stroke was validated by means of brain computed tomography or magnetic resonance imaging. Patients with first-ever stroke and documented serum vitamin D level after the stroke were included. Criteria for exclusion were concomitant fracture, renal disease, liver disease, steroid treatment, limitation in premorbid mobility, and supplementation of vitamin D or calcium.
Methods
Patients at 1 to 4 weeks after stroke onset were categorized as the subacute group, and those after 1 month were categorized as the chronic group [12]. The mean level of serum 25-hydroxyvitamin D(25(OH)D) in each group was compared. Serum vitamin D was measured as serum 25(OH)D concentration (ng/mL) by automated immunoassay methods (DiaSorin, IDS, Siemens), which was taken within 2 weeks of admission to the rehabilitation department [13]. Raw data of 2,669 subjects aged from 41 to 80 years (mean age, 58.2 years) in the Korean National Health and Nutrition Examination Survey IV 2008, were used as age- and gender-matched healthy controls. The mean levels of serum 25(OH)D in stroke patients and healthy controls were compared. Correlations between each 25(OH)D level and post-stroke duration were also analyzed.
Two possible factors that may affect 25(OH) level were also assessed. One was ambulation ability and the other was feeding method. For the ambulation ability, the subjects were divided into ambulatory and non-ambulatory groups based on modified Rankin Scale (mRS) score at the time of admission to rehabilitation [14]. Those who scored less than or equal to 3 on the mRS were categorized as ambulatory, those with scores of 4 or 5 as non-ambulatory. Feeding method was classified as total parenteral nutrition (TPN) or enteral nutrition, which was subdivided into oral feeding or tube feeding. If patients had any history of intravenous nutrition supplementation within 3 weeks of blood sampling, those were categorized as in the TPN group.
For BMD, patients were subdivided into normal, osteopenia, and osteoporosis groups. The BMD test was conducted at the time of admission. BMD of the lumbar spine and/or one side of hip was measured by dual energy X-ray absorptiometry (DXA) [15]. The mean level of serum 25(OH)D in each BMD group was compared to assess association between BMD and serum 25(OH)D level.
This study was approved by the Institutional Review Board of ethics of CHA Bundang Medical Center (IRB No. 2015-08-128).
Statistical analysis
Normal distribution was verified by the Kolmogorov-Smirnov test. Differences in baseline characteristics were analyzed by the chi-square test for categorical values and an independent t-test for continuous values. A simple linear regression model was used to investigate correlations between serum 25(OH)D levels and post-stroke duration. The difference in serum 25(OH)D levels between groups was analyzed by an independent t-test or a Mann-Whitney U-test. All statistical analyses were performed with SPSS for Windows ver. 21.0 (IBM, Armonk, NY, USA). Statistical significance was defined as p≤0.05.
RESULTS
Demographic characteristics
The baseline characteristics of patients are summarized in Table 1. Fifty-one patients were included (male/female, 33/18; mean age, 59.4 years; mean post-stroke duration, 121.4 days). Patients were divided into subacute and chronic groups (n=23 and n=28; mean age, 58.7 and 60.0 years; mean post-stroke duration, 18.9 and 205.6 days, respectively). Prevalence of underlying diseases, including hypertension, diabetes mellitus, coronary artery disease, and atrial fibrillation, was similar between groups. Nutritional conditions reflected in body mass index, total protein, albumin, and blood urea nitrogen were compared and showed no statistical differences between groups. Fifty-five patients in the subacute group had a history of TPN, whereas the chronic group had none.
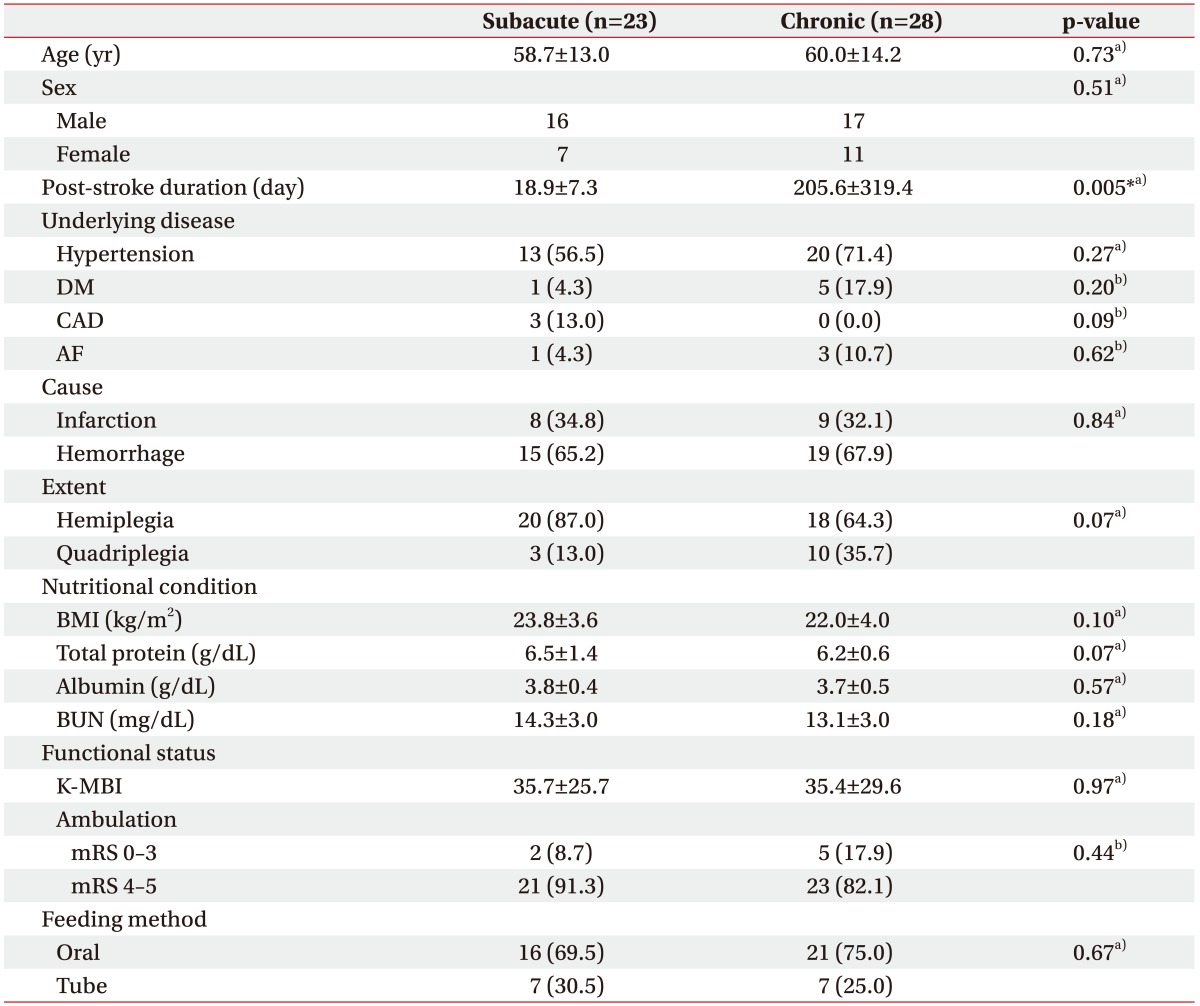
Baseline and clinical characteristics of stroke patients
Change of serum 25(OH)D level according to duration of illness
The mean level of serum 25(OH)D was lower in chronic group than subacute group (12.3 vs. 16.3 ng/mL; p=0.02) (Fig. 1). In addition, levels of 25(OH)D in subacute and chronic groups were significantly lower than age-matched healthy controls (mean level of 25(OH)D in healthy controls, 21.7 ng/mL; p<0.01). According to correlation analysis, the 25(OH)D level tended to decrease depending on post-stroke duration in subacute patients (r=−0.52, p=0.01). However, this negative correlation was not found in chronic patients (Fig. 2).
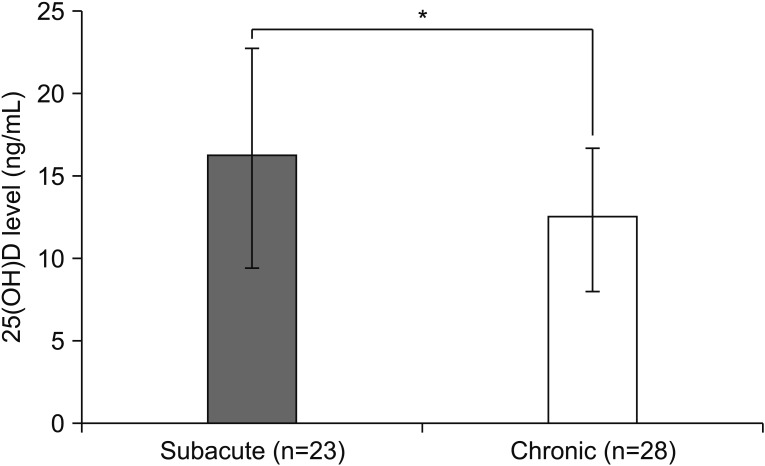
Comparison of serum 25(OH)D levels between subacute and chronic group. The mean level of serum 25(OH)D is 16.3 ng/mL in the subacute group, and 12.3 ng/mL in the chronic group. *p<0.05, statistically significant.
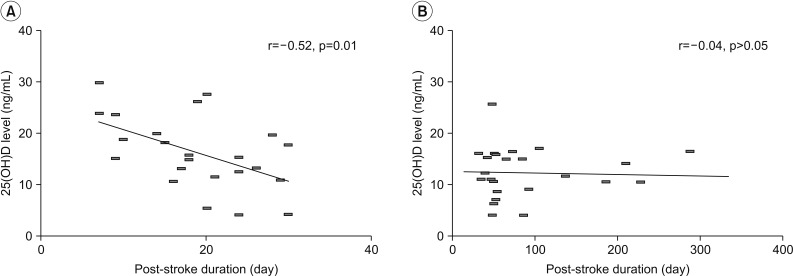
Decrease of serum 25(OH)D level according to post-stroke duration in subacute (A) and chronic (B) patients. Linear regression line and Pearson correlation coefficient (r) are noted.
Effect of feeding method or nutritional content and ambulation ability on 25(OH)D level
The serum 25(OH)D level in subacute patients differed significantly with nutritional supply method. The mean level of 25(OH)D was significantly lower in patients with TPN than in those with enteral nutrition (7.3 vs. 18.8 ng/mL; p<0.001) (Table 2). A similar result was observed with six patients in the enteral nutrition group who were matched in post-stroke duration and ambulation ability to the TPN group (TPN vs. enteral nutrition, 7.3 vs. 17.8 ng/mL; p<0.01). However, the 25(OH)D level was not statistically different between the oral and tube feeding groups in either the subacute or the chronic patients (Table 3).
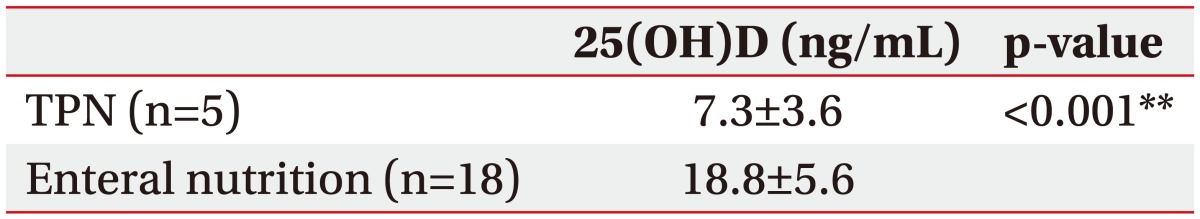
Comparison of serum 25(OH)D between TPN and enteral nutrition groups
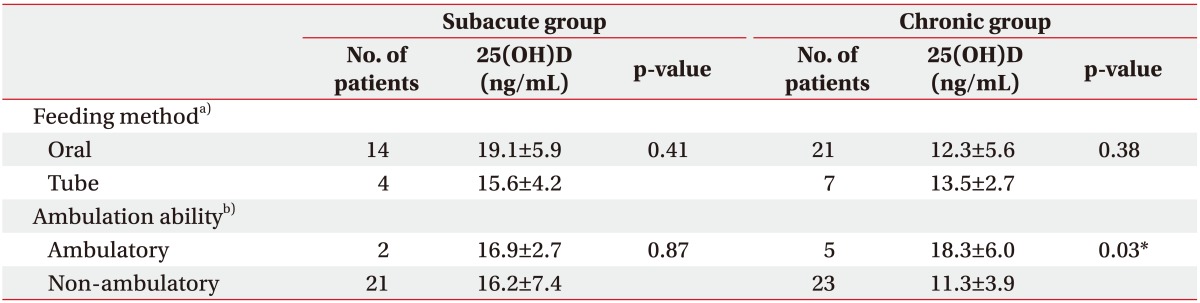
Difference of serum 25(OH)D level according to feeding method and ambulation ability in patients without TPN history
Differences in 25(OH)D level according to ambulation ability were observed in chronic patients. Those who were able to walk without assistance, defined as mRS less than equal to 3, showed higher 25(OH)D levels than those not capable of independent walking, defined as mRS 4 and 5 (18.3 vs. 11.3 ng/mL; p=0.03) (Table 3).
Differences of 25(OH)D level according to BMD status
Thirty-two patients had BMD tests at the time of admission. In the subacute group, the mean level of serum 25(OH)D in those with normal BMD results was higher than in those with pathologic BMD, but the difference was not statistically significant. On the contrary, all chronic patients had low 25(OH)D levels regardless of BMD results (Table 4).
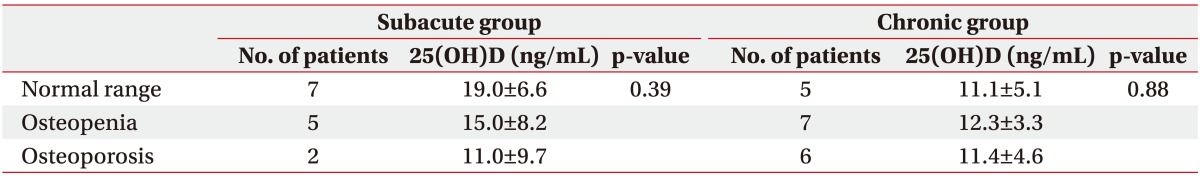
Comparison of serum 25(OH)D level according to BMD results
DISCUSSION
Decrement of serum vitamin D was observed early after stroke onset in this study. The mean level of 25(OH)D was lower in subacute and chronic patients than in healthy controls [1617]. The level of 25(OH)D was lower in patients with a longer duration of illness after stroke for 1 month. After 1 month, the level of 25(OH)D was not significantly different among the patients. Given the 3-week of half-life of vitamin D, these results indicate that there were exhaustion of vitamin D stored prior to stroke onset, insufficient synthesis after stroke, and continued lack of vitamin D after the period [18].
In this study, nutritional content and ambulation ability were verified as two determining factors that influenced serum vitamin D level. The mean level of serum 25(OH) D was significantly lower with the history of TPN rather than enteral nutrition, perhaps because the parenteral nutrition lacked vitamin D, which the enteral nutrition included. However, the possibility of other contributing factors cannot be excluded, because of the small sample size. For vitamin D supply, the results suggest that both enteral nutrition and TPN may not maintain adequate vitamin D levels, especially in chronic patients. Serum vitamin D levels did not seem to be affected by the enteral feeding route, i.e., oral or tube, since it was maintained at a similarly low level for both oral feeding and tube feeding groups. The patients on tube feeding were offered 300 to 500 IU of vitamin D per day in this study. Previous research suggested that 800 to 1000 IU per day of vitamin D3 supplementation is needed to prevent vitamin D deficiency for those subjected to inadequate sun exposure [1019]. Dieticians regular modify diets based on total calories, taking into account the contents of carbohydrate, protein and lipids. In planning nutrition, vitamin and mineral contents are not primary considerations [20]. The precise amount of vitamin D in each meal could not be calculated, but the results of this study indicate that regular diet is not sufficient to maintain or increase serum vitamin D in chronic stroke patients.
Correlations between immobility and decrease of serum vitamin D in stroke patients were also identified in this study. Patients capable of independent walking had higher levels of vitamin D than non-ambulatory patients in the chronic group. Furthermore, the mean level of 25(OH)D in ambulatory patients was close to that in healthy controls (18.3 vs. 21.7 ng/mL; p=0.32). On the contrary, patients in the non-ambulatory group had significantly lower 25(OH)D levels than healthy controls (11.3 vs. 21.7 ng/mL; p<0.001). It seems that restricted outdoor activity may have affected the synthesis of vitamin D after the stroke and resulted in a low 25(OH)D level. Because sunlight exposure is a main source for vitamin D, difficulty in ambulation may lead to a decrease in serum vitamin D level. Moreover, prolonged non-ambulatory status can exacerbate vitamin D insufficiency by inducing hypercalcemia, which inhibits secretion of parathyroid hormone [121]. Therefore, supplementation of vitamin D in non-ambulatory stroke patients should be considered.
In this study, vitamin D level and bone density did not show any correlation, which does not match previous reports of an association between a low vitamin D level and loss of BMD [2223]. The duration of vitamin D deficiency may influence BMD; however, this is still unknown. The mean post-stroke duration of less than a year in our study population may have been too short to change BMD status. Further evaluation of the change in BMD status of stroke patients in relation to vitamin D level is required.
A limitation of this study was a retrospective case control study with a relatively small sample size. Each group was too small to control for all confounding variables in the analysis of determinant factors for serum vitamin D. For this reason, the influence of ambulation ability on vitamin D level was not evaluated for the subacute stage. Even though the results showed differences in vitamin D level according to time lapse after stroke by dividing the subjects into subacute and chronic groups, the design was cross-sectional and not a longitudinal observation. A longitudinal study with more participants is necessary to confirm the influence of stroke on serum vitamin D level.
In conclusion, this study suggests that stroke patients are at risk of vitamin D deficiency because serum vitamin D level starts to decrease after the stroke onset. The risk is increased more for non-ambulatory patients as the post-stroke duration is prolonged. Additional supplementation of vitamin D should be considered in stroke patient, especially those who have restricted outdoor activity for 3 weeks and receive TPN.
Notes
CONFLICT OF INTEREST: No potential conflict of interest relevant to this article was reported.