Sensory Based Feeding Intervention for Toddlers With Food Refusal: A Randomized Controlled Trial
Article information

Abstract
Objective
To investigate the effect of sensory-based feeding treatment for toddlers with food refusal compared with only providing nutrition education.
Methods
Thirty-two toddlers with food refusal were randomly assigned to an intervention group or the control group. Toddlers in the intervention group received the sensory-based feeding intervention and the duration was for 1 hour for 5 days per week for 4 weeks, and then 1 hour, once a week for 8 weeks. Subjects in both the intervention and control groups received nutritional education once every 4 weeks for 12 weeks. The participants were evaluated at their entry into the study and 12 weeks later based on height, weight, behavior at mealtime using the Behavioral Pediatrics Feeding Assessment Scale (BPFAS), and sensory processing ability using the Infant/Toddler Sensory Profile.
Results
Sixteen toddlers were included in each group. Two subjects in the intervention group and four toddlers in the control group were excluded from the final analysis. Significant improvements in child or parent subscales of the BPFAS were observed in the intervention group. In contrast, there were no significant improvements in any BPFAS scores in the control group.
Conclusion
Sensory-based feeding intervention was effective for improving mealtime behavior in toddlers with food refusal. Therefore, a sensory-based feeding intervention could be considered as an intervention approach to address feeding disorders in toddlers.
INTRODUCTION
Food refusal is defined as the rejection of almost all presented foods which results in nutrient deficits and a lack of nutrition for children [1]. Food refusal can also indicate decreased appetite [2] or abnormal behaviors around eating including whining, tantrums, or spitting out food [3]. Food refusal that causes malnutrition is a problem that causes anxiety for both parents and experts, because it is a key symptom of several feeding disorders. Dahl and Sundelin [4] reported that 56% of infants with a feeding disorder under 1 year of age demonstrated food refusal, and about 70% of children with early rejection towards eating continued to show problematic eating behavior, not only at home but also at school [5,6].
Sensory processing difficulties have been reported in children with feeding problems [7,8]. Davis et al. [7] reported that children over 3 years of age with feeding difficulties had sensory processing problems. In addition, our previous study [8] also reported that feeding problems in toddlers are related to sensory processing difficulties. Williams et al. [9] identified 38 intervention studies that targeted children with food refusal and treatments that only involved behavioral interventions. Nevertheless, there are currently only a limited number of studies on sensory-based feeding intervention for toddlers with food refusal. Therefore, this study was investigated to assess the effect of sensory-based feeding treatment for toddlers with food refusal by comparing the intervention with a group that was only provided with nutrition education.
MATERIALS AND METHODS
Subjects
The study was approved by the local Institutional Review Board of Samsung Medical Center (No. 2009-08-067) and informed consent was provided by the subjects’ parents. Participants were recruited from toddlers who visited a feeding disorder clinic due to their feeding difficulties that were related to food refusal. They were characterized by over-reactions such as whining, tantrums, or spitting out food at mealtime. Inclusive criteria were as follows: age between 12 and 36 months, a history of persistent food refusal lasting >1 month, and abnormal feeding disorder. The exclusion criteria were pervasive developmental disorder, or children who were currently receiving tube feeding. Patients with medical diseases such as milk allergy, bowel disease or eosinophilic esophagitis were excluded. Physical examination and medical chart review of all candidates was performed to ensure that the criteria were met, resulting in 32 toddlers that were recruited for this study.
Study design and randomization
This was a single blind randomized controlled study. After screening, patients that met the study criteria were enrolled and randomly assigned to an intervention group or a control group. When consenting to participate this trial, researchers, participants, and their parents were blinded as to whether toddlers would be placed in the intervention or control group. A blocked table were used and cards were sealed with envelopes by an independent administrator for allocation concealment.
Intervention
Toddlers in the intervention group received a sensory-based feeding intervention which included personalized, clinic-based, and multidisciplinary services. The sensory-based feeding intervention was based on the Sequential Oral Sensory (SOS) Approach [10] which was developed by Dr. Kay Toomey. The SOS Approach evaluated patients from multiple perspectives such as organ systems, muscles, development sensory, oral-motor, learning/behavior, cognition, nutrition and environment. After this multi-faceted evaluation, mediators identified characteristics of the food and helped the toddlers address comfort levels with the food, including gradually touching, tasting and eating the foods. The intervention was delivered by an occupational therapist that was trained with the SOS Approach. The intervention duration was for 1 hour per day for 5 days per week for 4 weeks, and then 1 hour, once a week for an additional 8 weeks. Toddlers in both the intervention and control groups received nutritional education once every 4 weeks for a total of 12 weeks. Education was conducted on normal infant intake characteristics, eating environment, including parental attitude, frequency of meals, and recommended daily intake. Nutritional education excluded instructions that might involve parental intervention. The approach used in this study was a general nutrition education and was not based on sensory therapy, and the parents did not perform a separate intervention for their child.
Outcome measures
All outcome measures were evaluated at entry into the study and 12 weeks later after the interventions were complete.
Baseline characteristics
Baseline data collected at recruitment before intervention included demographic data and developmental status. Demographic data included age, gender, height, gestational age and birth weight. The Bayley Scales of Infant Development-II (BSID-II) was used to assess the neurodevelopmental status of the toddlers [11]. The mental and motor scales of the BSID-II, without behavior scales, were used in the present study. Scores on the mental and motor scales were converted to the Mental Development Index (MDI) and Psychomotor Development Index (PDI), with a mean of 100 and standard deviation (SD) of 15.
Anthropometric parameters
All children were regularly weighed by a nutritionist that used calibrated scales while wearing only indoor clothing without their shoes. Anthropometric measurements were performed in accordance with standard procedures [12]. The data were converted to z scores for ease of comparison across ages, as recommended by Waterlow et al. [13]. Weight-for-age z-scores (WAZ) and height-for- age z-scores (HAZ), were generated using the World Health Organization 2006 growth standards to determinate underweight and stunting statuses, respectively [14]. An underweight status was indicated by a WAZ <-2 and stunting was indicated by a HAZ <-2 [15].
Behavior assessment
The Behavioral Pediatrics Feeding Assessment Scale (BPFAS) was initially created to examine behaviors that are associated with undernourishment in children [16]. Of the 35 items, 25 are specifically for children’s behaviors and feelings and 10 are for parental behaviors and feelings, with options from 1 (never) to 5 (always). For all items, a higher scoring on the BPFAS indicates a greater severity of the problems. Parents also answered yes or no if each item was a current problem. All scores were summed and summarized into the following four variables: mean intensity of parent ratings of child behavior, mean intensity of parent ratings of parent behavior, frequency of parent problems with child behavior, and frequency of parent problems with parent behavior.
Sensory processing ability
The Infant/Toddler Sensory Profile (ITSP) was created to measure the sensory processing abilities in children aged 7 to 36 months [17]. The ITSP is based on questionnaires completed by parents. Scoring for children’s behaviors is based on a 5-point scale and the lower the score, the higher the frequency of action. Once a summation of scores is completed for auditory, visual, vestibular, tactile, and oral sensory sections, the sum is interpreted based on age-specific criteria. An atypical behavior is defined as a score more than 1 SD above the mean, which is considered clinically and statistically significant.
Statistics
The normality was first certified based on the Shapiro-Wilks test, and then the independent t-test or the Mann-Whitney test were performed to examine the differences between the control and experimental groups. Comparison of continuous variables within a group was made using the paired t-test or the Wilcoxon signed-rank test. The χ2 test or McNemar test was used to compare discrete variables between groups or within a group, respectively. Data were analyzed using SPSS for Window, version 19.0 (IBM Corporation, New York, NY, USA).
RESULTS
Sixteen toddlers were included in each group. Two in the intervention group (1 movement abroad and 1 lack of follow-up) and four in the control group (4 lack of follow-up) were excluded (Fig. 1) which resulted in a final analysis of 14 toddlers in the intervention group and 12 toddlers in the control group.
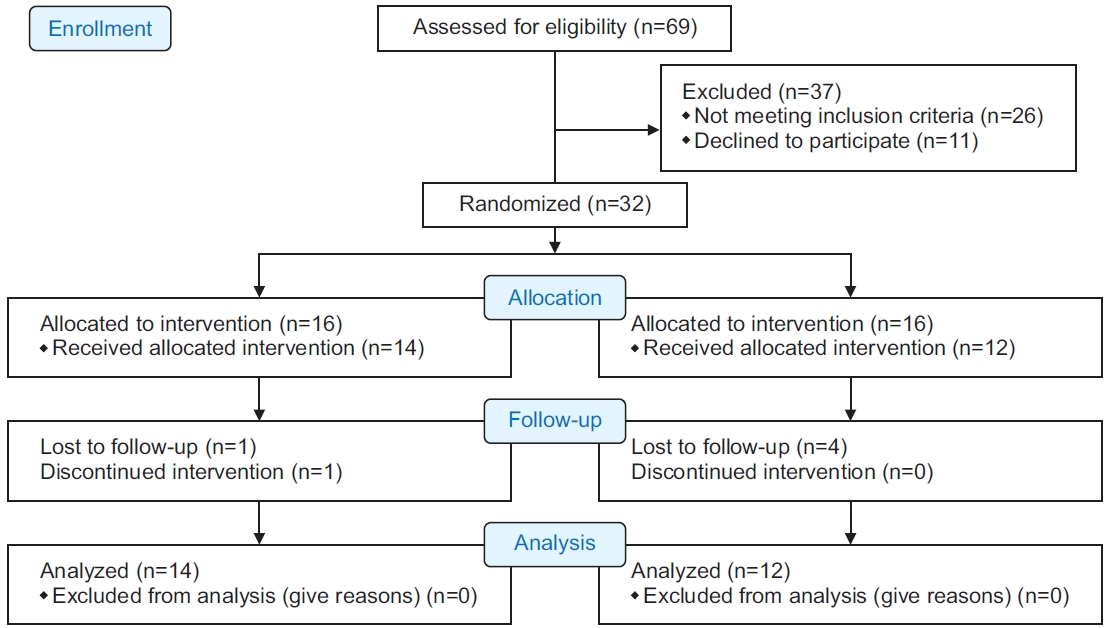
Allocation process flow.
Baseline characteristics
No significant differences were found between the groups in the following measures before the intervention: child’s sex, age, weight, height, gestational age, birth weight, and mental and motor development (Table 1).

Baseline characteristics of participants
Anthropometric data
Improvements in the height and weight in both groups were noted after the intervention. However, there were no significant differences in changes in the anthropometric data between experimental and control groups (Table 2).
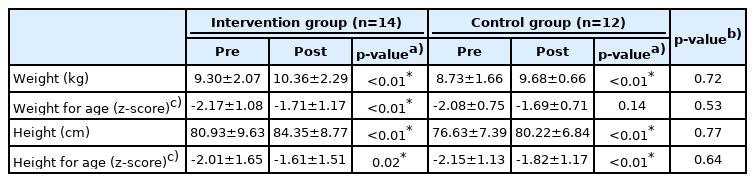
Changes of the anthropometric data
Behavior at mealtime
There were no significant differences in mealtime behavior between the experimental and control groups at the pre-treatment evaluation. Significant improvements in both mean intensity ratings and frequency of problems on the BPFAS were observed in the intervention group. In contrast, there were no significant improvements in any of the BPFAS scores in the control group. The changes after treatment between the two groups were compared and indicated that the change in the mean intensity ratings of problems on the parent subscale was significantly larger in the intervention group than that in the control group (Table 3).

Changes of the Behavioral Pediatrics Feeding Assessment Scale
Sensory processing ability
There were no significant differences in the numbers of atypical performance in all five sensory sections of the ITSP between inter- and intra-groups at pre- and post-treatment evaluations (Table 4).
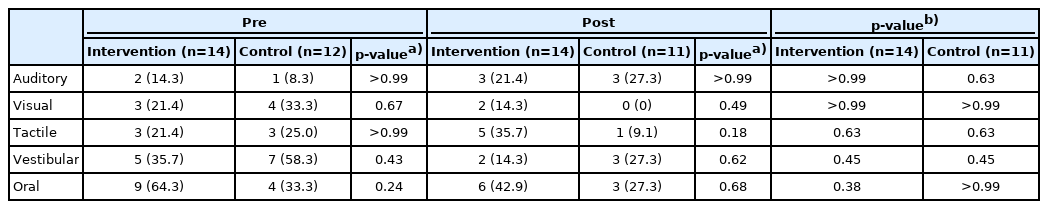
Changes of the atypical performances in each sensory section score of the Infant/Toddler Sensory Profile
DISCUSSION
The present study is meaningful because it assesses the effect of a sensory-based feeding intervention on mealtime behavior of toddlers with food refusal. In spite of the overall short-time period for the intervention, there were significant improvements in mealtime behaviors in both the child and parent subscales of the BPFAS.
To date, because there are no controlled studies for children with food refusal, it has not been possible to compare advantages of various interventions. One trial randomly assigned subjects into either an intervention group or a group that involved only nutrition education and meal schedules [18]. This present study was a randomized controlled trial for children with food refusal and avoidance behavior to assess methodological threats to intervention research, including the lack of an appropriate control group, nonrandom group assignment, and the use of non-blinded assessors.
Only a few studies have been conducted on sensory-based feeding interventions for toddlers with food disorders. Addison et al. [19] compared the effects of sensory integration therapy as a treatment for the feeding problems of only two children. They reported that behavioral therapy was more effective than sensory integration in terms of increased acceptance and intake amount, which reduced inappropriate behavior. Our study was distinct from Addison’s study [19] because it was a sensory-based intervention that was directly related to feeding and included a larger number of toddlers.
The SOS Approach addresses both sensory processing and other factors that are related to feeding such as oral motor, learning, behavioral, cognition, nutrition, and environmental [10]. In this model, multidisciplinary team members evaluate and treat problematic factors in a step-by-step approach so that the child with food refusal becomes accustomed to various food properties. Compared to the behavioral approach, where the goal was to accept food by reducing problem behaviors and teaching appropriate responses [20], the SOS Approach focuses on age-appropriate skill development such as sitting at the table regularly, self-eating with tools and swallowing. In this study, after the SOS Approach was applied, the number of children who showed atypical performances decreased in the oral sensory processing area of ITSP, but this result was not statistically significant. Additionally, no meaningful results were obtained in other areas of ITSP. The reason why the SOS Approach did not have a significant effect on the sensory processing function may be attributable to the short treatment period or the severe abnormality of the child’s sensory processing function. Although the intervention did not affect the sensory profile of ITSPs, the reason for the improved mealtime behavior in BPFAS is that the SOS Approach addresses sensory processing as well as other factors that affect eating. Feeding disorders may be due to a child’s hypersensitivity to the senses, but it could also result from low registration that has difficulty with recognizing or handling various foods. Therefore, based on the results of this study, the SOS Approach reduced refusal by giving the child an opportunity to learn about the food. The effectiveness of the SOS Approach seen in short-term interventions is likely to be relatively small, as it does not directly prevent food escape compared to behavioral approaches. Additionally, this is a harmless approach that improves eating behavior without raising the child’s stress levels.
Although there were improvements in anthropometric parameters in the intervention group, the differences in improvements of weight and height were not significant between the two groups. We expected that there would be an increase in body weight in the anthropometric data in the intervention group, but this could not be confirmed. This is likely because the improvement in eating disorders will increase the amount of eating in the long term. Because there are only a few controlled studies of toddlers with food refusal, it is difficult to compare or extrapolate whether the insignificant effect of sensory feeding intervention on anthropometric data was due to the short-term follow-up or other factors. Therefore, to assess this and determine the correlation between the follow-up period and anthropometric data, future studies will be needed that incorporate sensory-based feeding interventions with long-term follow-up. Long-term tracking will also be necessary to determine whether the positive changes that were demonstrated immediately after the intervention continue over the long term. Future research studies need to evaluate the effect of sensory-based feeding interventions not only on mealtime behavior but also on sensory processing abilities, anthropometric parameters, and developmental status.
The sample size in the present study was relatively small due to difficulty in recruiting candidates. Because of the difficulty in recruiting participants, we included a broad spectrum of toddlers with food refusal. To identify a wide range of subjects with food refusal, they were recruited from the tertiary hospital, and the pool of prospective participants included different groups such as premature birth or delayed growth before and after childbirth. Due to the constraints, the sample size might have been smaller if additional inclusion and exclusion criteria had been applied. Because of the insufficient number of subjects, subgroup analysis was not possible to evaluate the presence or absence of failure to thrive, tube feeding, intensive care unit (ICU) care, and motor function impairment. The possibility of a change in sensory perception and awareness of the oral pharyngeal region is suggested through tube feeding and ICU care for the sensory-based feeding problems. Furthermore, for sensory and motor disorders, there are many cases of patients reported with deficits in both and not just one are and there is a need to distinguish the primary issue. It is thought that the presence or absence in the medical history may affect the severity of symptoms and treatment outcomes. In addition, if subgroups with or without failure to thrive are compared, there is a possibility that major feeding problems that can affect growth can be identified. Consequently, further prospective studies with larger samples are needed to clarify these issues.
Another limitation for this study was the lack of information about the toddlers’ relationship with their parent or the socioeconomic status that may affect food refusal behaviors. Feeding difficulties involve a variety of medical, environmental, nutritional, and social variables that are complexly related to each other; thus, these additional factors need to be considered for a more accurate analysis. Additionally, there was a deficit in the information on feeding milestones or possible trigger factors for feeding challenges. Therefore, future research should include information such as socioeconomic status, parent-child interaction, and milestones of food intake to elucidate the effect of sensory-based feeding interventions.
In conclusion, the results from this randomized clinical trial suggest that sensory-based feeding intervention is effective for improving mealtime behavior in toddlers with food refusal. Therefore, a sensory-based feeding intervention could be considered as an intervention approach for toddlers with food refusal. Future investigations may expand on these findings by considering other factors that can affects feeding challenges through long-term follow-up in a larger sample size.
Notes
No potential conflict of interest relevant to this article was reported.
Conceptualization: Kwon JY. Methodology: Kwon JY, Yi SH. Formal analysis: Kim AR, Kwon JY, Yi SH, Kim EH. Project administration: Kwon JY, Yi SH. Visualization: Kim AR, Yi SH. Writing-original draft: Kim AR, Yi SH. Writing-review and editing: Kim AR, Yi SH. Approval of final manuscript: all authors.
Acknowledgements
This work was supported by a grant from Samsung Medical Center.