Effort Assessment of Stroke Patients in Physiotherapy Session by Accelerometry and Perceived Exertion Score: Preliminary Study
Article information

Abstract
Objective
To determine whether post-stroke patient’s perceived exertion correlates with effort intensity score as measured by a wearable sensor and to assess whether estimates of perceived exertion are correlated to the cerebral hemisphere involved in the stroke.
Methods
We evaluated the effort intensity score during physiotherapy sessions using a wearable sensor and subjects assessed their perceived exertion using the modified Borg CR10 Scale.
Results
Fifty-seven subacute stroke patients participated in the study. The correlation between perceived exertion rating and measured effort intensity was insignificant—mean (r=-0.04, p=0.78) and peak (r=-0.05, p=0.70). However, there was a significant difference (p<0.02) in the perceived exertion ratings depending on the cerebral hemisphere where the stroke occurred. Patients with left-hand side lesions rated their perceived exertion as 4.5 (min–max, 0.5–8), whereas patients with right-hand side lesions rated their perceived exertion as 5.0 (2–8).
Conclusion
While there was an insignificant correlation between perceived exertion and effort intensity measured by a wearable sensor, a consistent variations in perceived exertion estimates according to the side of the cerebral lesion was identified and established.
INTRODUCTION
The benefits of physical activity after stroke are well documented and have led to the publication of specific guidelines for post-stroke patients [1,2]. These recommendations are governed by three parameters: duration, frequency and intensity of activity. The first two objective are relatively easy to measure, but quantifying intensity is more complex. However, the intensity of physical activities must be sufficient to bring about health benefits, but not too high, as it would cause a risk to the patient’s health. It therefore seems essential to measure this parameter to recommend the optimal amount of physical activity in rehabilitation programs. To control the intensity of physical activities, the guidelines suggest the following methods: assessing the heart rate, monitoring the oxygen consumption, or a registering a perceived exertion (PE) score [1].
The Borg Scale is frequently used in post-stroke rehabilitation programs to quantify the PE and intensity of physical activities [3-5]. Previous studies have demonstrated the relationship between the PE score as estimated by the Borg Scale and the effort as measured by a heart rate monitor (r=0.46, p<0.05) [6] or a breathing gas analyzer (r=0.33, p<0.001) [7]. However, despite these tools being recommended by the guidelines, they are not used by many in everyday practice due to their cost, bulky size and unsuitable use for pathology [8].
Another method used to assess the intensity of physical activity in post-stroke patients is the use of accelerometry. Wearable sensors are reliable and have been validated to monitor physical activity at all stroke phases [9]. They present two main advantages: the assessment of physical activity intensity is not based on the patient’s cognitive skills, and data can be collected over time periods ranging from several minutes to several days. In addition, these measurements are non-invasive and do not interfere with activities [10].
The objective of our study was to determine the relationship between the PE score and the intensity of activity measured by a wearable sensor during a physiotherapy session. Physiotherapy sessions were chosen because a recent work, including 88 post-stroke patients (Barthel Index, 61±25/100) in subacute phase (post-stroke delay, 43±34 days) hospitalized in Rehabilitation unit, reported that, during a typical day in rehabilitation (9:00 am to 4:30 pm), the patients performed more physical activity during physiotherapy sessions [11]. We hypothesized that the PE score would be higher for patients that exhibited higher effort intensity and for patients with lower independence degree.
MATERIALS AND METHODS
Design and study participants
This non-randomized observational study was performed in a University Hospital Center in the Physical and Rehabilitation Medicine unit. Patients were recruited for 6 months. The inclusion criteria were: patients must be over 18 years old, being hospitalized for stroke and stroke occurred less than 6 months before the study. Exclusion criteria were the presence of cardiorespiratory decompensation (in particular dyspnea or COPD), cognitive impairments preventing a patient from understanding the protocol, and aphasia.
Each patient was informed about the procedure and aims of the study. Each patient enrolled voluntarily and provided written informed consent. All procedures complied with the principles of the World Medical Association declaration of Helsinki [12]. The research protocol was accepted by the French ethics committee CERNI (Comité d’Ethique pour les Recherches Non Interventionnelles) (No. 2015-01-13-57).
Measures
For each patient, the following characteristics were collected: age, weight, height, body mass index, type of stroke, side of lesion and various risk factors (recurrence, obesity, dyslipidemia, diabetes, tobacco smoking, high blood pressure).
The Barthel Index was used to assess to what levels the patients were independent in their daily life situations. The Barthel Index is assessed on a scale of 0–100, where 100 represented complete independence [13].
The walking functional capacity of each patient was evaluated using the functional ambulation classification that categorized patients into six groups (0–5) according to their walking independence: 0 indicating a patient who cannot walk or needs help from more than one person; 1 indicating the permanent need for helper assistance; 2, intermittent helper assistance; 3, verbal support without physical assistance; 4, the patient could walk independently except in stairs, slopes, or rough field; 5, complete independence, regardless of field [14,15].
The Motor Index score was used to assess the motor impairment of each patient’s upper and lower limbs. This index is a scale from 0 to 100, where 100 represented total motor capacity [15].
Effort intensity (in metabolic equivalent [MET] units) was evaluated using the SenseWear Armband (SWA) (BodyMedia Inc., Pittsburgh, PA, USA). The SWA is a multisensory activity monitor worn on the upper left arm and provides an estimation of energy expenditure during daily normal activities from a triaxial accelerometer, the galvanic skin response and the body heat loss. The associated SWA software also indicates average and peak intensity during the physiotherapy session.
The patients reported their PE based on the Borg CR10 Scale modified. It was presented as follows: 0<0.5<1<2<3<4<5<6<7<8<9<10. ‘0.5’ represents very weak intensity (barely noticeable) and ‘10’ represents extremely great effort [16].
Procedures
Each patient was evaluated by an experienced medical specialist, to determine a score of independence based on the Barthel Index. This index contains 10 items (in relation to daily normal activities such personal cares or displacements), each being rated 0, 5, 10 or 15 according to the items. The final score of independence corresponded to the sum of all item scores.
During the sessions, the physiotherapists made the patients do exercises that focused on transfers, articular mobility (especially with the limb on the affected side), balance (sitting and standing), walking (level), and walking up and down stairs. The sessions were personalized and adapted by the physiotherapist according to patient’s stage of rehabilitation. All patients participated in daily physiotherapy sessions 5 times a week. One physiotherapy session was chosen randomly for recording, at least 3 weeks after the beginning of the rehabilitation program. The patient wore the SWA on the upper part of the nonparetic arm at the start of each physiotherapy session and removed it at the end of each session [17]. Two subsamples were identified according to the hemispheric location of the stroke: right hemisphere group (RHG, n=21) and left hemisphere group (LHG, n=36). In the LHG, only 8 patients wore the SWA on their dominant arm, while all patients in RHG wore the SWA on their dominant arm. For this study, 4 physiotherapists were trained on how to use the Borg Scale with their patients. They asked the following question to evaluate PE at the end of physiotherapy sessions: “How would you rate the intensity of the effort you provided during the session, based on this scale?”, while visually showing the Borg CR10 Scale to the patient.
Statistical analyses
The study result was analyzed using the StatView 5.1 software (SAS Institute, Cary, NC, USA). Each parameter was expressed as the mean±standard deviation. Data normality was checked using the Kolmogorov-Smirnov test. Our initial hypothesis that the PE score has a correlation with session intensity or with the level of patient autonomy was evaluated using the Pearson correlation. Since the results’ values followed a normal distribution, an unpaired Student t-test was performed to determine if there was a difference in PE score according to the hemispheric location of the stroke. Even though the values followed a normal distribution, we still performed a Mann-Whitney non-parametric test to compare the median values of the two sub-samples from rank to rank, due to the particularity of the Borg Scale modified. We compared the median values because the Borg Scale is not a continuous variable due to the presence of an irregular interval in the scale. A two-tailed p-value less than 0.05 was considered significant.
RESULTS
Fifty-seven patients participated in this study, with a mean age of 66±17 years and a post-stroke delay of 38±30 days. The characteristics of our patient sample were summarized as shown in Table 1.

Characteristics of the overall sample (n=57)
On average, the physiotherapy sessions lasted 72±23 minutes. No unexpected adverse events occurred during the recorded physiotherapy sessions. Session intensities and PEs were as shown in Table 2. The mean intensity of effort of the physiotherapy sessions corresponded to inactivity periods, while the peak value indicated a moderate intensity level.
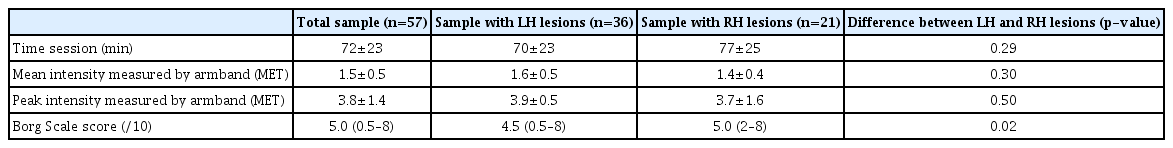
Perceived exertion and effort intensity measured in physiotherapy sessions in patients recovering from a stroke
Correlations between different parameters recorded in physiotherapy sessions were presented as shown in Table 3. The overall sample results showed no significant correlation between PE score and exercise intensity (mean and peak) reached during the sessions. There was no correlation between the PE score of the patient and the duration of the physiotherapy session, according to either Barthel Index or Motor Index score. There was also no correlation between the session intensity (mean and peak) and the previously mentioned parameters.

Correlation coefficients (r) between different parameters recorded in physiotherapy sessions
Two sub-samples were identified according to the hemispheric location of the stroke: (1) RHG (n=21) including patients who were affected with a stroke localized in the right hemisphere of the brain, and (2) LHG (n=36) including patients who were affected with a stroke localized in the left hemisphere of the brain.
The two patient groups exhibited comparable characteristics, with no significant difference with respect to age (p=0.54), body mass index (p=0.88), Barthel Index (p=0.81), Functional Ambulation Classification (p=0.90), Motor Index score (p=0.68) or time since stroke (p=0.88).
Interestingly, the self-rated PE for RHG was significantly higher than for LHG (p=0.02) even though the intensity of the sessions were comparable (Table 2).
DISCUSSION
The main objective of this study was to determine whether post-stroke patient’s PE correlates with effort intensity score as measured by a wearable sensor. We hypothesized that the higher the PE score, the higher the intensity of the physical effort measured by the armband and the lower the level of independence (as evaluated by the Barthel Index). The results of this study showed no correlation between these two methods of measuring the intensity of effort and rejected our initial hypothesis.
In contrast with the result of our study, Wu et al. [7] found a low correlation (r=0.33, p<0.001) between the PE score measured after each activity and the corresponding oxygen consumption in post-stroke patients; however, they also assessed the PE during low-intensity rehabilitation sessions.
The insignificant correlation could be explained by two main factors: the modalities of use of the Borg Scale and the measurement biases of the two chosen methods.
First, the results of this study could be partly explained by the conditions of use of the Borg Scale. According to existing guidelines, it is recommended to use the Borg Scale at the end of each exercise, in this study, Borg Scale was used at the end of a rehabilitation session. In previous works focused on identifying correlations between measured effort and PE score, the exercises were performed over relatively short periods, i.e., in maximal exercise tests or 6-minute walk tests [5,18]. There are no researches that has evaluated the PE rating on longer physical activity sessions in a stroke population. However, it may be proven interesting to use the PE score over longer durations, especially to evaluate daily life activities or to control rehabilitation sessions like in this study, where the physiotherapy sessions lasted 72±23 minutes in average. For example, previous studies on in healthy people used the Borg Scale over 1.5-hour sessions to evaluate the intensity of soccer training programs [19]. For the moment, our results tend to suggest that the Borg Scale may not be suitable to assess long physical activity sessions for post-stroke patients.
Finally, our results could also be partly explained by the measurement based on the two chosen methods: Borg Scale and the SWA actimeter. Regarding the latter, commercially-available sensors tend to poorly identify low-intensity activities and frequently show measurement based on their position on the body and the nature of the activity. However, the SWA has been tested and has displayed good measurement accuracy in low-intensity activities of daily living [20,21]. Using this specific actimeter therefore reduces the likelihood that the lack of correlation could be caused by the measurement accuracy of the sensor. Despite this additional reliability, there may be physical activities that the SWA could not detect as being energetically expensive but are cognitively expensive for the patient, e.g., activities focused on static equilibrium, which would be perceived as more exhausting. This could therefore be an explanatory factor for this lack of correlation.
The Borg Scale also shows measurement biases. This scale is a declarative measurement method used by patients to evaluate their subjective physical effort. However, in the population in this study, this evaluation may have been influenced by post-stroke sequelae which were especially unstable in the subacute phase, such as fatigue, affect and mood. Thus, the health state of the patient at the time of the session recording may have influenced the patient’s PE and partly justify the lack of correlation between the SWA and the Borg Scale.
This study has several limitations which prevented the research team from going further with the analysis of the results. One of them being that we could access the raw data of the device, which would have allowed for a more detailed analysis. The second is the sample and sub-sample sizes, which are too small to be as relevant as desired, which explains why we opted for a simple comparison between patients with right hemisphere and left hemisphere lesions. Further studies will be required to fully understand the PE score difference between right and left lesions by considering a detailed analysis of cognitive functions. In addition, the small sample size did not allow us to analyze the effect of the positioning of the armband regarding each patient’s dominant side and the side of the lesion, as these elements could potentially affect the results.
In conclusion, an insignificant correlation was found between self-assessed PE score and effort intensity measured by a wearable sensor, however we did identify a significant difference in PE score between patients depending of the hemispheric location of the stroke. The lack of correlation between self-assessed PE score and effort intensity could partly be explained by the limitations of the Borg scale, as it may not apply to long physiotherapy sessions. Further work is required to refine this scale for the assessment of PE in patients recovering from subacute stroke and to identify explanatory factors of the PE score difference according to the hemispheric location of the stroke.
Notes
No potential conflict of interest relevant to this article was reported.
Acknowledgements
We would like to thank the patients who volunteered to be assessed in this research. We thank our partners Autonom’Lab, the European Network of Living Labs (ENoLL) and the Limousin region for supporting our work. This project was carried out with the support of the Fondation Paul Bennetot and Fondation du Groupe Matmut, under the aegis of the Fondation de l’Avenir, Paris, France.
Notes
Conceptualization: Borel B, Lacroix J, Mandigout S. Methodology: Lacroix J, Compagnat M, Mandigout S. Funding acquisition: Daviet JC, Mandigout S. Project administration: Salle JY, Daviet JC. Visualization: Lacroix J, Salle JY, Compagnat M. Writing – original draft: Lacroix J, Mandigout S. Writing – review and editing: Borel B, Lacroix J, Daviet JC, Mandigout S. Approval of final manuscript: all authors.