Influence of Nasogastric Tubes on Swallowing in Stroke Patients: Measuring Hyoid Bone Movement With Ultrasonography
Article information

Abstract
Objective
To investigate the influence of a nasogastric tube (NGT) on swallowing simulated saliva in stroke patients.
Methods
Three groups of participants were enrolled into the study: group A (20 stroke patients with a NGT), a control group B (25 stroke patients without a NGT), and group C (25 healthy adults with no brain lesions or dysphagia). Participants swallowed 1 mL of water to simulate saliva. Patients in group A were tested twice: once with a NGT (group A1) and once after the NGT was removed (group A2). The distance of hyoid bone movement was measured by subtracting the shortest distance between the mandible and hyoid bone (S) from the distance at resting state (R) measured with ultrasonography. The degree of the movement was calculated by (R–S)/R. The trajectory area of hyoid bone movement (Area) and the interval between the beginning of hyoid bone movement and the moment of the shortest hyoid−mandible approximation (Interval) was calculated by a computer program.
Results
From group A: R–S and (R–S)/R of group A2 at 1.14±0.36 cm and 0.30±0.09 cm and were significantly greater than those of group A1 at 0.81±0.36 cm and 0.22±0.08 cm (p=0.009 and p=0.005). After removing the NGT as seen in group A2, R–S and (R–S)/R were improved to the level of those of group B at 1.20±0.32 cm and 0.30±0.09 cm (p=0.909 and p=0.997). The Area of group A2 was larger and the Interval of group A2 was shorter than those of group A1 though a comparison of these factors between A2 and A1 did not show a statistically significant difference.
Conclusion
A NGT interferes with the movement of the hyoid bone when swallowing 1 mL of water in stroke patients though the movement is restored to normal after removing the NGT.
INTRODUCTION
Dysphagia occurs in 25%−32% of post-stroke patients, and if prolonged, can cause deprivation of nutrition and hydration. When undigested food remains in the oral cavity, pharynx, or esophagus, it can also lead to prolonged hospitalization or increased risk of sepsis [1,2]. Oropharyngeal function must be tested in stroke patients with dysphagia if the risk of aspiration pneumonia is high, and the need for insertion of a nasogastric tube (NGT) or percutaneous endoscopic gastrostomy (PEG) tube should be considered as well. NGT feeding is a relatively less invasive method than PEG tube feeding, and is often preferred by patients. However, this tube constantly stimulates the nasopharynx to excrete excessive mucus, which increases the risk of esophagitis due to gastroesophageal reflux and aspiration pneumonia [3,4]. NGT are usually removed after evaluating the patient’s sensory and motor disability, communication ability, mental status, and ability to swallow. When the swallowing ability recovery is delayed, the duration of insertion can become prolonged [5,6]. PEG feeding is found to be superior to NGT for its safety and reliability for long-term nutrition care in stroke patients [7].
During swallowing, hyoid bone movement is important for opening the esophageal sphincter by causing epiglottis tilting. A pathological decrease or delay in hyoid bone movement is a major risk factor for aspiration [8,9]. Laryngeal elevation and hyoid bone movement can be estimated roughly using a subjective and non-quantitative palpation method. To assess the swallowing ability including hyoid bone movement the majority of previous investigations have used videofluoroscopic swallowing studies (VFSS). Recently, ultrasonography (US) has been used to assess dysphagia, as this approach is low-cost, involves no radiation, and is highly accessible. Its capability to evaluate dynamic structures suggests that laryngeal elevation could be measured easily by identification of hyoid bone movement, which is the most important process in swallowing and a determining factor for aspiration and penetration. Measuring changes of hyoid bone displacement using US showed good validity that is highly correlated with VFSS measurement in stroke patients and good intra-rater and inter-rater reliability as well [10,11].
The aim of this study was to examine the effect of NGT insertion on swallowing function in stroke patients by comparing the swallowing ability between those with and without a NGT using US. We also investigated the risk of aspiration pneumonia caused by a small amount of saliva, to provide a basis for setting an objective criterion for changing from a NGI to a PEG tube in patients with prolonged NGT feeding.
MATERIALS AND METHODS
Participants
The study was approved by the Ethics Committee of Sahmyook Medical Center (IRB No. SYMC-1706-03), and informed consent was obtained from each participant. From May 2017 to July 2017, 20 stroke patients with NGT (group A), 25 stroke patients without NGT (control group B), and 25 healthy adults with no brain lesions or dysphagia (control group C) were enrolled in this study. Inclusion criteria for the stroke patients with NGT insertion or without NGT were as follows: (1) patients with a confirmed diagnosis of stroke by brain image; and (2) patients with stable disease, ‘on state’, with the same medications for more than 2 months.
Patients were excluded if they: (1) could not consent due to low cognitive function, were unable to obey onestep commands, or maintain a sitting position; (2) had a history of surgery or disorders related to the oropharynx (such as thyroidectomy, vocal cord palsy); (3) had a history of head and neck cancer; (4) were being treated for pneumonia; or (5) had gastric ulcers. Medical record data were recorded for the individuals in each group including: age, gender, stroke duration, stroke location, body mass index (BMI), Mini-Mental State Examination (MMSE), and Modified Barthel Index (MBI) scores. The Mann Assessment of Swallowing Ability (MASA) was performed by the single investigator in this study (Kwak HJ).
Ultrasonographic evaluation
US was used to perform a swallowing function test in group A (receiving a NGT swallowing of water three times). Identical patients were tested twice; subgroup A1 referring to the state with NGT present and subgroup A2 referring to the state with NGT removed with a 30-minute interval in between swallowing and removal. In control groups B and C, US was used to measure the movement of the hyoid bone. An ultrasonography machine (Accuvix V10, Medison, Seoul, Korea) with a 3–6 MHz curved-array transducer was used for these tests, which were performed by a single investigator (Kwak HJ), and repeated three times for each participant. Throughout the process, the least amount of pressure, with a large amount of coupling agent, was applied to minimize the compressive effect of the transducer on swallowing movements.
Participants were seated in a comfortable upright position, with the head in a neutral position. A longitudinal view of the tongue base was acquired by placing the transducer on the midsagittal plane, inferior to the mental area (Fig. 1). The participants were asked to relax and stay still before measuring the maximum tongue thickness (Fig. 2A). The hyoid bone and mandible bones were seen as acoustic shadows on the screen (Fig. 2A) and acted as anatomical references for measuring the hyoid−mandible distance, that is, the distance between these two calcifications [9]. The participants were then asked to swallow 1 mL of water while the entire swallowing process was monitored and recorded on video by the US. The test was repeated three times at intervals of one minute for each participant. To determine the shortest hyoid−mandible approximation distance, images acquired by US in every swallowing step were traced and measured with an electronic caliper (Fig. 2B). Finally, the time to hyoid−mandible approximation was estimated by counting the number of frames recorded, in which each frame represented a millisecond, from the beginning of hyoid bone movement to the shortest hyoid−mandible approximation. The resolution of recorded video was 640×480 pixels and the frame rate was 30 frames per second.

Longitudinal ultrasonographic images of hyoid–mandible approximation at rest and during the swallowing state. (A, B) Longitudinal approach of ultrasonographic probe, anterior view. (C) Longitudinal approach of ultrasonographic probe, lateral view (dotted arrow, mandible bone; black arrow, hyoid bone).
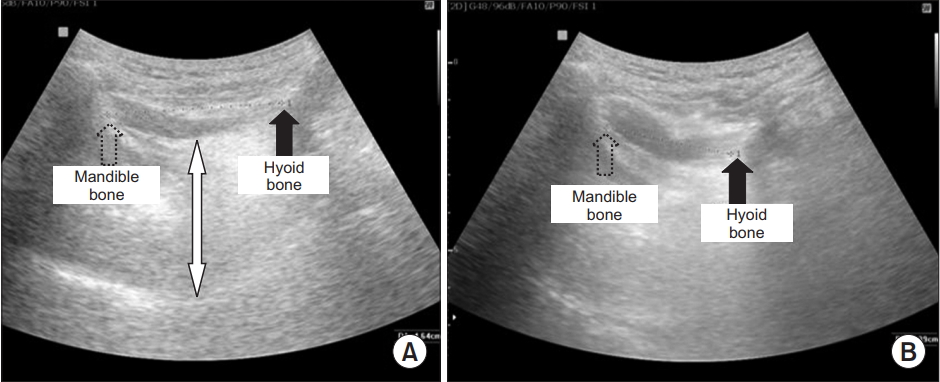
Hyoid bone displacement. (A) Distance between the mandible and the hyoid bone at rest, (B) during swallowing. The thickest area of the tongue is shown by white arrow; the dotted arrow shows the shadow behind the mandible; the black arrow shows the shadow behind the hyoid bone.
Computer-based assessment of hyoid bone motion from ultrasonographic swallowing studies
Using the Kinovea v.0.8.15 software (microanalysis for video), the analysis and its time were measured automatically in milliseconds (ms) after the tracer marker was placed on the hyoid bone (Fig. 3A). Kinovea is a free software application that allows measurement and comparison of movements in sports and training. It can trace the trajectory of an object without any specific physical sensory equipment, and can be used for measurements in a rehabilitation setting. The area drawn by the tracer marker is measured in pixel units using ImageJ 1.51p, an image processing and analysis program (Fig. 3B). Fig. 3C shows an illustration of the range-of-motion measurement for a hyoid bone trajectory. The illustration shows a hyoid bone trajectory in blue over the course of a single swallow. The initial resting position of the hyoid is marked with a black circle. The blue arrow shows the direction of motion for the trajectory. The analysis for the maximal displacement is made by finding the largest displacement between any two points on the hyoid bone trajectory during the swallow with red dots. The entire process was performed by the single investigator (Kwak HJ) who was familiar with the program.
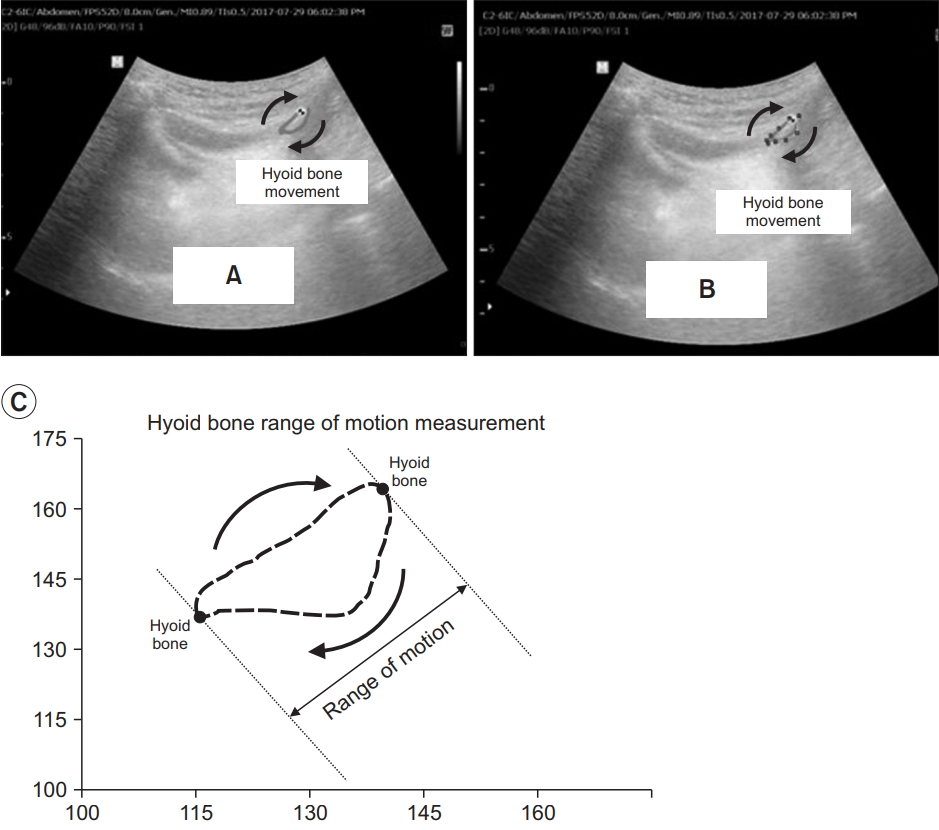
The range of the hyoid bone movement depicted by a tracer marker at the ultrasonography video taken using a Kinovea v.0.8.15 software (microanalysis for video) (A). The marked range of motion was then measured in pixel units using imageJ, an image processing and analysis program (B). Illustration of the range-of-motion measurement for a hyoid bone trajectory. (C) The illustration shows a hyoid bone trajectory in blue over a single swallow. The initial resting position of the hyoid is marked with the black circle. The red arrow shows the direction of motion for the trajectory. The range-ofmotion measurement is made by finding the largest displacement between any two points on the hyoid bone trajectory during the swallow shown in red dots.
Videofluoroscopic swallowing study
A videofluoroscopic swallowing study was conducted on patients in group A with the NGT removed. Group A was evaluated by VFSS in an upright seated position. Fluoroscopy (Brivo OEC 850 C-arm; GE Healthcare, Waukesha, WI, USA) was performed in the lateral view and recorded with the AVerMedia Live Gamer HD video recording program in real time. To investigate and evaluate penetration and aspiration during the pharyngeal phase, VFSS with the intake of 1 mL of water was performed by the single investigator (Kwak HJ). Penetration was defined as when the intake bolus remained between the true vocal folds and the epiglottis or spilled into the laryngeal vestibule. If the swallowed material passed below the vocal fold and was ejected into the larynx level, it was defined as aspiration. To be considered as penetration, the material must not pass the true vocal fold. Whereas, aspiration involved materials passing the true vocal fold [12]. In this study, the non-aspirators group was defined as Penetration‐Aspiration Scale 1 (PAS 1), the penetrators group was defined as PAS 2–5, and the aspirators group was defined as PAS 6–8.
Statistical analysis
Means and standard deviations from continuous data are reported for characteristics such as age, stroke duration, BMI, height, weight, MMSE, MBI, MASA, tongue thickness, and hyoid−mandible resting distance. To analyze the above continuous data, analysis of variance (ANOVA) with Tukey’s honest significant difference (HSD) post-hoc test, was used to determine significant differences among the groups A1, A2, B, and C. In the case of categorical data such as gender and stroke location, prevalence and percentage of the classification were presented and compared using the chi-square test. R–S, R–S/R, Area, and Interval data from groups A1 and A2, measured by US, were compared using paired t-test (R, resting distance; S, shortest distance; R–S indicates the value calculated by deducting the shortest distance between the mandible and hyoid bone from the rest distance; (R–S)/R, the length of the hyoid bone movement/resting distance; Area, the range of the hyoid bone movement depicted; Interval, the time interval between the initiation of hyoid bone movement and the moment of the shortest hyoid−mandible approximation). ANOVA was used to analyze and compare data through US from three different groups (A1, B, and C; and also A2, B, and C). Spearman rank correlation analysis was used to test the correlation between the data from groups. All statistical analyses were performed using SPSS version 17.0 for Windows (SPSS Inc., Chicago, IL, USA). The level of statistical significance was set at a p-value less than 0.05.
RESULTS
The baseline characteristics of the study population are presented in Table 1. There was a significant difference in MBI scores and MMSE scores (both p<0.0001).

Demographic characteristics of the subjects
As shown in Table 2, the mean R–S was 0.81±0.36 cm for A1; 1.14±0.36 cm for group A2. The mean R–S was 1.2±0.32 cm for group B; and 1.5±0.23 cm for group C. There was a significant R–S difference between groups A1 and A2 (p=0.009); group A1 and B (p=0.001); groups A1 and C (p<0.0001); and groups A2 and C (p=0.001).
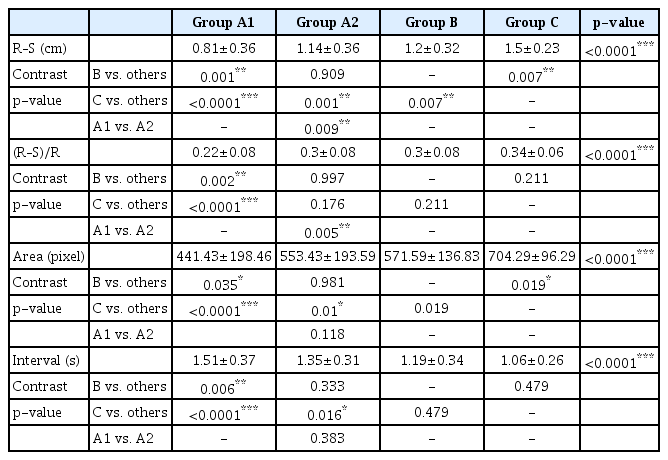
Comparison of ultrasonographic findings in groups A1, A2, B, and C
The mean R–S/R was 0.22±0.08 in group A1; 0.3±0.08 in group A2; 0.3±0.08 in group B; and 0.34±0.06 in group C. There was a significant difference between R–S/R for groups A1 and A2 (p=0.005); groups A1 and B (p=0.002); and groups A1 and C (p<0.0001).
The Areas drawn by the trajectories of hyoid bone movement were 441.43±198.46 pixels in group A1; and 553.43±193.59 pixels in group A2. For group B, the Area was 571.59±136.83 pixels and 704.29±96.29 pixels in group C. There was a statistically significant difference among groups A1, B, and C (p<0.05).
The Interval to the shortest hyoid−mandible approximation was 1.51±0.37 seconds for group A1, 1.35±0.31 seconds for group A2. It was 1.19±0.34 seconds for group B, and 1.06±0.26 seconds for group C.
Fig. 4 shows that R–S, R–S/R, and Area were restored back to the level of group B, when NGT was removed from the patients in group A.
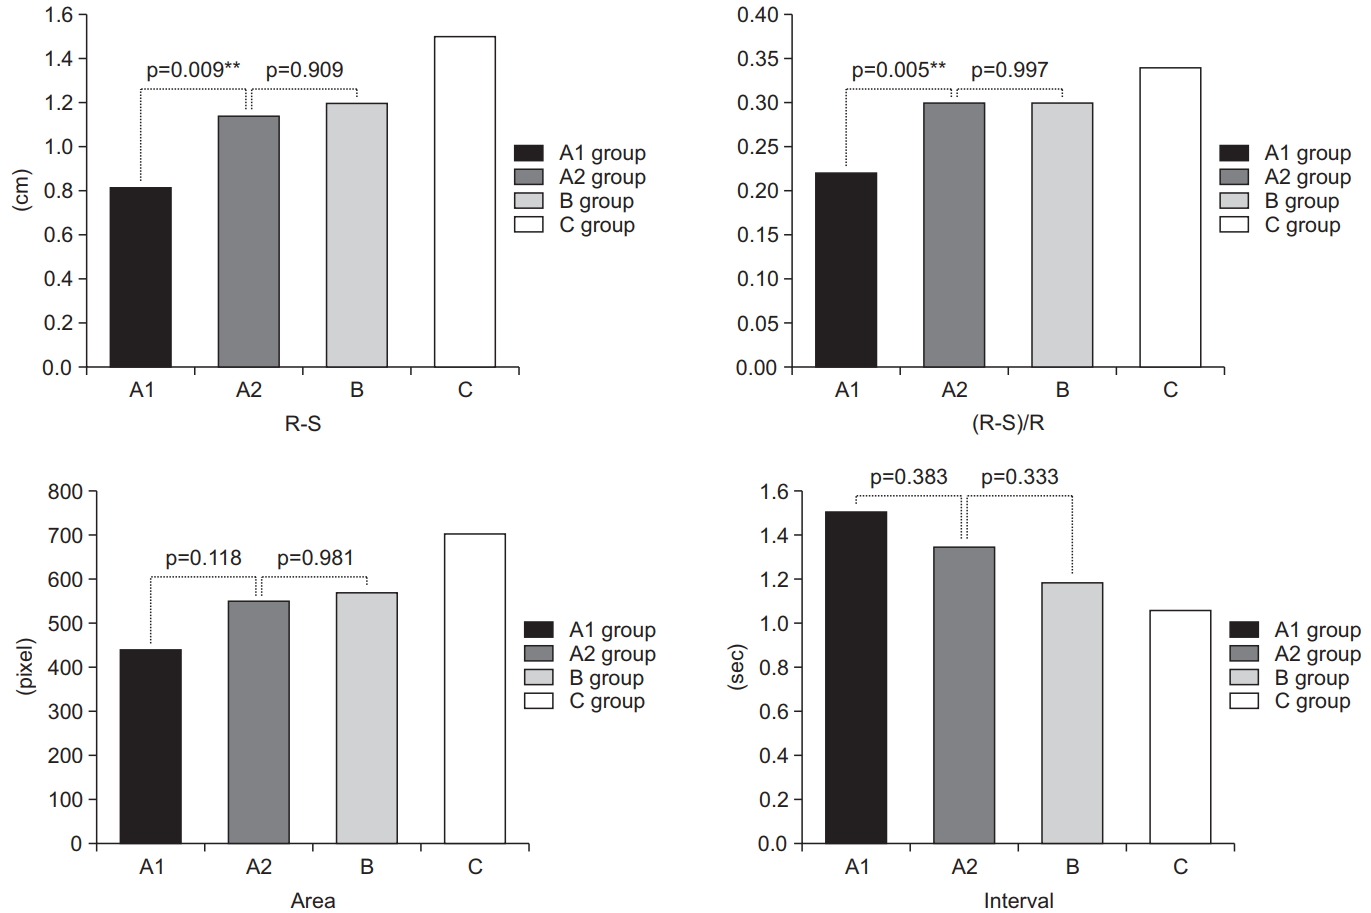
Comparison of ultrasonographic findings in groups A1, A2, B, and C. R–S indicates the value calculated by deducting the short distance between the mandible and hyoid bone from the rest distance (the length of the hyoid bone movement); Area, the range of the hyoid bone movement depicted; Interval, time interval between the initiation of hyoid bone movement and the shortest distance of hyoid-mandible approximation.
DISCUSSION
Stroke is among the top-three causes of mortality in Korea, and is the top cause of death among elderly individuals over 60 years of age [13]. Early in the course of the disease, there is a loss of consciousness or functional weakness, but even after recovery, patients suffer from many functional impairments, including dysphagia [1,2,14]. If NGT, for the purposes of treating dysphagia, remain inserted for a long duration [6], it results in excess mucus secretion, increasing the risk of esophagitis due to gastroesophageal reflux disease or aspiration pneumonia [3,4]. Therefore, evaluating swallowing ability is necessary to decrease the insertion period and incident rate of these complications.
According to Huggins et al. [15], an inserted NGT disrupts the hyoid bone movement and affects the swallowing speed. The study included 10 young normal adults 20 to 27 years old to evaluate the effect of NGT when swallowing 5 mL of water by using VFSS. The reduced swallowing speed was attributed to two factors, earlier hyolaryngeal elevation and longer upper esophageal sphincter (UES) opening. In a normal pharyngeal response, hyolaryngeal excursion pulls the cricoid lamina away from the posterior pharyngeal wall and opens the UES before a bolus arrives, which makes the superior and anterior hyoid bone movements and UES open [16,17]. However, the NGT causes partial obstruction of UES and slows bolus flow, which increases the duration of sphincter opening, resulting in prolonged hyoid bone elevation to maintain UES displacement [16]. Thus, extended duration of pharyngeal response is due to earlier hyolaryngeal elevation and prolonged hyoid excursion.
Hyoid bone movement in the presence of an NGT has not yet been investigated quantitatively by US to date. It represents a new and advantageous technique for assessing dysphagia, and is noninvasive, lacks the need for radiation, and is acceptable for bedridden patients as well. Furthermore, it allows visualization of the anatomic structure of the tongue and dynamic motion of the hyoid bone [18]. The focus of US-based dysphagia studies has shifted from investigating tongue movement to evaluating hyoid bone displacement, quantitatively and dynamically [10,19-22]. According to Kuhl et al. [23], it is possible to identify laryngeal elevation after hyoid bone movement by evaluating the approximate distance between the hyoid bone and mandible bone. Following this notion, several studies on hyoid−mandible approximation in stroke patients have revealed that it was lower in stroke patients with dysphagia than in those without. This is due to the weakness of pharyngeal and laryngeal muscles, and reduced hyoid bone movement, when the corticobulbar fibers, the medullary solitary tract nucleus, and the nucleus ambiguous structures, were affected by stroke [10,19]. The present study revealed that NGT insertion in the presence of stroke increases the risk of aspiration pneumonia because it weakens the integrity of the upper and lower esophageal sphincters, causes more frequent relaxation of the lower esophageal sphincter, and desensitizes the pharyngo-glottal adduction reflex [24,25]. However, the effect of NGT on dysphagia has not been investigated by both US and computer-based assessments of the hyoid bone movement in stroke patients. Therefore, this study focused on evaluating dysphagia by means of US and computer-based assessments of the hyoid bone movement in patients with an NGT after stroke and makes new contributions to the field.
The baseline characteristics of this study population are shown on Table 1. There was a significant difference in MBI scores and MMSE scores (both p<0.0001), which can be explained by effects of the brain lesion. The differences in distances at rest between the mandible and the hyoid bone can be explained by two hypotheses: (1) a stroke in the corticobulbar fibers, the medullary solitary tract nucleus, and nucleus ambiguous structures induces weakness of pharyngeal and laryngeal muscles [10,19], or (2) there are individual anatomical variations in height.
We found that R–S, R–S/R, and Area were restored back to the level of group B (stroke patients control group) with statistical significance when the NGT was removed from the patients in group A (stroke patients experimental group). Also in group A, the duration of stroke was longer than that of group B and was statistically significant. This means the stroke patients with NGT requiring long-term tube feeding were enrolled in group A. Group A patients should have had PEG instead of NGT. NGTs are commonly preferred by caregivers. In terms of restoring of the movement of hyoid bone after removing the NGT, group A should have received PEG to prevent aspiration due to saliva. This result supports the previous studies which demonstrate PEG instead of NGT should be considered early for long-term use in stroke patients [26].
The interval between the beginning of the hyoid bone movement and the time of the shortest hyoid−mandible approximation in group A2 was shorter than that in group A1 though not statistically significant and was similar to those of group B.
The trajectory area of the hyoid bone movement can reflect the normal movement of the hyoid bone. During the swallowing cycle, normal hyoid bone movement first exhibits forward-upward movements, pauses at the maximal displacement location potential, and then exhibits backward-downward movement. At this time, the movement of the hypoid bone is not a one-dimensional movement, but a two-dimensional (2D) fusiform motion. In stroke patients, the trajectory shows a linear movement without showing the 2D movement of the fusiform shape and movement of the hyoid bone and rotation of the epiglottis show an uncoordinated pattern [27]. It can be deduced that the 2D movement of the hyoid bone, that is, the trajectory area of the hyoid bone movement, affects swallowing in association with the rotation angle of the epiglottis.
The range of the hyoid bone motion is easier to measure as a 2D image in 0.01 ms units of time under a computerbased assessment system than by measuring the length of hyoid−mandible approximation without computer software. Among its advantages, a computer-based assessment can also avoid errors where the measured R–S/R value was smaller than the actual range of hyoid bone movement. Given that US has less space−time constraints than VFSS, it is also easy to follow up on the dysphagia function in patients receiving NGT feeding, and obtain more objective data from the R–S/R and Area. Time measurements are more accurately facilitated by computerbased assessments of hyoid bone movement.
This study has some limitations. First, the sample size for the NGT group was small. Second, because it is not possible to perform VFSS when an NGT is inserted, comparison with US was not possible. Third, because of the limited number of patients this study was performed collectively without classifying such characteristics as: the causal diseases of dysphagia, or the patients with stroke grouped based on location of the lesion. Fourth, this study included data only from a 1 mL bolus volume swallowing to simulate a saliva swallow, so further studies could investigate larger volumes such as 10−20 mL that simulate normal bolus size as well.
In conclusion, NGT interferes with the movement of the hyoid bone during swallowing 1 mL of water in stroke patients and it is restored after removing NGT. In the case of the stroke patients requiring tube feeding for a long time, the adverse effects of NGT on swallowing function should be considered.
Notes
No potential conflicts of interest relevant to this article were reported.