Effects of Electric Cortical Stimulation (ECS) and Transcranial Direct Current Stimulation (tDCS) on Rats With a Traumatic Brain Injury
Article information

Abstract
Objective
To evaluate the effects of electric cortical stimulation (ECS) and transcranial direct current stimulation (tDCS) on motor and cognitive function recovery and brain plasticity in focal traumatic brain injury (TBI) of rats model.
Methods
Forty rats were pre-trained to perform a single pellet reaching task (SPRT), rotarod test (RRT), and Y-maze test for 14 days, then a focal TBI was induced by a weight drop model on the motor cortex. All rats were randomly assigned to one of the three groups: anodal ECS (50 Hz and 194 μs) (ECS group), tDCS (0.1 mA, 50 Hz and 200 μs) (tDCS group), and no stimulation as a control group. Four-week stimulation, including rehabilitation, was started 3 days after the operation. SPRT, RRT, and Y-maze were measured from day 1 to day 28 after the TBI was induced. Histopathological and immunohistochemistry staining evaluations were performed at 4 weeks.
Results
SPRT was improved from day 7 to day 26 in ECS, and from day 8 to day 26 in tDCS compared to the control group (p<0.05). SPRT of ECS group was significantly improved on days 3, 8, 9, and 17 compared to the tDCS group. Y-maze was improved from day 8 to day 16 in ECS, and on days 6, 12, and 16 in the tDCS group compared to the control group (p<0.05). Y-maze of the ECS group was significantly improved on day 9 to day 15 compared to the tDCS group. The c-Fos protein expression was better in the ECS group and the tDCS group compared to the control group.
Conclusion
Electric stimulation in rats modified with a focal TBI is effective for motor recovery and brain plasticity. ECS induced faster behavioral and cognitive improvements compared to tDCS during the recovery period of rats with a focal TBI.
INTRODUCTION
The number of patients with traumatic brain injuries (TBI) is currently increasing because of increased accidents, such as traffic accidents, industrial accidents, and sports injuries. Recovery of various functions occurs from cerebral reorganization after the injury. This capacity for reorganization of the brain is referred to as ‘neuroplasticity’. Recently, neuromodulation therapy, which induces brain plasticity through electric or magnetic stimulation, has received considerable attention.
Methods employed in neuromodulation therapy include the use of electricity to stimulate the cortex, such as electric cortical stimulation (ECS) and transcranial direct current stimulation (tDCS). For ECS, electric stimulation is applied through a small thin-membrane electrode that is inserted into the epidural or subdural space following a craniotomy. Although this method is an invasive procedure that requires general anesthesia, it allows for continuous and selective stimulation of a specific brain area by fixing the electrode on a specific domain of the cerebral cortex and can be easily applied alongside rehabilitation therapy [1]. The tDCS is a non-invasive method, since the electrode is placed on the scalp to allow a weak current to flow across the cerebral cortex. The equipment used is portable, inexpensive, and can be applied concurrently with rehabilitation therapy. However, it is difficult to selectively stimulate a limited area of the brain, and most of the stimulating energy is lost as it passes through various layers of the head, such as the scalp, cranial, and meningeal layers [1,2].
Many studies have applied one of these neuromodulation therapies to uninjured adults or patients with stroke to improve motor function, unilateral neglect, or working memory [3-8]. However, animal experiments and clinical trials that have investigated their applications in TBI are very rare. Although the pathophysiology of TBI differs from that of ischemic stroke, which occurs in blood vessels, however, neuromodulation therapy which is influences neuroplasticity also affect the brains injured by trauma, the studies on its effects in TBI are needed. Accordingly, we made a rat model with focal brain injury, in which the motor area was targeted for concomitant rehabilitation training with ECS or tDCS for 4 weeks to investigate their effects on functional recovery and neuronal activities.
MATERIALS AND METHODS
Subjects
All experimental procedures were conducted according to the NIH Guide for the Care and Use of Laboratory Animals [9]. Thirty Sprague–Dawley male rats (Samtako BioKorea, Daejeon, Korea) that were eight-weeks old weighing 270–285 g were randomly divided into three experimental groups: (1) the ECS group (n=10), (2) the tDCS group (n=10); and (3) the control group (n=10). In the control group, a TBI was induced using the same methods applied to the other groups and only the rehabilitation training was performed without any additional treatment.
Induction of the TBI to the rats
Rats were anesthetized through an intramuscular injection of tiletamine hydrochloride (60 mg/kg) into the thigh muscle and fixed to the prone position with a stereotaxic instrument (Model 900 Small Animal Stereotaxic Instrument; David Kopf Instruments, Tujunga, CA, USA). A Homeothermic pad (Homeothermic Blanket System; Harvard Apparatus Ltd., Edenbridge, Kent, UK) maintained the body temperature at 37.0°C±0.5°C. For inducing the brain injury, we applied the weight drop model instrument modified by Feeney et al. [10], adapting the method of Ducker [11] to induce a spinal cord injury. The protocol we followed was suggested by Yoon et al. [12] for inducing a moderate brain injury in rats (Fig. 1). The impact point was 1.0 mm anterior and 3.0 mm lateral to the bregma, which was the contralateral side of the dominant forelimb referred to on a rat brain map [13]. Above the impact point, an incision of 2.5 cm on the scalp was cut and after a circular craniotomy (d=3 mm) the dura mater was dissected and the cortical impact lesion was induced by dropping a round piece of brass with cross-sectional diameter of 2 mm onto the rat’s brain.
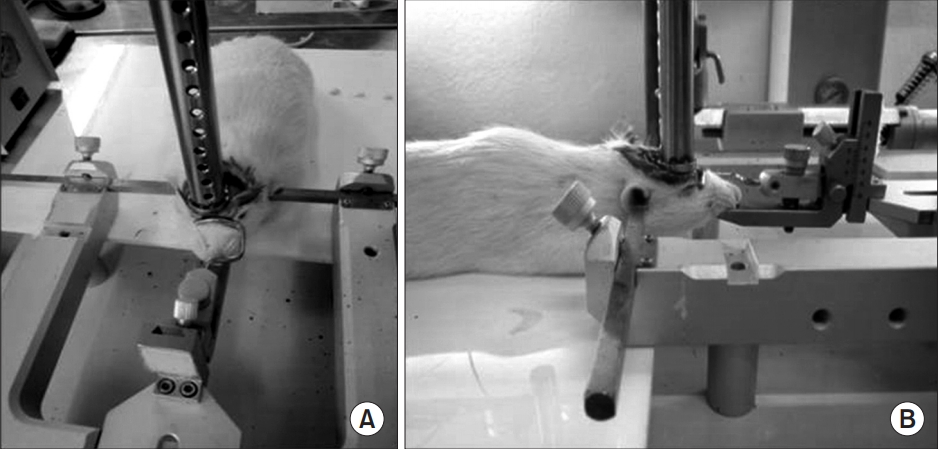
(A) The guided tube was kept at a 90° angle to the bottom and was perforated every 1 cm interval to prevent air compression in the tube. (B) A falling object is released directly onto the exposed dura.
ECS
The electrode implantation method for cortical stimulation was followed from Yang et al. [14] and Yoon et al. [12] (Fig. 2A–2C). A 3-mm diameter round bipolar stimulating electrode, made of stainless steel (Oscor Inc., Tampa, FL, USA), was inserted to the anterior margin of the target site. The electrode and swivel conductor were connected by wires and this line was connected to the electric stimulator (HSRG Neuro; Cybermedic, Iksan, Korea). The stimulation intensity was set to a voltage equivalent of 50% of the movement threshold [14]. Monophasic, pulse wave, and anodal currents were used, and the stimulation frequency was 50 Hz with pulse duration of 194 μs for 24 hours a day from days 3 to 28 after inserting the electrode.
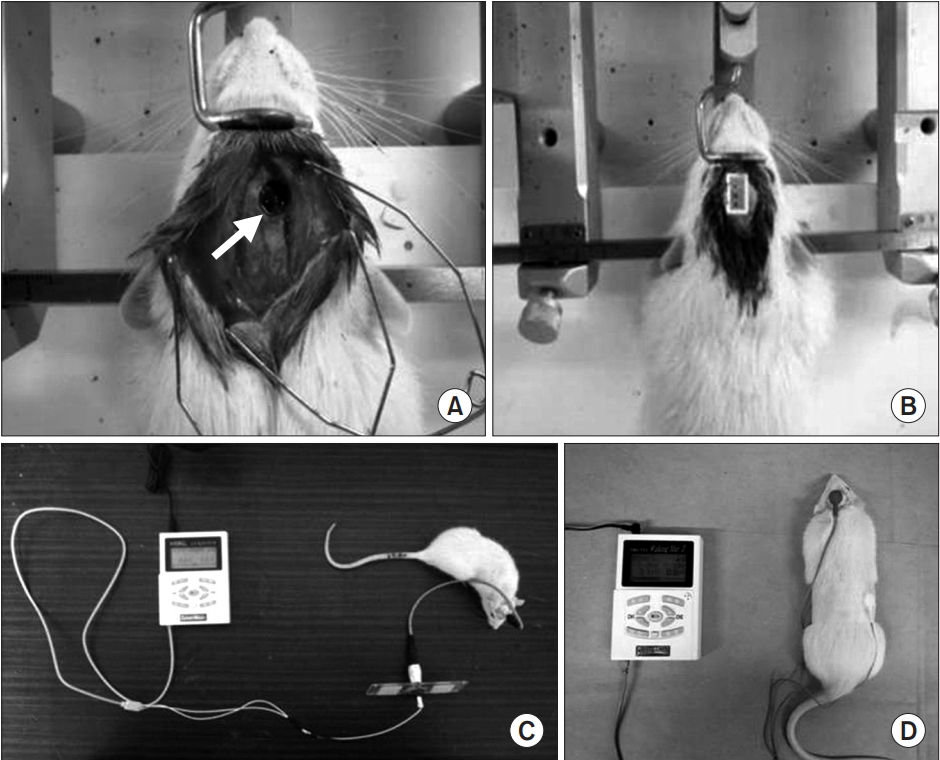
Electric stimulation device application. (A) Circular injured lesion (arrow) in the right motor cortex of rat. (B) Implantation of stimulation electrode over the right hemisphere and (C) connection of stimulator and electrode in traumatic brain-injured rat model. (D) Transcranial current stimulation onto the brain of rat with focal traumatic brain injury.
tDCS
A rubber electric stimulation pad (HUREV, Wonju, Korea) 1 cm in diameter custom-made for tDCS was used, and the anodal pad was fixed on the skin above the lesion with dental filler (CharmFil Flow; Dentkist Inc., Gunpo, Korea) to cover the entire brain injury site. The cathodal pad was attached to the trunk and surrounded by sellotape to avoid displacement. Electric stimulation was applied using a custom-made electric stimulator (Cybermedic), with an intensity of 0.1 mA and pulse duration of 200 μs at 50 Hz for 30 minutes a day from days 3 to 28 after electrode positioning. Since cortical excitability can persist for 90 minutes after simulation in tDCS [15], the SPRT, RRT, and Y-maze were performed 1 hour after electric stimulation (Fig. 2D).
Rehabilitation training
All rats underwent SPRT, RRT, and Y-maze training from 14 days prior to 1 day prior to brain injury induction. After TBI induction, SPRT training was performed once every morning and afternoon, and RRT training was performed three times every morning and afternoon. A Y-maze test was performed once a day in the afternoon.
SPRT
The SPRT was performed according to the method suggested by Vergara-Aragon et al. [16]. After a period of acclimatization to a 45 mg sucrose single pellet (Bio-Serv Inc., Frenchtown, NJ, USA), 20 pellets were supplied within 20 minutes in the morning and afternoon. Since stimulation was applied for 24 hours in the ECS group, a functional assessment-stimulation box produced by Yoon et al. [12] was used in all groups to enable simultaneous electric stimulation and SPRT training (Fig. 3).
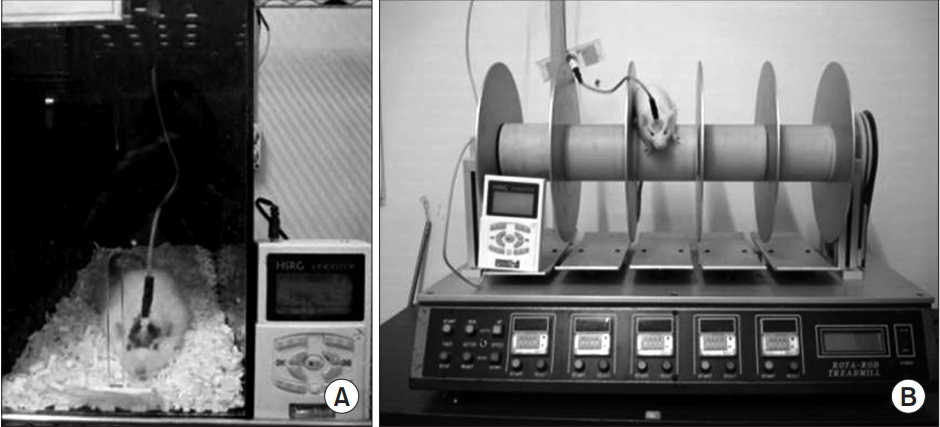
(A) Single pellet reaching task with electric cortical stimulation and (B) rotarod test with electric cortical stimulation.
RRT
Rotarod training was performed to improve sensorimotor integration according to Hunter et al. [17]. The rotational speed of the cylinder increased gradually by 1 rpm every 2 seconds up to a maximum speed of 60 rpm, and the training period was set to a maximum of 5 minutes. The floor was equipped with a sensor that responded to the rat’s weight, so that the cylinder stopped automatically if the rat fell (Fig. 3).
Y-maze
A Y-maze was performed based on the method by Dellu et al. [18] using black Plexiglas material, poly(methyl methacrylate). Three independent arms of the same size (40×12×35 cm3) were connected at a 120° angle to form a ‘Y’ shape. The assessment followed the protocol suggested by Conrad et al. [19]. The rat was allowed to freely move between the ‘start’ and ‘target’ arms for 30 minutes. When the rat was not moving, pellets were used to lure the rat to the ‘target’ arm for memory training. The assessment involved 15 minutes of memory training and spatial memory storage. The rat was provided rest for 2 hours in the cage; then, it was placed on the ‘start’ arm to assess whether it reached the target direction (the end of the ‘target’ arm). This procedure was repeated five times and assessed accordingly. A 1-minute interval was given between each attempt, during which the inside of the Ymaze was cleaned and ventilated to reduce the possibility of the rat following a scent trail in the target direction (Fig. 4).
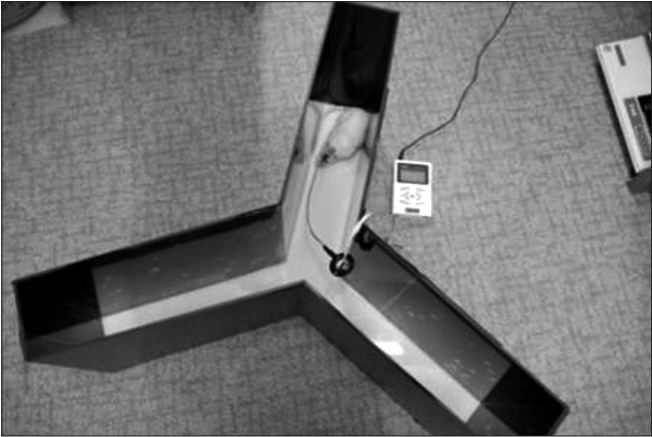
Y-maze test with electric cortical stimulation.
Assessments
Assessments were made as a percentage of the standard values. For comparison of baseline values, the mean value of 3 days prior to brain injury induction was used as a percentage of the standard value. For SPRT and RRT, the values measured from afternoon training were used as functional assessment scores.
Neurological examination
To compare the degree of injury immediately after brain injury induction, we applied a method for motor and sensory function evaluation in a cerebral infarction rat model suggested by Garcia et al. [20]. In a neurological examination by Garcia et al. [20], rats with scores of ≥12 points were excluded from the study, since they were judged to have not sustained a lesion equivalent to moderate or greater brain injury.
SPRT
The number of times a pellet was accurately taken to the mouth and consumed was defined as an execution count, and assessment was defined as the percentage of average execution counts per 20 attempts.
RRT
The average execution time from 3 days prior to brain damage induction was compared to the average execution time after the injury and this percentage was defined as the execution rate.
Y-maze
Assessment was defined as the percentage of times the rat reached the target direction out of 5 attempts.
Histopathological examination
After completing the 4 week experiment, experimental animals were anesthetized by injecting their thigh muscle with Zoletil, and tissues were fixed via transcardial perfusion. After perfusion fixation, extracted brains were fixed at 4°C for 12 hours in 4% paraformaldehyde fixation solution followed by a 10% formalin solution. The tissue was submerged over 12 hours for fixation through dehydration. Fixed brain tissue was sectioned using a cryostat, creating 40 μm thick coronal sections. Sections were placed on poly-L-lysine-coated slides and hematoxylineosin (H&E) staining was performed. An optical microscope was used to make pathological observations while going from low magnification to high.
Immunohistochemistry
For selection of the cortical region for immunostaining, the coronal surface of the brain tissue at 4 mm range anterior and posterior to the center of the lesion was used. Immunostaining was performed on the 4 μm section of interest. Immunohistochemistry analysis of c-Fos was performed using Bond-Max auto-stainer (Leica Biosystems, Wetzlar, Germamu), following the manufacturer’s instructions. A trained pathologist with no knowledge of the experimental details made observations of the whole brain sections. After establishing the area of interest under an optical microscope at 100× magnification, lesions were compared across the three groups by comparing the lesion and uninjured sides with emphasis on the motor area.
Statistical analysis
SPSS version 14.0 (SPSS Inc., Chicago, IL, USA) was used for data analysis. Analysis of variance (ANOVA) was done to confirm behavioral and cognitive tests score homogeneities (Garcia neurologic examination, SPRT, RRT, and Y-maze) before the brain injuries in the three groups. Improvement in SPRT, RRT, and Y-maze scores were analyzed with repeated-measure ANOVAs. One-way ANOVA with Scheffe post-hoc test and Bonferroni correction was applied to evaluate difference among the three groups at each time point. A p-value less than 0.05 was considered significant in one-way ANOVAs and measured values were displayed as mean±standard deviation.
RESULTS
Confirmation of the TBI lesion
At postoperative day 1, total scores from the Garcia neurologic examination in the ECS, tDCS, and control groups were 3.4±0.5, 3.3±0.6, and 3.3±0.4, respectively. The results indicated that there were no significant differences among the groups.
Behavioral and cognitive tests
SPRT success rates prior to brain injury were not significantly different among the three groups (p>0.05). In SPRT, there was a significant interaction of group and time (p<0.001, repeated-measures ANOVA). The ECS group showed significant improvement in SPRT compared with the control group from day 7 to day 26 (p<0.05 respectively, one-way ANOVA with Scheffe post-hoc test and Bonferroni correction) and with the tDCS group on days 3, 8, 9, and 17 (p<0.05 respectively, one-way ANOVA with Scheffe post-hoc test and Bonferroni correction). The tDCS group showed significant improvement in SPRT compared with the control group from days 8 to day 26 (p<0.05, one-way ANOVA with Scheffe post-hoc test and Bonferroni correction) (Fig. 5). There were no significant differences in mean Y-maze success rates among the three groups prior to brain injury (p>0.05). A significant interaction of group and time was shown in Ymaze scores (p<0.001, repeated-measures ANOVA). The ECS group showed significant improvement in its Y-maze score compared with the control group from day 8 to day 16 (p<0.05 respectively, one-way ANOVA with Scheffe post-hoc test and Bonferroni correction) and with the tDCS group on days 9 to day 15 (p<0.05 respectively, oneway ANOVA with Scheffe post-hoc test and Bonferroni correction). The tDCS group showed significant improvement in the Y-maze compared with the control group on days 6, 12, and 16 (p<0.05, one-way ANOVA with Scheffe post-hoc test and Bonferroni correction) (Fig. 6). However, there was no significant interaction of group and time in the RRT, just a significant difference in terms of time (p>0.05 and p<0.001, respectively; repeated-measures ANOVA) (Fig. 7).
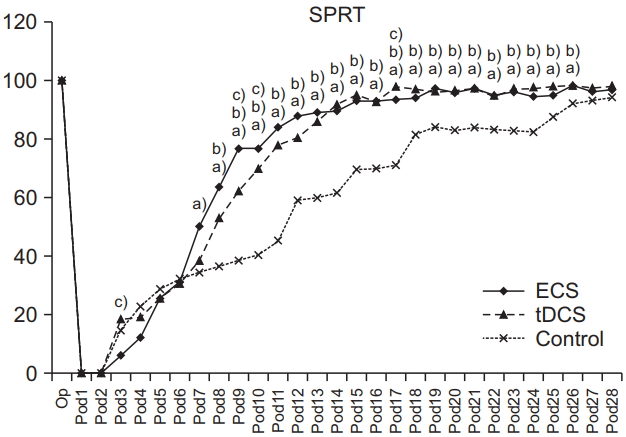
The success rates of SPRT in ECS, tDCS, and control groups. The success rate was higher from day 7 or 8 to day 26 in ECS and tDCS compared to that of control group. Note that the success rate of SPRT in ECS group was significantly lower than those of tDCS groups on day 3 and significantly increasing compared with other groups from day 8 to day 9, and day 17. SPRT, single pellet reaching task; ECS, electric cortical stimulation; tDCS, transcranial direct current stimulation. One-way ANOVA with Scheffe post-hoc test and Bonferroni correction after repeated measures ANOVA. a)p<0.05 by one-way ANOVA between ECS and control groups on day 7–26. b)p<0.05 by one-way ANOVA between tDCS and control groups on days 8–26. c)p<0.05 by one-way ANOVA between ECS and tDCS groups on days 3, 8, 9, 17.
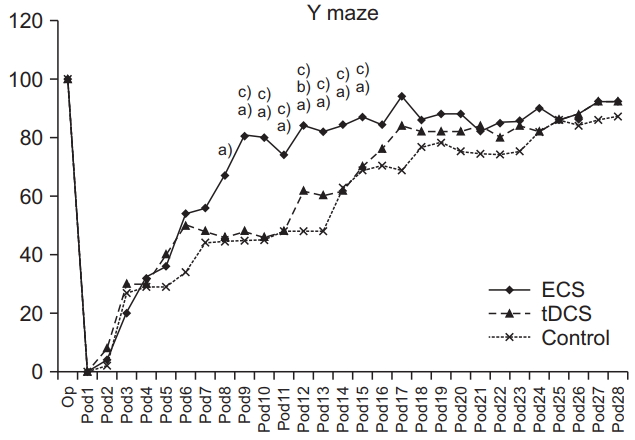
The success rates of the Y-maze test in ECS, tDCS, and control groups. Success rates of ECS groups were higher from day 9 to day 15 than that of tDCS and from day 8 to day 16 than that of the control group. On days 6, 12, and 16, the tDCS was significantly higher compared with the control group. ECS, electric cortical stimulation; tDCS, transcranial direct current stimulation. One-way ANOVA with Scheffe post-hoc test and Bonferroni correction after repeated measures ANOVA. a)p<0.05 by oneway ANOVA between ECS and control groups on days 8–16. b)p<0.05 by one-way ANOVA between tDCS and control groups on days 6, 12, and 16. c)p<0.05 by one-way ANOVA between ECS and tDCS groups on days 9–15.
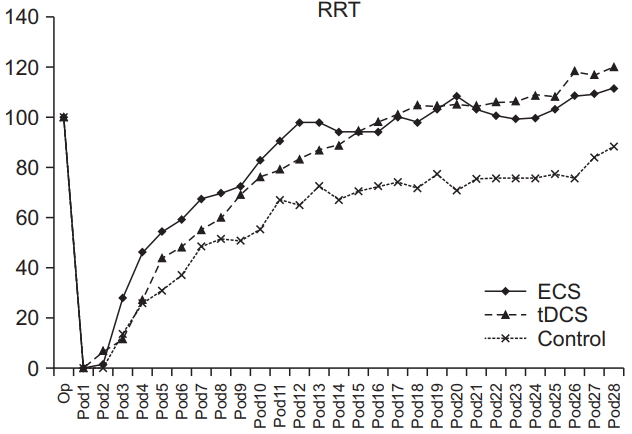
The average rates of RRT in ECS, tDCS, and control groups. The average time of RRT of three groups were no significant difference in terms of group×time, but a significant difference in time in each group. RRT, rotarod test; ECS, electric cortical stimulation; tDCS, transcranial direct current stimulation.
Histopathological staining
Lesions were found in brain tissues extracted from all three groups. Varying degrees of bleeding, coagulation necrosis, cystic changes inside necrotic tissues, infiltration by inflammatory cells, pyknosis, and vacuolization from degeneration of the nucleus were also observed in the brain injury target site, which included the motor area of the front paw and nearby regions (Fig. 8).
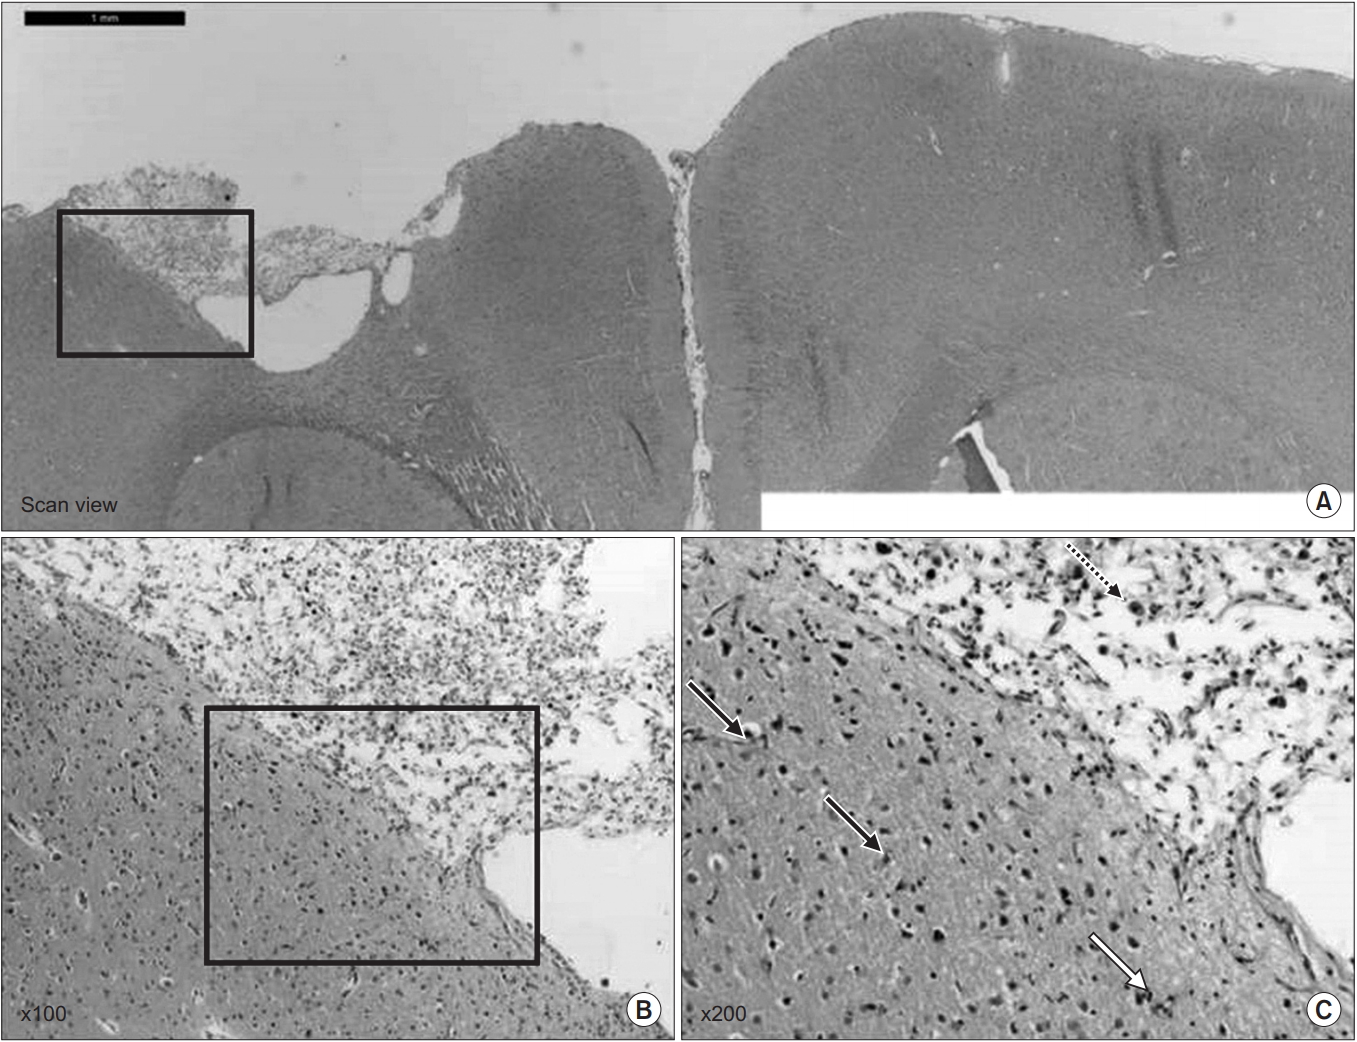
(A) The hematoxylin-eosin (H&E) staining showed the traumatic injured area of the affected hemisphere. (B) Note lots of dead cells that have a pyknotic nucleus throughout the brain parenchyme and large cavity that involved the cortex at the site of injury (H&E, ×100); and (C) the pyknotic nucleus-dead cells (black arrow) and vacuolated nucleus (blue arrow) in the brain cell after the traumatic brain injury (H&E, ×200).
Immunohistochemical findings
Brain tissue from all three groups showed an expression of c-Fos in the cortical region where the injury was induced. The region near the injured motor area, where c-Fos expression was clear, was observed at 100× magnification; the two electrically stimulated groups displayed greater levels of c-Fos expression than in the control group. In the two groups that received electric stimulation, the area of the legion showed higher c-Fos expression levels than the uninjured side of the brain (Fig. 9).
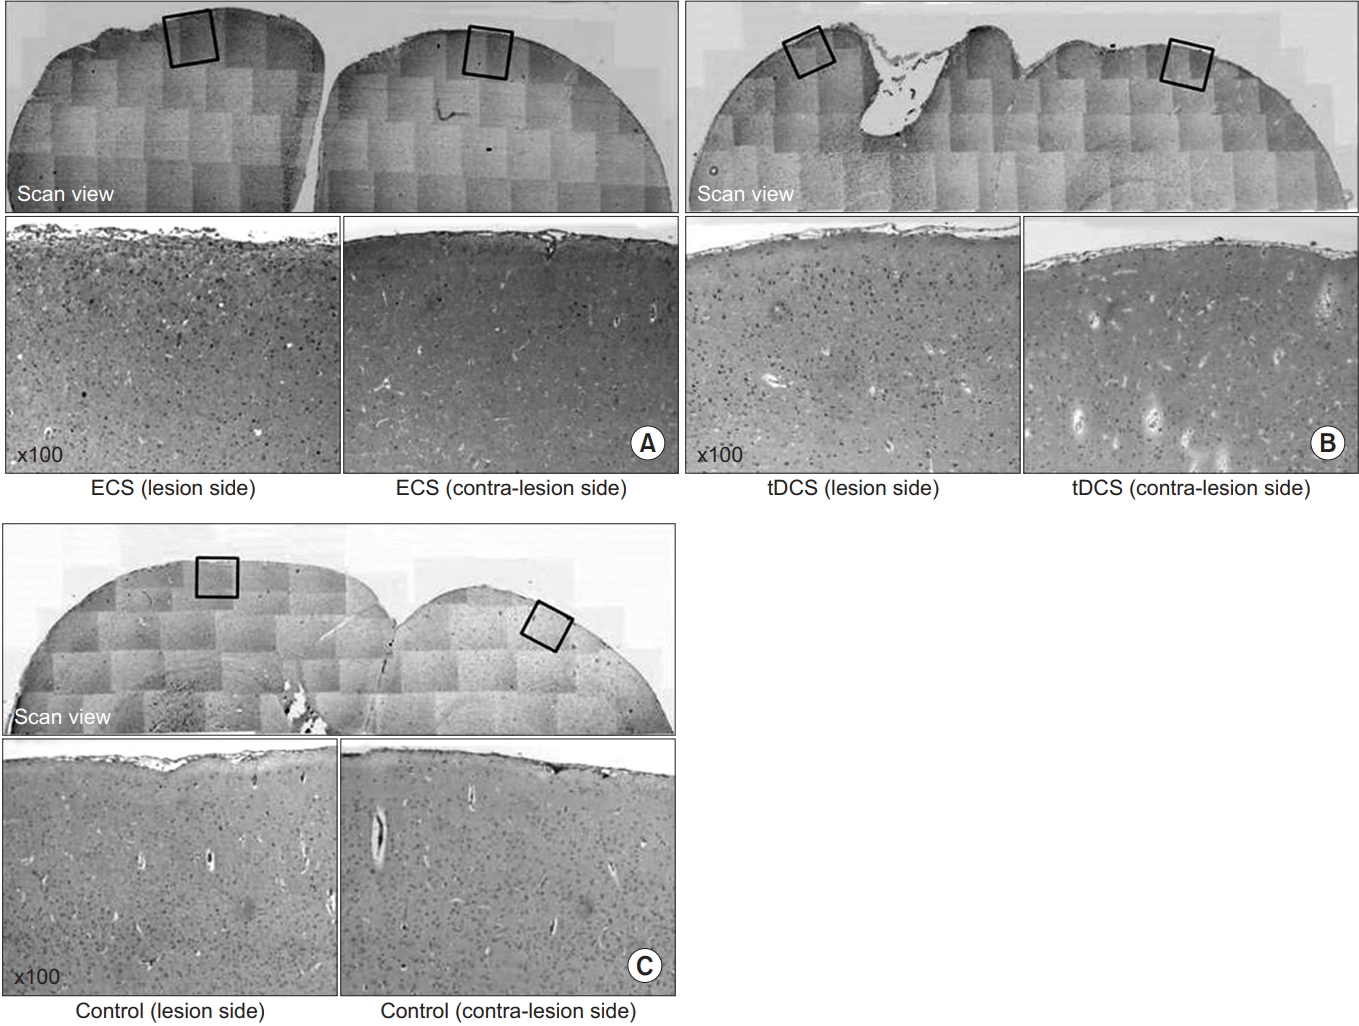
Immunohistochemistry staining for c-Fos protein in the cerebral cortex of the lesion side and contra-lateral side for the ECS group (A), the tDCS group (B), and the control group (C). In (A), note the increase of c-Fos expression in the both cerebral cortex and much more increased in the lesion side. In (B), note the increase of c-Fos expression in the both cerebral cortex and much more increased in the lesion side. In (C), there are a few c-Fos expressed in the cerebral cortex of both sides. ECS, electric cortical stimulation; tDCS, transcranial direct current stimulation.
Adverse events during experiment
When electric stimulation was applied, neither muscle contracture nor motor abnormalities in the head or limbs occurred. Six rats in the ECS group were dismissed because wires separated from their electrodes, and another experiment was conducted as a result with six additional rats.
DISCUSSION
ECS improves neural functions by inducing neurophysiological changes in the area near the injury site, as reported in several studies [5,21-26]. Based on various studies that report stimulation parameters currently used for ECS [4,27-29], the present study selected 50 Hz anodal continuous current stimulation with monophasic pulse waveform.
The tDCS changes the cortical excitability by modulating the cell membrane, and it has cytoprotective effects [30] in nerve cell axons by regulating activity of the NMDA receptor [31] while also promoting neuroplasticity [32]. Since tDCS has not been studied in a rat TBI model, the present study selected a tDCS of 0.1 mA based on protocols in rat models of cerebral infarction [33] and Alzheimer disease [34].
In previous studies that have examined the effects of ECS or tDCS in brain injury-induced rat models, the study period was usually 2 weeks or less [5,12,14,26]. Although these studies reported significant differences between the experimental and control groups, some of the studies were terminated during the recovery phase. In the present study, the observation period was 4 weeks, and differences in SPRT and Y-maze results between the electric stimulation and control groups lasted up to 3 weeks. Therefore, a period of at least 3 weeks will be required when making comparisons between treatment methods in similar future studies.
SPRT values were significantly lower in the ECS group than the tDCS group 3 days after injury that may be because the intensity of electric stimulation, which was stronger in ECS than tDCS, and had a negative effect in early stage of brain injury. In a report that studied the appropriate time for applying tDCS after cerebral infarction [32], cognitive function and sensory motor performance were better in the late tDCS group than the early tDCS group. Additionally, immunostaining revealed that axon regeneration and cortical rearrangement occurred in the late application group because of increased neuroplasticity on the lesion side and the uninjured side, which did not occur in the early application group. Yoon et al. [32] reported that this was because astrocytes, which are activated immediately after brain injury, interfere with axon regeneration that is induced by electric stimulation. Another reason may be that an additional 1 hour of surgery was required to insert the electrode, and additional micro-trauma may have occurred despite the surgery being performed by an experienced researcher. The ECS group displayed faster improvement than the tDCS group on days 8, 9, and 17; we interpret that stimulation with appropriate strong intensity after very early stage is contributed to early achievement of lost function during recovery period.
The ECS group had significantly higher scores than the other groups in the Y-maze from day 9 to day 15, and the tDCS group had significantly higher scores than the control group on days 6, 12, and 16. Considering the slope of the recovery curve showed a rapidly increasing trend, since the Y-maze execution rate was calculated with the reference value for the assessment and set to 5 points. This is consistent with results from another study that reported an improvement in working memory from applying tDCS in a rat cerebral infarction model [35]. In the present study, the primary motor area of the front paw was the target location for injury induction, but the actual injury site may have been wider due to the mechanism of injury. HE staining 4 weeks after injury confirmed an injury site that expanded radially. According to the brain map published by Lacroix et al. [36], the area covering 4 mm anterior and 1 mm lateral to the vestibule, which encompasses the injured area in the present study, contains the medial prefrontal cortex. Therefore, cognitive functions, including spatial memory and learning ability, may have been damaged [36,37]. The ECS group had better recovery of spatial memory compared to the tDCS group. This difference may be due to the intensity of the electric stimulation applied to the lesion area in the tDCS group that was relatively lower and could cause a wider electrode area though stimulation was applied selectively to the motor cortex and the frontal lobe in both groups. Considering the proportional relationship between the effects of ECS and tDCS stimulation intensity reported in a previous study [35], future studies should apply stronger stimulation intensities and compare results.
Unlike the SPRT or Y-maze, in which performance increases are limited because of how the assessment is made, the RRT has an upper time limit of 5 minutes, which allows for continuously increasing performance values during repetitive training. Although there was no statistical difference in terms of group and time, we found a significant difference in time within each group and interpret the RRT result graph in relation to other performance tests in our results. The faster recoveries observed in the early stages of treatment in the two non-control groups that received electric stimulation is consistent with results from other assessment tools. In addition, this difference lasted until the latter stage of treatment on the RRT, suggesting that functional recovery was affected by electric stimulation continuously.
We interpret the differences of results between ECS and tDCS groups are related to selectivity, intensity and duration of electric stimulation that comes from the differences of stimulation for each method. Electric stimulation of ECS is more selective to the focal area than tDCS [1], thus the stronger intensity could be provided to the lesion site. In addition, this was applied during 24 hours continuously. According to previous studies, an appropriate intensity and longer duration of electric stimulation facilitates brain plasticity after injury more [29,35,38], therefore the ECS group had improved faster than tDCS group during the recovery period. Through further study for immunohistochemical findings of brain tissue on mid-term of recovery stage that showed obvious differences in cognitive and behavior tests, namely between the first and second weeks. The details could be investigated to provide more clarity.
The control group had gradual functional improvements, and did not show significant differences in performance from the other two groups after day 27 in the SPRT and day 16 in the Y-maze, suggesting that functional improvements can be expected from rehabilitation training alone. However, the recovery of the control group was significantly slower compared to that of the groups that received electric stimulation. Since this difference was sustained in the RRT, which does not have an upper limit of assessment, application of electric stimulation concomitant with rehabilitative intervention after brain injury can have continued therapeutic significance. This is consistent with results from a previous study that showed that applying electric stimulation in a rat cerebral infarction model had additional or synchronization effects [23].
We also found that c-Fos is expressed more quickly and sensitively when an action potential is generated in excited neurons and is not expressed when neurons are inactive [39]. Thus, upregulation of c-Fos mRNA within neurons serves as an indicator of a recent increase in activity [40]. Immunohistochemistry results in the present study showed that c-Fos was expressed in all three brain injury groups. However, its expression on the side with the lesion was higher in the two groups that received electric stimulation compared to the control group. This indicates that electric stimulation concomitant with rehabilitation training increases brain activities. The groups that received electric stimulation, which had better functional assessment results, had higher levels of c-Fos expression on the uninjured side compared to the control group. We believe that this is because electric stimulation applied to the lesion affects neural activity on the uninjured side to modulate neuroplasticity in a positive manner; this is consistent with results from other studies that involved immunostaining on rat cerebral infarction or brain injury models after electric or auto-stimulation [12,32].
One limitation of the present study is that an appropriate protocol for applying electric stimulation to brain injury models, including TBI, is unavailable. The experimental protocol in the present study was based on a few preceding studies. However, this is not the most effective protocol for each treatment method used. Since the cranium was removed and direct force was applied to the brain to induce localized and moderate brain injury, typical conditions of TBI were not accurately reflected. In the future, it may be necessary to conduct studies using TBI models with localized and moderate brain injuries without removing the cranium by increasing the weight of the falling body.
An essential aspect of studying rehabilitation therapy is to identify the effects of neuromodulation treatment using electric stimulation on patients with TBI and expanding its applicability. In the present study, ECS and tDCS were applied in a localized TBI rat model to examine overall functional recovery and neural tissue activation. Their applicability as treatment models for brain injuries was confirmed. Moreover, by simultaneously comparing the effects of the two groups against the control group, the effects of each modes of stimulation and their advantages and disadvantages were identified. Also results important for long-term observations were also obtained in this study.
In conclusion, in the present study, when both rehabilitation training and electric stimulation were applied concurrently in a localized TBI-induced rat model, functional recovery was enhanced and neuronal activation was induced to a greater degree compared to rehabilitation training alone. ECS had poor outcome in motor function at the very early stage after focal TBI, however it induced faster behavioral and cognitive improvements than tDCS during the recovery period.
Notes
No potential conflict of interest relevant to this article was reported.