Effects of Very High Stimulation Frequency and Wide-Pulse Duration on Stimulated Force and Fatigue of Quadriceps in Healthy Participants
Article information

Abstract
Objective
To determine the effect of very high stimulation frequency (150 and 200 Hz) with wide pulse duration versus 50 Hz with wide pulse duration on stimulated force and fatigue of quadriceps femoris in healthy participants.
Methods
Thirty-four healthy participants underwent fatigue test using three stimulation frequency conditions (50, 150, and 200 Hz) with pulse duration of 0.9 ms. Normalized force values at the end of each fatigue protocol and curve fitting patterns were compared among stimulated frequencies.
Results
Very high stimulation frequency (150 and 200 Hz) conditions showed a trend of having more decline in normalized stimulated force during fatigue test compared to a low stimulation frequency at 50 Hz. However, the difference was not statistically significant. Responder group showed the same slope of a linear fitting pattern, implying the same pattern of muscle fatigue among three stimulation frequency conditions (−3.32 in 50 Hz, −2.88 in 150 Hz, and −3.14 in 200 Hz, respectively).
Conclusion
There were high inter-subject variations in the response to different frequency stimulation conditions. However, very high stimulation frequency generated the same fatigue pattern as the low stimulation frequency in the responder group. Further research is needed to explore the mechanism involved.
INTRODUCTION
Functional electrical stimulation (FES) has been used to promote functional movement or increase strength in individuals with upper motor neuron lesion [12] or in healthy participants [34]. For effective treatment, stimulated muscle force should be achieved at the required force level and duration. The use of optimal current parameters is essential in clinical treatment. Current amplitude, pulse duration (PD), and frequency are main parameters determining stimulation intensity and generating stimulated muscle force in electrical stimulation.
Many studies have reported that a higher stimulation frequency not only generates stronger muscle contraction, but also a rapidly increasing rate of muscle fatigue [5678]. However, most studies on humans have used a stimulation frequency of up to 100 Hz. It has been found that motor unit firing occurs at a very high frequencies (200–500 Hz) during the initial period of ballistic contraction in humans [9]. Christie and Kamen [10] have also reported motor unit frequencies of 116–714 Hz for a few pulses at the start of dynamic muscle contraction. These very high-tetanic frequencies could generate greater power in dynamic muscle contraction in an in situ study [11]. To the best of our knowledge, studies that determine muscle force and fatigue using a stimulation frequency of more than 100 Hz in humans have not been reported yet.
Several stimulation techniques have been proposed to induce asynchronous motor unit recruitment to delay muscle fatigue, including distributed stimulation [12] and using multi-pad electrodes [13]. Another new approach is to stimulate afferent fibers at a low intensity [14] to activate motor neurons via the spinal cord. This method may excite motor units via the Ia monosynaptic pathway [1516]. Dideriksen et al. [17] have stimulated the extensor carpi radialis longus via afferent nerve fibers using low-level current intensity with high-frequency (100 Hz). They found that temporal summation of excitatory postsynaptic potential (EPSP) in motor units and recruiting of different groups of motor units in response to each individual stimulus at high frequency were different from those at lower stimulation frequency. Their findings suggested that asynchronous recruitment of motor units resembled the natural physiological condition [17].
The concept of muscle stimulation via afferent nerve fibers has been reported using a wide PD (0.5–1.0 ms) [1819]. Conventional current parameters (short PD, low frequency, and high intensity) generate contractions via antidromic activation of motor axons. However, stimulation at low current intensities with long pulse duration (wide PD, 0.5–1.0 ms) can generate higher stimulated force through recruiting motor units via central contribution [1819]. A wide PD with low intensity can stimulate sensory axons to generate orthodromic activation of motor axons from the spinal circuit similar to natural activation. Therefore, wide PD might minimize muscle fatigue due to naturally recruitment of fatigue-resistance motor units according to Henneman size principle [620]. Thus, a wide PD (0.9 ms) and very high frequency (150 and 200 Hz) were used in this study to compare muscle force and fatigue with conventionally used frequency (50 Hz). Current intensity was set at 10%–20% of maximum voluntary isometric contraction (MVIC) to obtain appropriate stimulated force in clinical application.
Study with very high frequencies (more than 100 Hz) may provide more insights into response to electrical muscle stimulation. The motor axon is stimulated if interpulse interval is longer than the absolute refractory period. Stimulation within a relative refractory period may generate muscle contraction if the current intensity is high enough [21]. Therefore, using a very high frequency (in which the interpulse interval is shorter than the relative refractory period of the motor axon) may generate asynchronous motor unit recruitment. However, a conclusive refractory period in the femoral nerve of human has not been reported yet. Based on literature review, the mean absolute refractory period of the peroneal nerve is approximately 1–2 ms [22], while the mean relative refractory period of the ulnar nerve is about 2–3 ms [23]. Thus, the refractory period of the femoral nerve in human may be around 3–5 ms, suggesting that a 200-Hz current with a PD of 0.9 ms (in which the interpulse interval is 4.1 ms) may stimulate within the refractory period of the motor axon. Therefore, the effect of very high frequency stimulation (150 and 200 Hz) and a clinically used frequency of 50 Hz on stimulated muscle force and fatigue could be determined when the initial force is controlled across the frequency of stimulation. If this assumption is correct, the use of a very high frequency current would stimulate during the refractory period of some of motor axons which may produce asynchronous motor unit recruitment. The rate and extent of muscle fatigue would be similar or less than a 50-Hz stimulation frequency. The purpose of this study was to determine the effect of very high stimulation frequency (150 and 200 Hz) with wide PD versus 50 Hz on stimulated force and fatigue of quadriceps femoris in healthy subjects.
During our pilot experiments, greater force curve variation was found at a very high frequency (200 Hz), but not at low frequency (50 Hz). This force curve variation was observed at the beginning of the stimulation. Therefore, it was not muscle fatigue. It was hypothesized that a high variability in the force curve at very high frequency (200 Hz) might represent asynchronous summation of motor unit recruitment. Therefore, we investigated the stimulated force after 15 minutes of stimulation using current frequency of 50, 150, and 200 Hz in the present study. All stimulated forces were normalized to the initial value. Force curve variation was determined using coefficient of variation (CV) while discomfort level was measured using visual analog scale (VAS).
MATERIALS AND METHODS
Participants
Thirty-four healthy participants (3 males and 31 females; age, 18–35 years) were enrolled for this study. None of them had a history of lower extremity musculoskeletal, neurological, or cardiovascular problem. All participants were informed of research procedures and risks before signing a consent form. This study was approved by the Ethics Committee of the Faculty of Associated Medical Sciences, Chiang Mai University (No. AMSEC-58EX-045).
Procedures
All participants were asked to refrain from strenuous physical activities for at least 48 hours before taking part in the study. Each participant underwent three sessions. The first session included the MVIC of the knee extensor test and familiarization with fatigue test protocol. During the second and third sessions, other stimulation frequencies were used. Each session was separated by at least 48 hours or until there was no perceived muscle soreness.
MVIC of the knee extensor muscle of the right leg was determined for each participant. It was measured using a MLT003/D force transducer (PowerLab; ADInstruments Pty Ltd., New South Wales, Australia) which was connected to a PowerLab 4/35 data acquisition system. The force transducer was placed anteriorly on the leg, approximately 15–20 cm proximal to the lateral malleolus. It was calibrated by a standard weight mass. The transducer was mounted onto a metal frame which was secured to the floor and walls. All participants were seated in a height adjustable chair with back support at knee flexion of 60°. A pelvic band was used to stabilize participant's hip with a chair. They performed three trials of knee extensor isometric contractions. The greatest peak force was recorded as the MVIC of knee extensor muscles and used as reference for calculating the percentage of maximum force produced during the fatigue test. After testing MVIC, current amplitude was determined for all participants. A 10.5 cm×7 cm rubber carbon electrode was placed over each motor point of the rectus femoris and vastus medialis. The current amplitude that produced approximately 10%–20% of participant's MVIC with a rectangular biphasic pulsed current at PD of 0.9 ms and frequency of 200 Hz was used in all fatigue tests depending on the participants' tolerance. After determining the current amplitude, each participant became familiarized with the stimulation test at 50, 150, and 200 Hz for a few minutes.
Following familiarization, a 15-minute rest period was taken to avoid muscle fatigue before the fatigue test. All fatigue protocols were performed using electrical stimulation (ENDOMED 682; Enraf-Nonius, Rotterdam, The Netherlands) with a rectangular biphasic pulsed current at PD of 0.9 ms, frequency of 50, 150, or 200 Hz with 2 seconds on time and 4 seconds off time for 15 minutes. One of three stimulation frequencies (50, 150, or 200 Hz) was applied randomly to the quadriceps muscle of the right leg.
After each fatigue test, participants rated their discomfort score using a VAS ranging from 0 to 10 (0=no discomfort, 10=maximum discomfort). Knee extensor isometric force outputs produced by electrical stimulation were recorded at a sampling rate of 1,000 Hz using a PowerLab 4/35 data acquisition system [24].
Data analysis
Muscle fatigue was defined when there was a decline in stimulated force compared to the initial stimulated force of an individual. Each stimulated muscle force was determined by averaging the maximum stimulated force which was sampled every second over a 2-second contraction time. A custom written software (MATLAB; MathWork, Natick, MA, USA) was used to calculate these stimulated force data. Every 5 contractions from 150 contractions of stimulated forces were averaged. A total of 30 data points for stimulated force from a 15-minute fatigue test were normalized to each participant's initial force.
Variability of the force curve was defined as CV of the average force curve produced over 2-second contraction time. Data points of force for each participant's initial force curve were sampled every 10 ms over 2-second contraction time. Mean of force and standard deviation (SD) from 200 data points were calculated and used for CV analysis. The CV of force curve in each stimulation frequency was calculated using the following formula [25]:

In a first instance, overall CV was determined for all participants. However, the force curve pattern produced by very high frequency showed inter-individual variability. Therefore, we classified the occurrence of force curve variation into responder and non-responder. The criterion for quantifying responder and non-responder was based on our hypothesis (i.e., stimulation using very high frequency might produce asynchronous of motor units which would create force curve variation). If the CV at 200 Hz was more than that at 50 Hz condition, the participant was considered a responder. On the contrary, if the CV at 200 Hz was less than that at 50 Hz condition, the participant was considered a non-responder.
To foster a better understanding of stimulated muscle force during the fatigue test, curve fitting pattern and its slope were also determined. Goodness of fit was tested using a regression model (R2 with p<0.05). Data were averaged for normalized stimulated force values obtained from the fatigue test for all participants. Non-responder and responder groups were analyzed by curve fitting using Microsoft Excel version 2013 for Windows (Microsoft Corporation, Redmond, WA, USA) [26].
Statistical analysis
Normal distribution of data was analyzed using Shapiro-Wilk test. Friedman test was used to determine significant differences of all variables. The same statistical test was used to determine significant differences of normalized force values at the end of fatigue test and CV of force among three stimulation frequencies for both responder and non-responder groups. When results were significant, post hoc analysis was performed using Wilcoxon signed-rank test with Bonferroni correction (significant level was set at p<0.017). All data are presented as mean±SD. Statistical significance was set at p<0.05. SPSS version 17.0 for Windows (IBM SPSS, Armonk, NY, USA) was used for all statistical analyses.
RESULTS
Participants' age, current amplitude, MVIC, %MVIC of average peak forces at the beginning, and discomfort level in each stimulation frequency are summarized in Table 1. Friedman test revealed that %MVIC of average peak force at the beginning with same current amplitude was significantly (p<0.05) different among three stimulation frequencies. Wilcoxon signed-rank test with Bonferroni correction indicated that %MVIC of average peak force at the beginning at 150 Hz was greater (p<0.017) than that at 50 Hz. However, it showed no significant difference between 150 Hz and 200 Hz (p=0.256) or between 50 Hz and 200 Hz (p=0.05). VAS scores during fatigue test (Fig. 1) were not significantly (p>0.05) different among the three stimulation frequencies (50, 150, and 200 Hz).
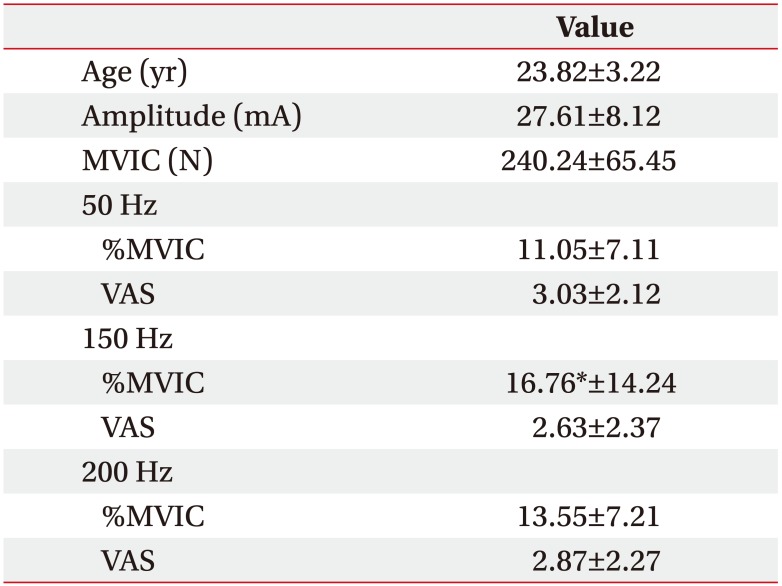
Results of age, current amplitude, MVIC, %MVIC of average peak forces at the beginning and discomfort level (VAS) of participants (n=34)
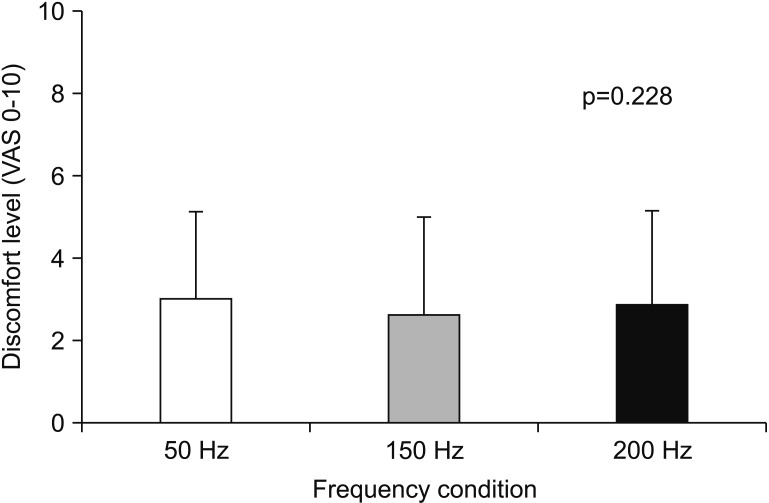
Visual analog scale (VAS) score of discomfort level during fatigue test at each frequency condition. Data are presented as mean. Error bars represent standard deviation.
Table 2 shows CV of force at 50, 150, and 200 Hz. The CV of force was not significantly different among participants. According to CV of force classification, 22 participants were classified into the responder group, while 12 participants were classified into the non-responder group. The CV of force showed statistically significant (p<0.01) differences among three stimulation frequencies for both responder and non-responder groups. Wilcoxon signed-rank test with Bonferroni correction revealed that the CV of force in the responder group was significantly (p<0.017) higher at 150 and 200 Hz compared to that at 50 Hz. However, the CV of force in the non-responder group was significantly higher at 50 Hz than that at 150 or 200 Hz (p<0.017).

Coefficient of variation of force
Curve fitting of overall normalized force showed different patterns between 50 Hz and 150 or 200 Hz (Fig. 2). Very high stimulation frequencies showed more decline in normalized stimulated force (log linear curve) than low stimulation frequency at 50 Hz (a linear curve) during a 15-minute fatigue test. However, normalized stimulated forces at the end of the fatigue test (54.62%±25.27% at 50 Hz, 48.01%±41.45% at 150 Hz, and 43.54%±20.97% at 200 Hz) were not significantly different among the three stimulation frequencies (p=0.06).
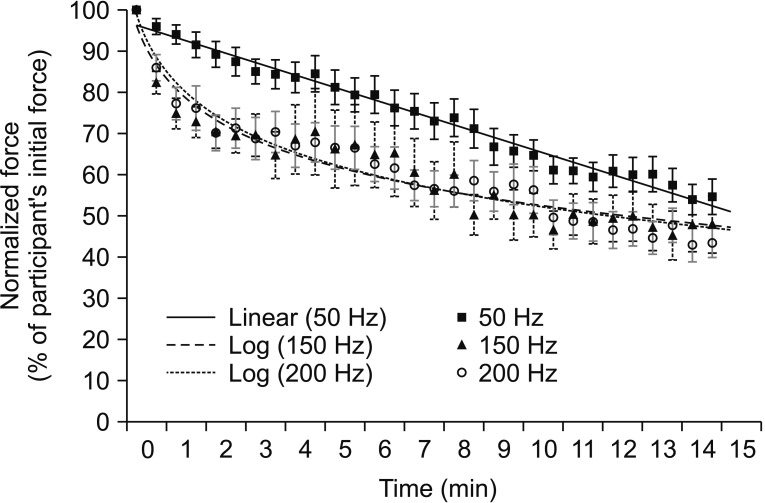
Curve fitting pattern of normalized stimulated force values obtained during a 15-minute fatigue test under all stimulation conditions. Data are presented as mean. Error bars represent standard error of mean.
The non-responder group (Fig. 3A) showed a decline in normalized stimulated force for all three frequency conditions, similar to the overall data (Fig. 2). The non-responder group also demonstrated a log linear pattern at very high frequencies (150 and 200 Hz) but a linear pattern at 50 Hz. However, the responder group (Fig. 3B) presented a linear pattern for all three-frequency conditions. Interestingly, Fig. 3 showed different curve fitting patterns at very high frequency (150 and 200 Hz): log linear pattern in the non-responder group (R2=0.936; y=−13.34ln(x)+77.791; p<0.001 at 150 Hz and R2=0.904; y=−12.44ln(x)+80.614; p<0.001 at 200 Hz) but linear pattern in the responder group (R2=0.846; y=−2.8769x+86.262; p<0.001 at 150 Hz and R2=0.917; y=−3.1419+86.269; p<0.001 at 200 Hz).
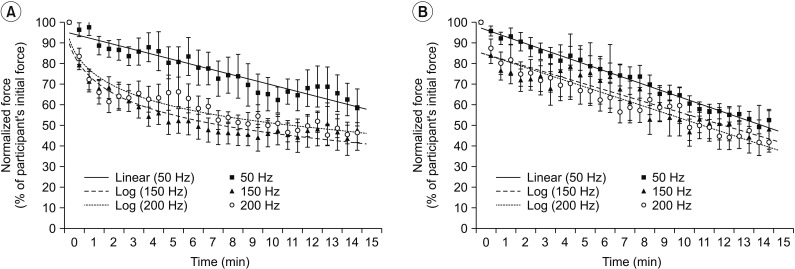
Curve fitting pattern of normalized stimulated force values obtained during a 15-minute fatigue test under all stimulation conditions. (A) Non-responder group. (B) Responder group. Data are presented as mean. Error bars represent standard error of mean.
All three frequencies in the responder group demonstrated a linear pattern with similar slope (−3.32 at 50 Hz, −2.88 at 150 Hz, and −3.14 at 200 Hz). No significant difference in normalized stimulated force was found among the three stimulation frequencies at the end of the fatigue test in responder or non-responder group (p>0.05) (Table 3). A linear pattern with similar slope at all threefrequency conditions and no statistically significant difference in normalized stimulated force at the end of test suggest a trend toward the same fatigue at all three frequencies in the responder group.
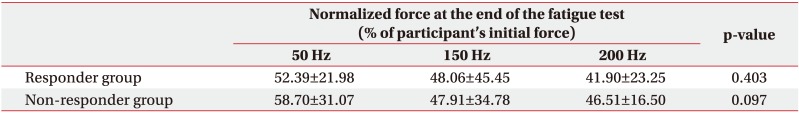
Normalized force in the end of the fatigue test at each stimulation frequency
DISCUSSION
This was the first study that compared the effects of very high (150 and 200 Hz) and low (50 Hz) stimulation frequencies combined with a wide PD (0.9 ms) on the decline of stimulated muscle force of the quadriceps femoris muscle in healthy participants. We expected that the use of very high stimulation frequencies (150 and 200 Hz) might asynchronously recruit motor units, thus resulting in similar or less muscle fatigue than the use of a low stimulation frequency. In accordance with this hypothesis, this study found that very high stimulation frequencies (150 and 200 Hz) showed a trend to decline more in normalized stimulated force than the low stimulation frequency (50 Hz) based on overall data, although the difference between very high stimulation frequencies and low frequency was not statistically significant. Such result in overall subject analysis might be due to the inter-subject variability caused by intrinsic or other factors between subjects in response to electrical stimulation [27]. Adams et al. [27] have found that the pattern of muscle recruitment stimulated by electrical stimulation does not appear uniformly. Instead, the pattern varied among subjects. Such variation in stimulation pattern might be due to differences in subject's orientation and dispersion of nerve axons relative to electrodes [27]. A large inter-subject variability of force has been reported in previous studies [2528]. The high inter-subject variability might be caused by sequences of recruitmentderecruitment patterns of some motor units [2528]. Our findings are similar to those of Papaiordanidou et al. [29] showing that higher stimulation frequency can induce greater force decline during the initial period of repetitive electrical stimulation protocol. However, muscle fatigue at the end of frequency test remains unclear. Similar reduction of the stimulated force in WPHF (80 Hz with 1 ms) compared to conventional stimulation (20 Hz with 0.05 ms) has been reported by Martin et al. [30]. An increase in membrane excitability threshold which results in reduced motor unit during electrical stimulation might be the underlying mechanism of force reduction in high frequency stimulation [2930].
However, splitting data to responder and non-responder groups showed different curve fitting patterns at very high frequency. The normalized stimulated force at 150 and 200 Hz changed from log linear pattern to linear pattern, similar to that at 50 Hz. Moreover, the linear pattern at all-frequency conditions in the responder group showed similar slopes. This result may imply that stimulation at very high frequency (150 and 200 Hz) can induce different patterns of muscle fatigue in responder and the non-responder groups. Similar slopes of linear curve at all frequencies in the responder group suggest similar fatigue at very high and low stimulation frequencies. Our results are in agreement with findings of Martin et al. [30] showing that the mean force is decreased gradually and similarly for both WPHF and conventional protocols. They proposed that mechanisms of muscle fatigue involved in the force decrease were different for each protocol. For WPHF, increased excitability threshold of the motor axon might have led to decrease in force whereas force reduction during conventional protocol might be due to intramuscular processes [30].
This study also combined the effect of wide PD with very high frequency. Wide pulse stimulation could increase central motor unit recruitment and produce higher force [18193132]. However, central motor unit recruitment from wide pulse stimulation has only been demonstrated in some participants [2528]. Dean et al. [18] and Wegrzyk et al. [33] have reported that stimulation intensity at 10% of MVIC is essential for demonstrating the central contribution mechanism, although some participants might need less intensity than this. The present study controlled the stimulated force to be within 10%–20% of MVIC for all frequency protocols. Thus, central contribution might not have been elicited in all participants. Difference in central contribution may partly explain the inter-variability of the force curve. Within a group of 34 participants, 22 (64.7%) were identified as responders while 12 participants were identified as nonresponders according to CV of 50 Hz versus 200 Hz.
Differences in tested electrical parameters, especially frequency, make it difficult to compare these results with others. Dideriksen et al. [17] have shown that stimulation of afferent fibers with a low intensity but high frequency (100 Hz) current could partly overcome non-ordered recruitment and synchronization of motor units. However, constant stimulation current that is below the motor axon rheobase cannot be directly applied to the clinical stimulation. Russ et al. [34] have demonstrated that percentages of decline in peak force during the fatigue test were similar between 80 Hz and 100 Hz protocols if the initial force is controlled. However, 80 Hz and 100 Hz were very close. Their interpulse intervals were approximately 12 and 9.5 ms, respectively. They are likely to be longer than the refractory period of the femoral nerve. Matsunaga et al. [35] have found less decline in force at a high stimulation frequency (100 Hz) during the fatigue test compared to a low stimulation frequency (20 Hz) in healthy subjects. However, the off time of 4 seconds between contractions in this study was shorter than the 60 seconds in the study of Matsunaga et al. [35].
Dreibati et al. [7] have demonstrated less decrease in muscle force at low stimulation frequencies (20 and 50 Hz) at the end of a fatigue session compared to a high stimulation frequency (100 Hz). Compared to this study, the fatigue protocol used by Dreibati et al. [7] had much shorter PD (0.3 ms vs. 0.9 ms) and lower frequency (100 Hz vs. 150 and 200 Hz). Thus, the difference in findings between studies might be due to a combination of wide PD and the very high frequency parameter setting during repetitive electrical stimulation.
Although not clearly understood yet, a combination of very high stimulation frequencies (150 and 200 Hz) with a wide PD (0.9 ms) might affect the recruitment of stimulated muscle force more compared to commonly tested protocols (50 Hz). Kesar et al. [36] have also found that a combination of frequency and PD can affect peak forces and muscle fatigue. They found that frequency-modulation (11.6–60 Hz, 600 µs PD) showed better performance in peak forces and force-time integrals in response to fatiguing trains than pulse-duration-modulation (131–300 µs PD, 60 Hz), although they produced similar levels of muscle fatigue.
Results of the responder group may raise an awareness that a combination of a wide pulse (0.9 ms) with very high frequency (150 or 200 Hz) at 10%–20% MVIC intensity might cause the same degree of muscle fatigue compared to that at low frequency (50 Hz). The advantage of using a very high stimulation frequency with wide PD is that this protocol can generate muscle force to a functional level in a short duration. This muscle force is useful for FES in patients with neurological conditions. Neyroud et al. [25] and Wegrzyk et al. [33] have also shown that the current intensity required to produce targeted force is greater at low frequency (25 Hz) that that at high frequency (100 Hz). Moreover, the discomfort level was similar between high and low stimulation frequency protocols [33]. However, variation of responses among individuals is the main concern. These variations might be due to intrinsic factors such as innervation pattern of femoral nerve [27] and current intensity factor. At present, current intensity required to create central contribution is inconclusive (from 10%–20% MVIC) [182528]. Therefore, further study is needed to identify these factors that cause intersubject variability.
Finally, findings of this study were obtained from healthy individuals in a single 15-minute test. They cannot be directly applied to individuals with neurological impairment because alterations of skeletal muscle that follow neurological impairment [373839] may differ from those in healthy subjects. Thus, further study on a population with neurological impairment is required.
In conclusion, there were high inter-subject variations in the response at different frequency stimulation conditions. Only the responder group showed a linear pattern with similar slope at all conditions without significant difference in normalized force at the end of fatigue test. Factors responsible for this variation need to be determined before applying such stimulation to clinical setting. Further studies are needed to evaluate the effect of very high stimulation frequency combined with wide PD on stimulated force and fatigue of quadriceps femoris in participants in a training program.
Notes
CONFLICT OF INTEREST: No potential conflict of interest relevant to this article was reported.