


INTRODUCTION
Motor evoked potential (MEP) is a rapid and feasible method to evaluate the integrity of corticospinal pathways, and can be administered in a noninvasive, and even pain-free, manner [1,2,3,4,5,6,7]. Previous studies have suggested the usefulness of MEP as a screening and diagnostic tool for myelopathy, and as a prognostic predictor after spinal cord injury (SCI) [7,8,9,10]. Nakamae et al. [7] reported that MEP latency and central motor conduction time (CMCT) were prolonged (86% and 59%, respectively) among myelopathy patients and a control group. In patients with acute transverse myelitis CMCT, where MEP amplitudes were different from a control, MEP shapes were abnormal (96% of patients), and MEP thresholds were elevated [8]. Meanwhile, Curt et al. [9] analyzed the significance of MEP latency and amplitude in predicting motor function in acute and chronic SCI patients. Additionally, CMCT and initial severity of paralysis could be useful predictors [10].
However, it remains difficult to correlate between MEP responses with clinical motor impairment. Berardelli et al. [2] demonstrated that MEP was absent in some patients who had hemispheric infarction with incomplete motor deficit. Additionally, in another study of 6 patients with cervical myelopathy, MEP was recorded in the abductor pollicis brevis muscle, which had no motor activity in 3 patients with complete paralysis [1].
Koreans with SCI are enlisted in the disability registration system to receive social security benefits. During this registration process, the severity of motor paralysis is the most important determinant for disability grading, which is directly related to the amount of social security benefits. Therefore, there might be some malingering of motor paralysis to get a higher disability grade. If some patients produced submaximal contraction of a limb muscle intentionally, or could not cooperate properly, the examiner might not be able to evaluate actual manual muscle test (MMT). Without peripheral nervous disease (e.g., peripheral neuropathy, muscle disorder), a patient's MMT reflects the integrity of the corticospinal tract. Thus, MEP responses could be useful as a complementary evaluation tool to MMT, for disability registration system of Korea.
The purpose of the present study was to investigate the relationship between MEP response and severity of motor paralysis, which was evaluated according to the Korean disability evaluation system in SCI patients. We conducted a cross-sectional analysis using retrospective data of SCI patients between 2000 and 2015.
MATERIALS AND METHODS
Participants
The medical records of patients admitted to the Department of Rehabilitation, Seoul National University Bundang Hospital for SCI from 2000 to 2015 were reviewed retrospectively. We identified 259 patients who received MEP studies, and excluded 58 patients because of incomplete data about motor power grade and MEP. Patients with neurological levels of injury (NLI) at the cervical and thoracic levels were included, which means that tetraplegia and paraplegia were included. But, patients with NLI at the lumbar level might have lower extremity motor weakness due to spinal nerve root injury rather than SCI; thus, 31 patients with NLI at or below L1 were also excluded (Fig. 1). Diseases involving the brain or peripheral nervous system (e.g., plexopathy, peripheral nerve entrapment) might affect MEP response; so, patients clinically diagnosed with cerebral lesions or other peripheral nerve disorders were also excluded.
During the disability registration process, disability grades are determined 6 months after onset, and the results of MEP studies performed within 6 months after SCI could be used for this process. When considering the characteristics of the patients in our hospital, the early period of SCI patients (during the first 6 months after onset) were enrolled. And, the correlation between MEP and MMT was presumed not to change over time. Hence, 37 patients evaluated more than 6 months after onset were excluded. Because there could be spontaneous motor recovery within 6 months after SCI [11,12,13], the longer the time interval between the neurologic examination and the MEP study, the higher the probability of bias in investigating the relationship between MEP responses and the severity of motor paralysis. For this reason, 37 patients were excluded because of a time interval greater than 2 weeks. We analyzed 192 lower limbs of 96 persons with SCI (Fig. 1). The study protocol was approved by the Institutional Review Board of the Seoul National University Bundang Hospital in Korea (IRB No. B-1306/205-004).
MEP study protocol
All patients were evaluated for MEP responses after being instructed to relax their limbs, in a supine position. Surface electrodes were placed bilaterally on the skin, over the abductor hallucis (AH). A double cone coil with a diameter of 100 mm was connected to a transcranial magnetic stimulator (Magstim BiStim; Magstim Company, Whitland, UK), and magnetic stimulation was applied tangentially over the area corresponding to Cz, following the international 10-20 system, with 100% of stimulation output. Evoked electromyographic (EMG) signals were recorded with an EMG machine (CareFusion Company, San Diego, CA, USA) with filter settings of 100 Hz and a sweep speed of 100 ms.
After checking MEP responses, we classified the response into three groups: ŌĆśnormalŌĆÖ, ŌĆśdelayed,ŌĆÖ and ŌĆśabsentŌĆÖ. Latency was defined as the moment of initial upward or downward deflection of the response, and the ŌĆśdelayedŌĆÖ MEP response was identified as a positive response with delayed onset latency (longer than 50 ms). A positive response was defined as the presence of a signal with more than 100 ┬ĄV. The MEP of the ŌĆśabsentŌĆÖ group did not show positive response from 100% stimulation, with stimuli delivered at least three times to confirm no response. Among the ŌĆśnormalŌĆÖ group, MEP showed positive responses without delayed latency.
Evaluation of motor paralysis
The motor power of lower limbs was evaluated according to the motor examination guidelines of the International Standards for Neurological Classification of Spinal Cord Injury [14], which consists of assessing the strength of five key muscles of the lower limbs: hip flexor, knee extensor, ankle dorsiflexor, long toe extensor, and ankle plantar flexor. The strength of each muscle was rated on a scale of 0 to 5, with the total possible score of a single lower extremity being 25. Individual lower limbs were divided into four groups, depending on their motor score: <10 (group 1), Ōēź10 and <15 (group 2), Ōēź15 and <20 (group 3), and Ōēź20 (group 4).
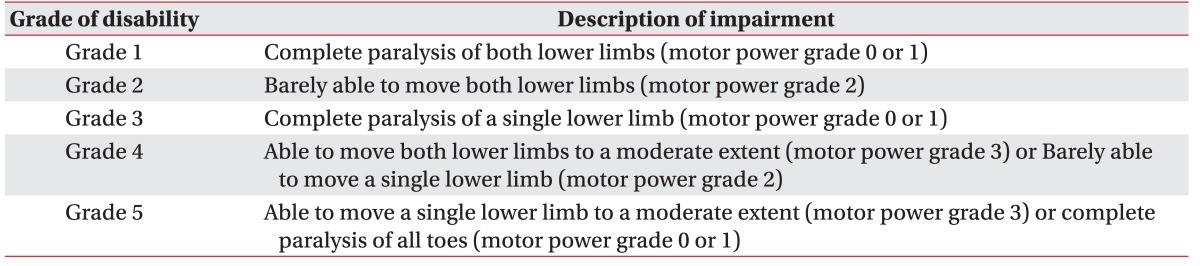
In the Korean disability registration system, muscle strength of an individual limb is assigned to four groups with motor power 0 or 1 as one group, 2, 3, 4, or 5, each as another group (Table 1), but there is no guideline for classifying a limb when its mean muscle power is between integers, for example 1.8.
In this study, we elected to round-down rather than round-off; for example, if the mean value of motor power of the five key muscles was 1.8 in both lower limbs, integer 1, rather than 2, would be assigned for the muscle strength of the limb. Therefore, a motor score of less than 10 in one lower limb (which indicates a total sum of less than 10 in MMT of five key muscles), represents a muscle strength of 0 or 1 in the Korean disability registration system.
In the same way, a motor score of 10 or above (but below 15) represents a single limb muscle strength of 2, motor scores of 15 or above (but below 20) represent a single limb muscle strength of 3, and motor scores of 20 or above represent a single limb muscle strength of 4 or 5, in the Korean disability registration system.
Outcomes
The primary study outcome was the identification of a correlation between MEP response and the severity of motor paralysis. MEP response was classified into three groups by onset latency (as described above), and analyzed along with a single lower limb motor score (range, 0ŌĆō25), which indicated the severity of motor paralysis. A secondary outcome was the examination of the effectiveness of MEP responses for the Korean disability evaluation system. We investigated whether we could discriminate between different motor groups based on their MEP response.
Statistical analysis
We categorized MEP response into three groups, according to responsiveness (normal, delayed, and absent), and lower limb motor score into four groups, determined by score (<10, group 1; Ōēź10 and <15, group 2; Ōēź15 and <20, group 3; and Ōēź20, group 4. A nonparametric Spearman correlation coefficient was used to evaluate the correlation between MEP responses and motor score. Kruskal-Wallis nonparametric tests were performed to assess whether the mean responsiveness was the same in the four different motor score groups; this was done because the variables do not meet the normality assumptions of a one-way variance analysis (ANOVA). Mann-Whitney tests with Bonferroni correction were used as a post hoc test, analyzing which group's mean responsiveness was larger than the others. SPSS ver. 21.0 (IBM SPSS, Armonk, NY, USA) was used for the analysis.
RESULTS
Characteristics of subjects
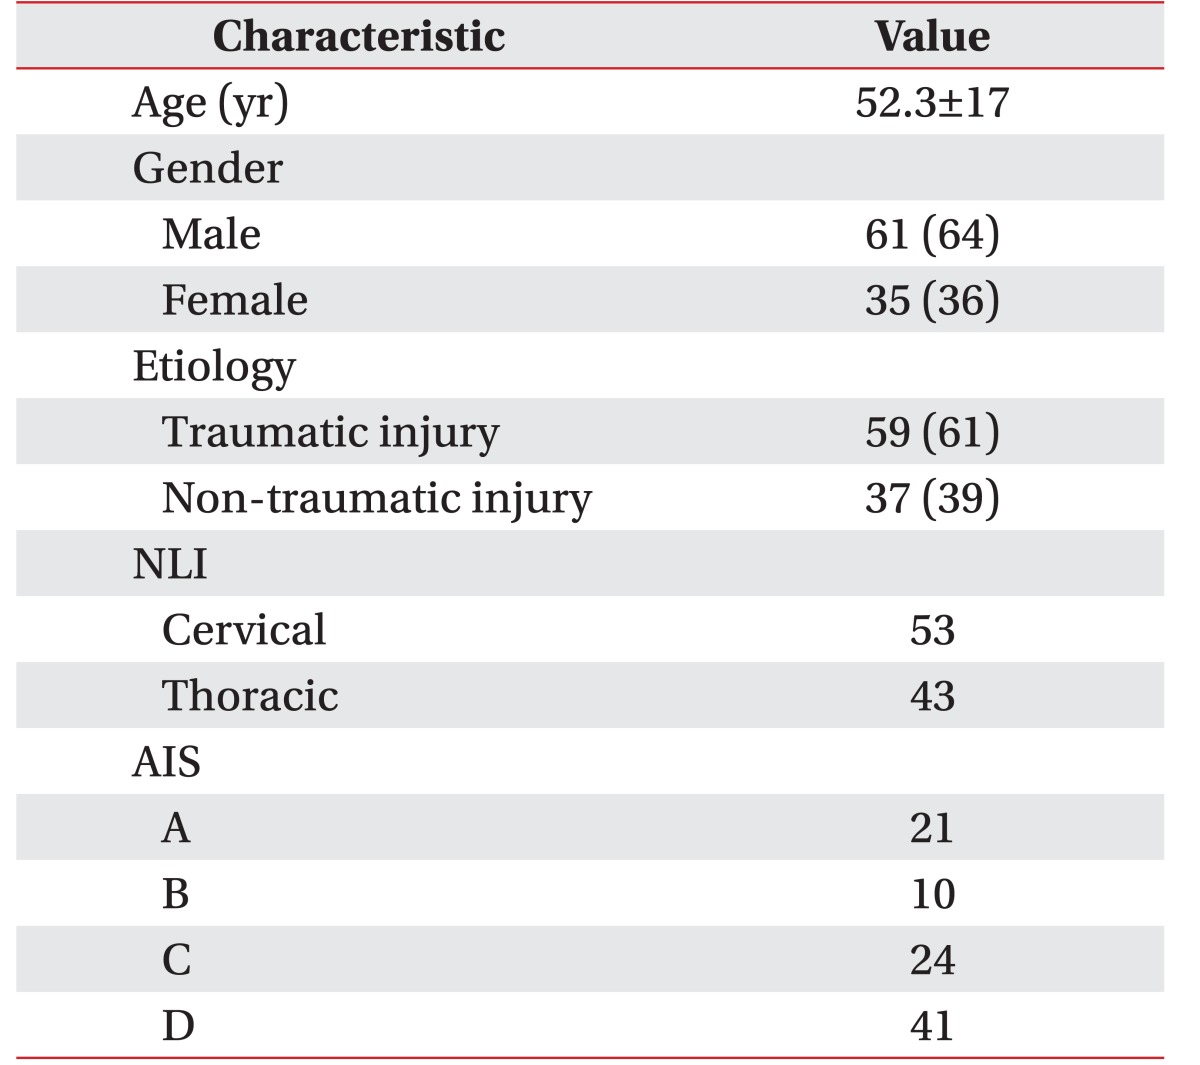
Among the 96 patients, 61 were male and 35 were female (Table 2). A total of 192 lower limbs were analyzed. The number of persons divided into the American Spinal Injury Association impairment scale (AIS) levels of A, B, C, and D was 21, 10, 24, and 41, respectively (Table 2). The mean and median values of total motor scores of individual limbs was 10┬▒9 and 10, respectively. The mean time interval between onset and motor power evaluation was 37.0┬▒34.9 days, and the median time interval was 26.5 days. The time interval between motor power evaluation and MEP study was 4.7┬▒5.4 days, and the median time interval was 5.0 days. SCI occurred after a traumatic event in 59 patients, and after a tumorous condition, infection, or spinal cord infarction in 37 patients.
AIS and MEP response
All patients who were classified as AIS A or B showed no response in MEPs. In 6 (25.0%) AIS C patients, and 2 (4.9%) AIS D patients, MEP responses were not obtained on both lower extremities. Three of the 24 AIS C patients had no lower limb motor power, but did display voluntary anal contraction. Among 6 limbs whose motor score was 0, only one limb showed an MEP response with delayed latency. In the AIS D patients, there were 14 individual limbs not showing any MEP response.
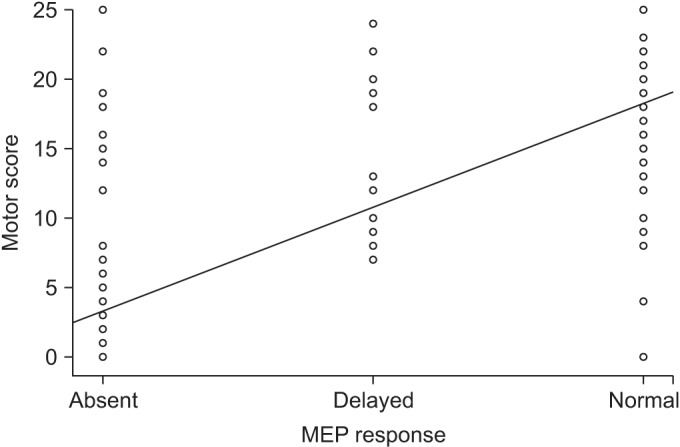
Correlation between MEP response and motor score
MEP responses grouped according to onset latency and ipsilateral single limb motor scores were highly correlated. The Spearman rank correlation coefficient derived from MEP response and motor score was 0.765 (p<0.0001), indicative of an improvement of motor scores with MEP response from ŌĆśabsenceŌĆÖ to ŌĆśdelayed latencyŌĆÖ and from ŌĆśdelayed latencyŌĆÖ to ŌĆśnormalŌĆÖ (Fig. 2).
Comparison of MEP response between motor score groups
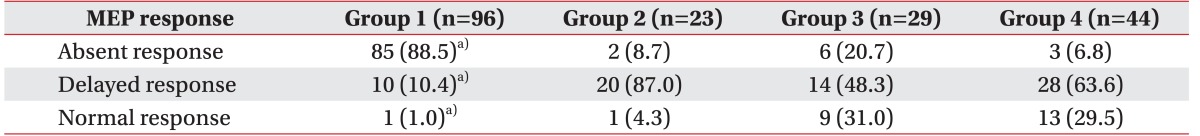
The total number of single lower limbs divided into motor groups 1, 2, 3, and 4 was 96, 23, 29, and 44, respectively. Table 3 shows the distribution of individual lower limbs of SCI patients, according to their MEP response and motor score groups. There was a significant difference of MEP response between the motor score groups (Žć2=110.153, df=3, p<0.001, Kruskal-Wallis test). MEP response was markedly poor in motor group 1 (limb motor score <10) than the other three groups (p<0.0001, Mann-Whitney test with Bonferroni correction). However, there were no significant differences between groups 2, 3, and 4.
DISCUSSION
The results of this study demonstrate that MEP responses were highly-correlated with limb motor score. However, a comparison of MEP responses between motor score groups implied that the clinical utility of MEP studies might be limited to cases like those in motor group 1, in which lower limb motor scores were lower than 10, rather than cases with lower limb motor scores of 10 or above. Therefore, if there was an SCI patient with severe motor paralysis, with a single lower limb motor score of less than 10, but also with normal MEP responses, either an inaccurate muscle power examination or a malingering of paralysis should be considered.
Gianutsos et al. [1] demonstrated that MEP in response to transcranial magnetic stimulation could be elicited from muscles over which a person had no voluntary control. Such so-called ŌĆśdiscompleteŌĆÖ SCI, where the patient has clinically complete lesions, but also appears to have residual connectivity, was demonstrated in only one limb with delayed latency, among 65 limbs with complete motor paralysis, in this study.
The presence of MEP responses could be regarded as strong evidence that a subject was voluntarily capable of limb control. Conversely, the absence of MEP responses does not guarantee the complete loss of voluntary motor control, because MEP responses were not always obtainable in subjects with voluntary motor control. As shown in Table 3, MEP responses were not obtained in 3 limbs with motor score at or above 20. Overall, among 96 limbs with voluntary movement, 11 (11.5%) did not respond to transcranial magnetic stimulations.
Motor cortical areas corresponding to foot muscles lie deep in the interhemispheric fissure, requiring higher intensity to be stimulated, as compared to hand motor cortical areas. Although maximal output -100% of stimulation intensity of the magnetic stimulator was applied using a double cone coil, motor threshold might not be reached by induced electric field in some patients with residual voluntary motor control, who did not respond to magnetic stimulations.
In the study of Berardelli et al. [2], 13 stroke patients with residual voluntary motor functions in their hands did not produce measurable MEP responses; the authors explained that non-pyramidal pathways, such as the rubrospinal tract, as well as small pyramidal tract fiber, could contribute partially to voluntary motor control without eliciting MEP responses. Also, in lower limbs, the partial contribution of the non-pyramidal tract to voluntary motor control could not be ruled out completely.
To the best of the authors' knowledge, this study is the first to investigate the relationship between lower limb motor power and MEP responses in persons with SCI. According to the results, MEP response would be a supportive method in determining the grade of a disability. Furthermore, these results are practical and easy to apply to clinical practice, as MEP was recorded in the AH muscle, which is selected more often than any other lower limb muscle for MEP. However, there are several limitations that hinder the generalization of the results.
First, the subjects analyzed were all in a subacute period after SCI, within 6 months from onset. Neurologic statuses, including lower limb muscle strength, would change during this subacute period due to neuroplastic changes, as well as rehabilitation [11]. Therefore, the relationship between lower limb muscle power and MEP responses during a chronic period after SCI might be different from that in a subacute period, as suggested in this study.
Second, there are several other MEP techniques used to understand the functions of corticospinal tract other than latency, which is the only MEP parameter in this study. CMCT might reflect the severity of a central nervous system lesion more exactly than MEP latency alone [15]. Also, the voluntary facilitation of MEP, resting motor threshold measurement, MEP amplitude, and recruitment curve analyses, paired with stimulation techniques, might provide an additional useful tool for evaluating the function of the corticospinal tract. Therefore, these parameters might have a role in further discriminating motor scores in groups 2, 3, and 4 in this study.
To evaluate the continuity of the corticospinal tract, the most distal muscle (such as the external anal sphincter [EAS] muscle) would be best suited for examination. However, the EAS is hard to examine by surface electrode; moreover, the needle required for an EMG of the EAS is less practical because of its invasiveness. And, as a previous study revealed, there is a more extensive cortical projection to motor nuclei of distal limb muscles than to that of proximal muscles [16]. So, we assumed that the corticospinal tract to the AH might reflect that of all lower limb muscles, and checked MEP responses only in AH muscles. That could be the third limitation of this study, and if there were MEP responses of more proximal muscles innervated by other myotome (e.g., tibialis anterior, quadriceps femoris), that would enable us to more accurately predict motor power.
Although MEP responses were highly correlated with motor scores of lower limbs in SCI patients, the clinical utility of MEP study, as a complimentary tool to MMT, could be limited to motor score groups with severe paralysis (i.e., single lower limb motor power grade of 0 or 1, or from grades 2, 3, and 4 or above in the Korean disability evaluation system).