The Availability of Radiological Measurement of Femoral Anteversion Angle: Three-Dimensional Computed Tomography Reconstruction
Article information
Abstract
Objective
To assess the intra-rater and inter-rater reliability for measuring femoral anteversion angle (FAA) by a radiographic method using three-dimensional computed tomography reconstruction (3D-CT).
Methods
The study included 82 children who presented with intoeing gait. 3D-CT data taken between 2006 and 2014 were retrospectively reviewed. FAA was measured by 3D-CT. FAA is defined as the angle between the long axis of the femur neck and condylar axis of the distal femur. FAA measurement was performed twice at both lower extremities by each rater. The intra-rater and inter-rater reliability were calculated by intraclass correlation coefficient (ICC).
Results
One hundred and sixty-four lower limbs of 82 children (31 boys and 51 girls, 6.3±3.2 years old) were included. The ICCs of intra-rater measurement for the angle of femoral neck axis (NA) were 0.89 for rater A and 0.96 for rater B, and those of condylar axis (CA) were 0.99 for rater A and 0.99 for rater B, respectively. The ICC of inter-rater measurement for the angle of NA was 0.89 and that of CA was 0.92. By each rater, the ICCs of the intrarater measurement for FAA were 0.97 for rater A and 0.95 for rater B, respectively and the ICC of the inter-rater measurement for FAA was 0.89.
Conclusion
The 3D-CT measures for FAA are reliable within individual raters and between different raters. The 3D-CT measures of FAA can be a useful method for accurate diagnosis and follow-up of femoral anteversion.
INTRODUCTION
Intoeing gait is a symptom that commonly appears in childhood and can also be seen in normal young children. Its causes can be metatarsus adductus, internal tibial torsion, increased femoral anteversion angle (FAA) or combinations of these [12]. Since the FAA can be increased or reduced in various diseases including not only intoeing gait, but also congenital hip dislocation, polio, and cerebral palsy [34], its measurement is clinically important and requires an accurate assessment. The FAA was measured with different methods in various research studies. One of the methods using the position of external rotation in greater trochanter of the femur as a physical examination is not meaningful due to the very low accuracy [5]. The plane radiography has several errors resulting in low accuracy and reliability [67]. Other approaches such as ultrasound [7], magnetic resonance imaging [8], fluoroscopy were attempted as well, but their examination procedures are too complicated, and the reliability and usefulness cannot yet be verified. The two-dimensional computed tomography (2D-CT) shows a meaningful correlation between tibia and FAA in the physical examination of the child with intoeing gait. Several studies [91011] have reported a significant correlation between physical examinations and femoral with tibial torsion angles by using 2D-CT in children with intoeing gait. However, measurements with 2D-CT have some limitations. Firstly, the measurement error more frequently occurs with larger FAA [12]. Secondly, positional error occurs when the patient's position and lower extremities are not rotated, abducted and adducted for exact vertical alignment during CT image acquisition. Since we examine children, who have more possibility of poor cooperation for positioning, 2D-CT measurements may be clinically challenging. Recently, the advancement of image technology has led to the development of 3D-CT reconstruction, which is widely used currently for the diagnosis of various diseases [1314151617]. In 2010, Gose et al. [13] morphometrically analyzed femur of children with cerebral palsy by using 3D-CT. However, they did not analyze the accuracy of femur neck angle nor femoral anteversion measurements; rather, they compared correlation and other parameters with different examination methods. Kim et al. [14], reported that the measurement method of FAA is too complicated for clinical application. Therefore, we developed clinically applicable 3D-CT measurement method, which could be used in outpatient clinic with less effects of positioning than 2D-CT. In this study, the FAA of the reconstructed femur was obtained from the young children who visited the foot clinic with intoeing gait using the 3D-CT reconstruction method and further investigated the measurement reliability of the intra-raters and the inter-raters, in order to test the usefulness and availability of the method.
MATERIALS AND METHODS
Subjects
The study included a total of 164 legs of the 82 young children who visited our foot clinic of rehabilitation medicine with intoeing gait and underwent 3D-CT from 2006 to 2014. Of the 82 children, 31 were boys with an average age of 6.8±3.3 years, and 51 were girls with an average age of 6.0±3.1 years. The average age of all children was 6.3±3.2 years (Table 1).

Age and sex distribution of the subjects
Methods
In order to obtain the image, the children were placed on the 64-channel CT scanner (Brilliance 64; Philips Medical Systems, Best, the Netherlands) with both lower extremities fixed at the sliding table after full extension of the knees using the strap. CT image of bilateral femur was obtained. The image acquisition was with field of view 314 mm, detector collimation 64×0.625 mm, table movement speed 44.4 mm/rotation, and gantry rotation speed 1 second, 120 kVp, 36 mAs/slice. The image was reconstructed with 2 mm thickness and 1 mm spacing. Extended Brilliance Workspace ver. 2.0 software (Philips Medical Systems) was used to reconstruct 3D image by the volume rendering method. The corresponding images were obtained on 3D-CT reconstruction. After 3D image construction, horizontal view was acquired by 90° rotation through the program from anteroposterior view, which is the view of femur looking down from top that does not permit correct FAA measurement. For each FAA measure, the program was used to remove femur of one side and the remaining image was rotated as vertically as possible to hide femur shaft. Upside down image of femur was also rotated to get the most suitable view, which shows the femur neck most linearly (Fig. 1). Assistance for these processes was provided by the Department of Radiology after 3D-CT. FAA was measured from the image acquired through these processes, by 2 raters from the Department of Rehabilitation Medicine. The measurement was conducted on the 3D-CT reconstruction axial view image that aligned femur head, neck and greater trochanter in the straightest line. In this 2D image, the femur head shape was hypothesized as partially circle and femur neck as rectangle. The measurement was based on consistent image shaping, which is highly important for accurate measurement of the FAA. The FAA was measured radiologically through the difference of the femur neck angle and the condylar angle. The femur neck angle was found through the measurement of the neck axis of femur against the horizontal axis. The neck axis of femur, which was the reference axis for proximal, was set as the line connecting the 2 center points of the neck of femur and the head of femur craniocaudally (Fig. 2). Femur was hypothesized as a circle, and a line that linked 2 points of the circle and passed the center of the circle was drawn. Femur neck was hypothesized as a cylinder, and 2 lines extending from the cylinder were drawn. Subsequently, a horizontal line, which was closest to the greater trochanter from femur neck and tangential to the 2 extended lines, was drawn. The femur neck axis was considered as the connection between the bisecting point of this horizontal line and the center of circle (Fig. 3).

(A) Anteroposterior view was acquired from 3-dimensional computed tomography. (B) Ninety degrees of rotation by the program resulted in the horizontal view, which is the looking down view of the femur. To measure each FAA, left side femur was eliminated (C) and the remaining right femur was rotated as vertically as possible in a view that hides the femur shaft (D). Upside down view of the femur was rotated to make femur neck as the most linear, for the straightest line (E). R, right; L, left; FAA, femoral anteversion angle.

The angle between the long axis of the femur neck and horizontal line is defined as femoral neck angle. R, right.
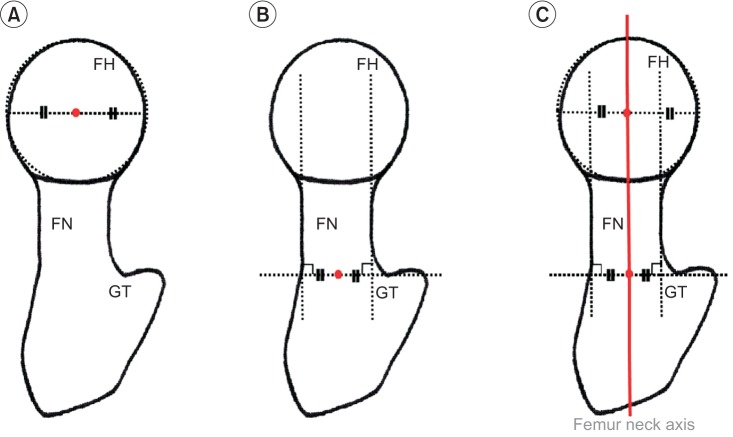
Definition of femur neck axis. From superior view of 3-dimensional computed tomography, a diagram was constructed. Femur was hypothesized as a circle, and a line that links two points of the circle and passed the center of the circle was drawn (A). Femur neck was hypothesized as a cylinder, and two lines extended from cylinder were drawn. Then, one horizontal line that was closest to the greater trochanter from femur neck and tangential to the two extended lines, was drawn. A point that bisected this line is the center of neck (B). Femur neck axis (thick red line) was defined as a line that connected the two central points (C). FH, femur head; FN, femur neck; GT, greater trochanter.
For the condylar angle, the angle of medial and lateral condylar axis against the horizontal axis was measured, and similarly the medial and lateral condylar axis, the reference axis for distal, was set as the line tangent to the most posterior aspects of medial and lateral condyles of distal femur from the caudocranial of the 3D image (Fig. 4). The FAA was then calculated by subtracting the condylar angle from the femur neck angle if they were in the same direction against the horizontal axis, and by adding the 2 angles if in the opposite direction (Fig. 5).
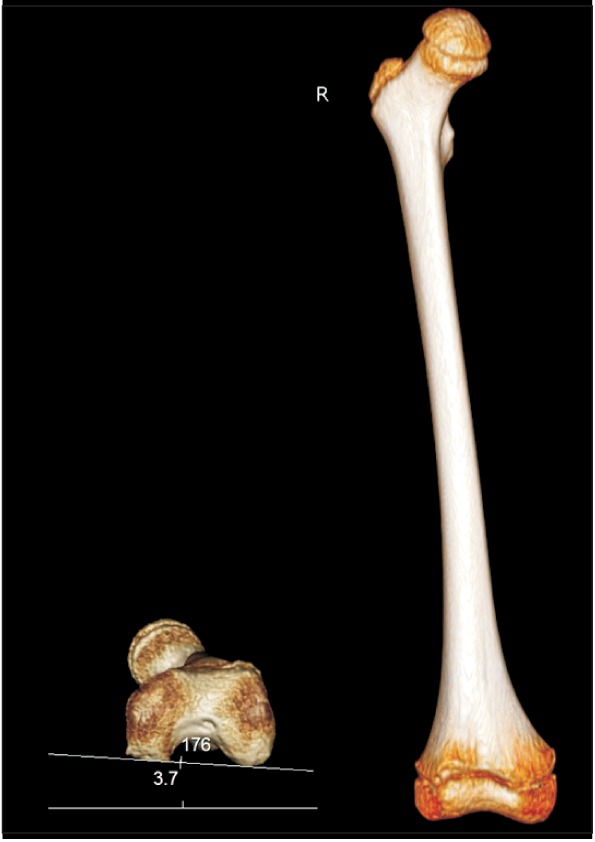
The angle between the intercondylar axis of the distal femur and horizontal line is defined as condylar angle. R, right.
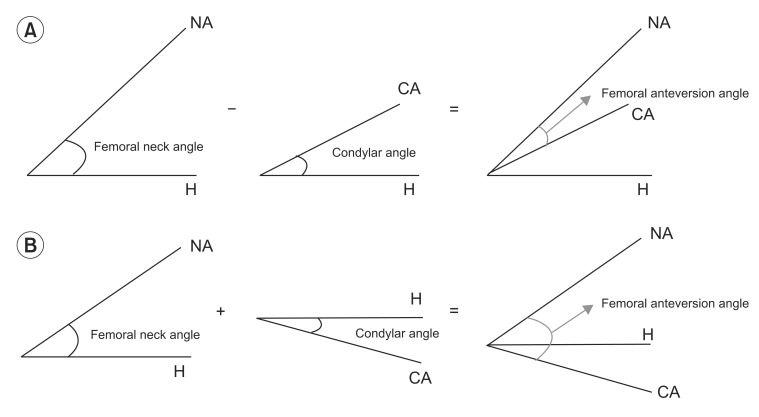
Femoral anteversion angle was calculated as subtraction of the femoral neck and condylar angles when the two horizontal axis were in the same direction (A), and as summation when the two angles were in the opposite direction (B). H, horizontal axis; NA, femoral neck axis; CA, condylar axis.
The 2 angles (femur neck angle and condylar angle) against each of the left and right femurs of the 2 raters were measured (first session). The process was repeated after one day with the change of orders of the patients being measured (second session) by the raters who were blinded to their first measured value and that of the other rater. The intra-rater reliability was determined with the measurements obtained from the 2 sessions, and the inter-rater reliability was determined by comparing the measured values.
Statistical processing
SPSS ver. 19.0 (IBM SPSS, Armonk, NY, USA) was used for the statistical analysis of the reliabilities of inter-raters and intra-raters in the FAA measurement method, using the intraclass correlation coefficient (ICC). For the values of ICC, the following standard was applied: values above 0.75, high reliability; between 0.75 and 0.40, middle reliability; below 0.40, low reliability.
RESULTS
Reliabilities of intra-raters and inter-raters for the method of the femur neck angle measurement using 3D-CT
The correlation coefficient between the first and second session measures of the femur neck angle for the rater A was 0.89, and for the rater B was 0.96 (Table 2); and the correlation coefficient between the 2 raters was 0.89 (Table 3).
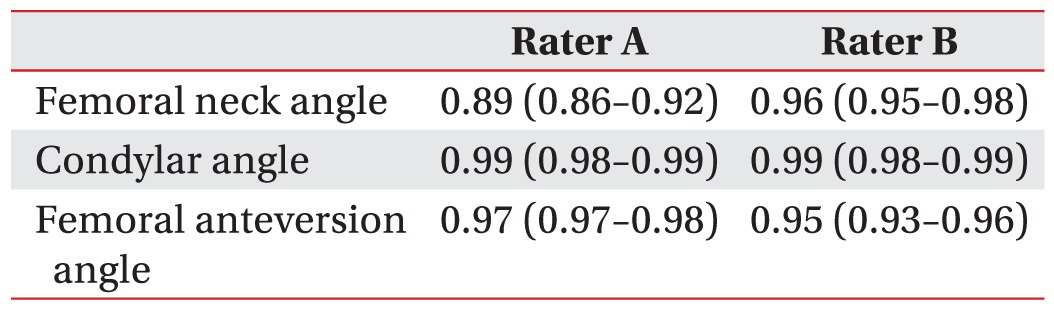
Intra-rater reliabilities of femoral neck angle, condylar angle, and femoral anteversion angle measures between the first session and the second session
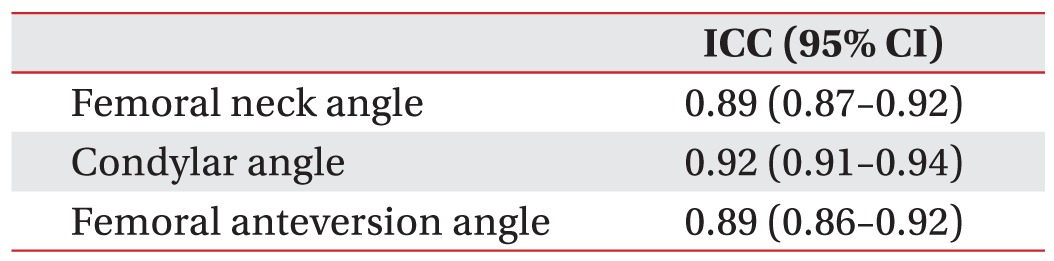
Inter-rater reliabilities of femoral neck angle, condylar angle, and femoral anteversion angle measures between rater A and rater B
Reliabilities of intra-raters and inter-raters for the method of the condylar angle measurement using 3D-CT
The correlation coefficient between the first and second session measures of the condylar angle for the rater A was 0.99, and for the rater B was 0.99 (Table 2); and the correlation coefficient between the 2 raters was 0.92 (Table 3).
Descriptive statistics of FAA measured using 3D-CT
The average value and standard deviation of the FAA for the first and second sessions conducted by the rater A was 27.3±9.5 and 27.2±8.8, respectively; and for the rater B, it was 29.7±9.5 and 30.1±8.6, respectively (Table 4).
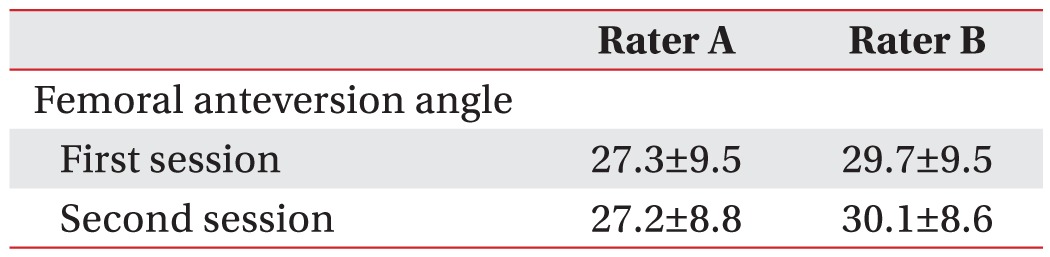
Mean and standard deviation values of femoral anteversion angle by measures using 3D-CT imaging method
Reliabilities of intra-raters and inter-raters for the 3D-CT method of the FAA measurement
The correlation coefficient between the first and second session measures of the FAA for the rater A was 0.97, and for the rater B was 0.95 (Table 2); and the correlation coefficient between the 2 raters was 0.89 (Table 3).
DISCUSSION
The multi-channel CT has a benefit of obtaining images in a short period of time, as the image acquisition can be processed at a rapid rate if the number of sections of the detector increases. Thus, since it acquires images using multi-channels in a brief period of time, the corresponding radiographic exposure is smaller in comparison with the sequential scanning technology. In addition, it includes all the anatomical details of the scanned area allowing the attainment of the volume data, which can be used to reconstruct the 3D image with the aid of 3D image processing technique [18].
The FAA can be increased or decreased in various diseases such as intoeing gait, congenital hip dislocation, polio, and cerebral palsy. Thus, its measurement is clinically important and requires accurate assessment. Several research studies on FAA measures used various methods with different merits and demerits, accuracy, and reliability; however, most methods had low reliability. However, 3D-CT reconstruction reportedly has high accuracy and reliability. Furthermore, FAA measured directly from the cadaver femur and from the reconstructed 3D-CT, showed high accuracy and reliability [15]. The results of a recent study on patients with cerebral palsy indicated high inter-rater and intra-rater reliabilities of the FAA measurement regardless of the femur neck angle, confirming the usefulness of the 3D-CT reconstruction in the measurement of FAA [19].
Likewise, in this study, the FAA was measured through the 3D-CT reconstruction method, as reported by Kim et al. [17]; the medial and lateral condylar axis was determined as the line tangent to the most posterior aspects of medial and lateral condyles of distal femur from the caudocranial of 3D image. In addition, the reference axis for proximal was determined as the line connecting the 2 center points of the neck of femur and the head of femur, craniocaudally. This standard allows simple and clear identification of the anatomical reference point for the determination of axis for distal than other standards, and is considered to have fewer intra-rater and inter-raters errors. The reliabilities of the intra-raters and inter-raters measured at the femoral neck angle were lower than the condylar angle (Tables 2, 3). This is due to the varying appearances of the neck and head of femur that makes it relatively difficult to determine each of the center points accurately, causing potential errors between the intraraters and the inter-raters. However, the correlation coefficients of the reliabilities of intra-raters and inter-raters were high, i.e., 0.89 for the rater A, 0.96 for the rater B, and 0.89 between the raters, when this standard was applied as well. The correlation coefficients of reliabilities of the intra-raters for the measurement of FAA, the difference between the femur neck angle and condylar angle, was high with 0.97 for the rater A, 0.95 for the rater B, and 0.89 between the raters. The average of FAA values measured twice by each rater were 27.3 and 27.2 in rater A, and 29.7 and 30.1 in rater B, respectively (Table 4). The differences between 2 raters' measurements were from 2.4 to 2.9. The differences might be caused by measurement error, since the femoral head and femoral neck used for the femur neck angle measurement, are irregular circle and irregular cylinder, respectively. Also, the difference between first and second values of average FAA in rater A and rater B might be due to the similar pattern used by each rater at each time, which resulted in consistent differences. The measurement method itself may cause inevitable differences between raters due to the irregular surface characteristics. This might lead to different measurement methods used by each researcher of different centers. However, the differences between the 2 raters' measurements were acceptable, since angle differences were <3°, and angle differences of same raters were almost the same at each measurement. Therefore, this measurement method would be clinically acceptable. The 3D-CT method to measure the femur neck angle and condylar angle, as well as the difference (FAA) can be useful for accurate clinical diagnosis and monitoring the progress. The radiological FAA measurement using 3D-CT in this study is relatively convenient, fast and accurate, as compared with conventional methods.
However, the 3D-CT has some disadvantages since it can only be conducted in large hospitals and not in primary care facilities, and is more expensive than other diagnostic tools. Furthermore, even though the CT scan for the legs and arms has lower risk for the incidence of diseases like leukemia and brain tumor among children under the age of 10 years, due to radiographic exposures, as compared to the CT scans for brain, chest, and abdomen [20], frequent scanning needs to be avoided, as it may instantly increase the possibility of radiographic exposure.
In conclusion, the 3D-CT method for measuring the FAA showed high intra-rater and inter-rater reliabilities and can be considered for use in children with intoeing gait to compare with normal young children, as well as for deciding treatment criteria for intoeing gait in the future. It may also be used for the diagnosis of patients under the risk of intoeing gait with an increased FAA and for determining treatment effect and follow-up exams.
Notes
CONFLICT OF INTEREST: No potential conflict of interest relevant to this article was reported.