Influence of Low Peak Respiratory Exchange Ratio on Cardiac Rehabilitation in Patients With Coronary Artery Disease
Article information

Abstract
Objective
To compare and analyze the effects of cardiac rehabilitation (CR) in two groups based on the peak respiratory exchange ratio (RERpeak) 1.1 values using the exercise tolerance test (ETT) results, and to investigate the reasons for early termination of ETT.
Methods
Patients with acute coronary syndrome who participated in CR exercise training were selected and all subjects underwent 6 weeks of CR exercise training. ETT was performed on a treadmill using a Modified Bruce Protocol before and after CR exercise training. According to the result of the first ETT, the subjects were divided into two groups: those with an RERpeak≥1.1 (n=33) and those with an RERpeak<1.1 (n=22). We investigated the reasons for ETT termination and compared the effect of CR between the groups.
Results
The reasons for the early termination of the first ETT in the RERpeak<1.1 group were subjective dyspnea, abnormal cardiovascular responses, leg fatigue and other problems. After a 6-week CR, the peak oxygen consumption (VO2peak) and ETT time increased, and the rate of perceived exertion (RPE) and RPP (rate pressure product) at stage 3 decreased in both the RERpeak<1.1 and RERpeak≥1.1 groups.
Conclusion
CR exercise training improved exercise capacity, not only in the RERpeak≥1.1 group, but also in the RERpeak<1.1 group. This means that patients with a lower exercise tolerance could also benefit from the effects of CR. Thoughtful consideration to identify the direct and indirect causes for the early termination of ETT would be necessary to improve the efficiency of CR.
INTRODUCTION
Appropriate cardiac rehabilitation (CR) exercise training improves functional capacity and reduces mortality rates and the recurrence of acute coronary syndrome (ACS) [1]. The exercise tolerance test (ETT) is generally used as a preliminary test for diagnosing coronary artery disease; but, in the context of CR, it is conducted to assess patient function, determine the effects of recent treatments, including coronary intervention or cardiac surgery, evaluate prognosis, and obtain information regarding exercise prescription [2].
Of the various indicators obtained from ETT, peak oxygen consumption (VO2peak) is an important prognostic factor that serves as an indicator of improved cardiopulmonary function after CR. However, the value of VO2peak is inaccurate if the patient makes insufficient effort in the test or if the test is ended prematurely. This limitation requires the assessment of patient efforts in the ETT, and reaching an established requirement of 85% of the age-predicted maximal heart rate (HR). The method, however, has a lower accuracy due to a broad error range (±12 beats/min) and is difficult to apply, especially in patients using beta-blockers. Aside from HR, the respiratory exchange ratio (RER), defined as the ratio of carbon dioxide production (VCO2) and oxygen consumption (VO2) measured via respiratory gas analysis, is an objective indicator. It is considered the minimal sufficient condition when the peak RER (RERpeak; the RER value at the end of the test) is ≥1.10 [3].
Patients with a lower RERpeak might not reach the peak ETT value, and few research studies have investigated whether such patients show insufficient benefits from the CR program or have enhanced exercise tolerance because of the CR program. The aims of this study are to compare and analyze the effects of CR in two groups based on the RERpeak 1.1 values using the ETT results before and after CR training, investigate the reasons for ending the ETT in the two groups, and identify the effects of a lower peak RER on CR.
MATERIALS AND METHODS
Subjects
The medical records of subjects enrolled in the CR clinic between January 2012 and April 2014 were retrospectively analyzed. Subjects who participated in a CR program after undergoing successful percutaneous coronary intervention (PCI) with a drug-eluting stent, were recruited. Among them, patients who completed a 6-week CR program (a total of 18 sessions), and underwent ETT before and after CR, were chosen as study subjects. Patients with cerebrovascular disease, balance dysfunction, musculoskeletal disorders that limit gait, or changes in medications taken during the study period, were excluded from this study. Among the 81 participants who were chosen as subject candidates, 26 were excluded from the analysis due to incomplete medical records, including gas analyzing data and missing data of reasons for termination, etc. Therefore, a total of 55 subjects were ultimately selected as study subjects and divided into two groups according to the first ETT: those with an RERpeak<1.1 (n=33) and those with an RERpeak≥1.1 (n=22).
Each subject's age, sex, body mass index (BMI), left ventricular ejection fraction (LVEF), presence of cardiovascular (CV) risk factors (diabetes, hypertension, dyslipidemia, and/or heart failure [HF]), rate of myocardial infarction and unstable angina in ACS, and medications taken were collected.
Exercise testing
The first day that the patient visited the CR clinic after discharge, symptom-limited ETT was conducted using a Modified Bruce Protocol and VO2peak, exercise time, resting HR, peak HR, resting blood pressure (BP), peak BP, rate pressure product (RPP), RER, and the rate of perceived exertion (RPE) were measured. A real-time recording 12-channel electrocardiograph (Q4500; Quinton Instrument Co., Boston, MA, USA), respiratory gas analyzer TrueOne 2400 metabolic measurement system (Parvo Medics Inc., East Sandy, UT, USA), an automatic blood pressure and pulse monitor Model 412 (Quinton Instrument Co.), and a treadmill MedTrack ST55 (Quinton Instrument Co.) were used for the ETT. All tests were terminated according to the American Heart Association (AHA) termination criteria and the patients were instructed about the termination of ETT before the test. When the test was close to the end, patients were encouraged to endure the test and to stop only when experiencing intolerable dyspnea, unless there was an event which met the ETT termination criteria from the AHA guidelines.
Exercise training
The patients participated in the CR program for 6 weeks. Exercise intensities of 40% and 85% HR reserve were calculated using the Karvonen formula—([maximal HR–resting HR×%intensity]+resting HR)—based on the results obtained during the first ETT. The CR program was composed of 10 minutes of warm-up (stretching), 40 minutes of main aerobic exercise, and 10 minutes of cool down, three times a week for 6 weeks, for a total of 18 sessions. Following the completion of the 6-week CR programs, ETT were performed again. VO2peak, ETT time, resting HR, peak HR, resting BP, peak BP, RER, RPP, and RPE were measured again during the second ETT. The ETT results of the RERpeak<1.1 and RERpeak≥1.1 groups were then compared.
Statistical analyses
Statistical analyses were performed using the SAS ver. 4.2 statistical analysis program (SAS Institute Inc., Cary, NC, USA). The patients' sex, medication, rate of myocardial infarction and angina pectoris in coronary artery disease, presence of CV risk factors (diabetes, hypertension, dyslipidemia, and/or HF), and number of occluded coronary arteries were compared using the χ2 test. The mean BMI, LVEF, age, ETT time, VO2peak, resting HR, peak HR, peak RPP, RPP at stage 3 were compared by independent t-test. However, the peak RPE, and RPE at stage 3 were not normally distributed according to the Kolmogorov-Smirnov test or the Shapiro-Wilk test, and were analyzed using the Mann-Whitney U-test. Comparisons of the variables before and after CR were assessed by paired t-test. However, peak RPE were not normally distributed according to the Kolmogorov-Smirnov test or Shapiro-Wilk test, and were analyzed using the Wilcoxon signed-rank test. The reasons for ETT termination were recorded, and the frequency of each reason between groups was compared using the χ2 test. The frequency of the reasons for terminating ETT before and after CR were compared using the McNemar test. To determine the presence of an interaction of time with the group in VO2peak, a repeated-measure ANOVA model was performed. To determine the interaction in VO2peak after adjusting different baseline demographic characteristics, a linear mixed model was performed. The p-values less than 0.05 were considered as statistically significant.
RESULTS
Subject demographic and clinical characteristics
The subjects' characteristics are presented in Table 1. The RERpeak<1.1 and RERpeak≥1.1 groups were similar for most variables, such as sex, medication taken, rate of myocardial infarction and unstable angina in ACS, presence of CV risk factors (diabetes, hypertension, dyslipidemia, and/or HF), and the number of occluded coronary arteries, with the exception of age and BMI. The average subject age in the RERpeak<1.1 group (66.6±8.0 years) was older than that of the subjects in the RERpeak≥1.1 group (61.4±7.2 years). The BMI of the RERpeak<1.1 group (25.4±3.7 kg/m2) was higher than that of the RERpeak≥1.1 group (23.7±2.2 kg/m2).

Subjects' baseline demographic characteristics
Comparison of the exercise parameters between groups
Table 2 shows the changes in exercise parameters between the groups before and after CR. In the first and second ETT, the mean resting HR, resting systolic and diastolic BP, peak systolic and diastolic BP, RPP at stage 3, and RPP peak were not different between the two groups. In the first ETT, the peak HR was 122±16 beats/min in the RERpeak<1.1 group and 140±20 beats/min in the RERpeak≥1.1 group. In the second ETT, the peak HR was 131±18 beats/min in the RERpeak<1.1 group and 146±17 beats/min in the RERpeak≥1.1 group. The intergroup difference of the peak HR was significant in the first and second ETT.

Exercise parameters pre- vs. post-cardiac rehabilitation
In the first ETT, the RPE at stage 3 was higher in the RERpeak<1.1 group (12.4±2.5) than RERpeak≥1.1 group (10.2±2.6). In the second ETT, the RPE at stage 3 in the RERpeak<1.1 group (10.2±2.6) was also higher than the RERpeak≥1.1 group (8.5±1.9). In the first ETT, VO2peak was lower in the RERpeak<1.1 group (21.2±6.2 mL/kg/min) than RERpeak≥1.1 group (25.0±5.9 mL/kg/min). In the second ETT, the VO2peak was also lower in the RERpeak<1.1 group (23.6±8.4 mL/kg/min) than the RERpeak≥1.1 group (29.6±5.9 mL/kg/min).
In the first ETT, RERpeak was lower in the RERpeak<1.1 group (1.00±0.06) than the RERpeak≥1.1 group (1.17±0.07). In the second ETT, the RERpeak was also lower in the RERpeak<1.1 group (1.08±0.09) than in the RERpeak≥1.1 group (1.15±0.12).
In the first ETT, the exercise time was shorter in the RERpeak<1.1 group (676±195 seconds) than the RERpeak≥1.1 group (872±150 seconds). In the second ETT, the exercise time was shorter in the RERpeak<1.1 group (845±163 seconds) than the RERpeak≥1.1 group (978±116 seconds).
Comparison of the exercise parameters before and after CR
The mean resting HR, resting systolic and diastolic BP, peak systolic and diastolic BP, and RPEpeak in each group were not different before, versus after CR.
The peak HR and RPP peak were increased in the RERpeak<1.1 group during CR, but it did not differ from that of the RERpeak≥1.1 group.
RPE at stage 3 was decreased during CR in the RERpeak<1.1 and RERpeak≥1.1 groups. The RPP at stage 3 decreased from 15,994±3,961 to 13,628±4,471 in the RERpeak<1.1 group and from 14,779±3,846 to 13,079±3,602 in the RERpeak≥1.1 group, during CR. There was a significant increase in exercise time in both groups following the 6-week CR exercise training.
After the 6-week CR exercise training, the VO2peak values were increased in both groups (p<0.01). No VO2peak interaction of time by group was identified by repeated-measures ANOVA, and the rate of change of VO2peak did not differ between the two groups. Also, after adjusting the age and BMI by the linear mixed model, the interaction of time and group of the VO2peak was not significant.
After the 6-week CR exercise training, the RERpeak changed significantly from 1.00±0.06 to 1.08±0.09 in the RERpeak<1.1 group, however in the RERpeak≥1.1 group the RERpeak did not differ during CR (1.17±0.07 to 1.15±0.12).
Analysis of ETT termination reasons
The reasons for ETT termination are shown in Table 3. In the first ETT, the subjects in the RERpeak<1.1 group ceased the ETT due to subjective dyspnea, without an abnormal response (n=15; 45.5%), abnormal CV response, such as hypertensive response, ST elevation, and/or ST depression (n=6; 18.2%), other problems such as headache, dizziness, difficulty keeping a hard grasp, and back pain (n=5; 15.2%), leg fatigue (n=4; 12.1%), inability to keep treadmill pace (n=2; 6.1%), and cardiac origin chest discomfort (n=1; 3%). In the second ETT, the subjects in the RERpeak<1.1 group stopped the ETT due to subjective dyspnea without an abnormal response (n=23; 69.7%), leg fatigue (n=6; 18.2%), inability to keep treadmill pace (n=2; 6.1%), and an abnormal CV response (n=2; 6.1%). In RERpeak<1.1 group, the number of patients who ceased due to subjective dyspnea without an abnormal response was increased during CR (p<0.05).
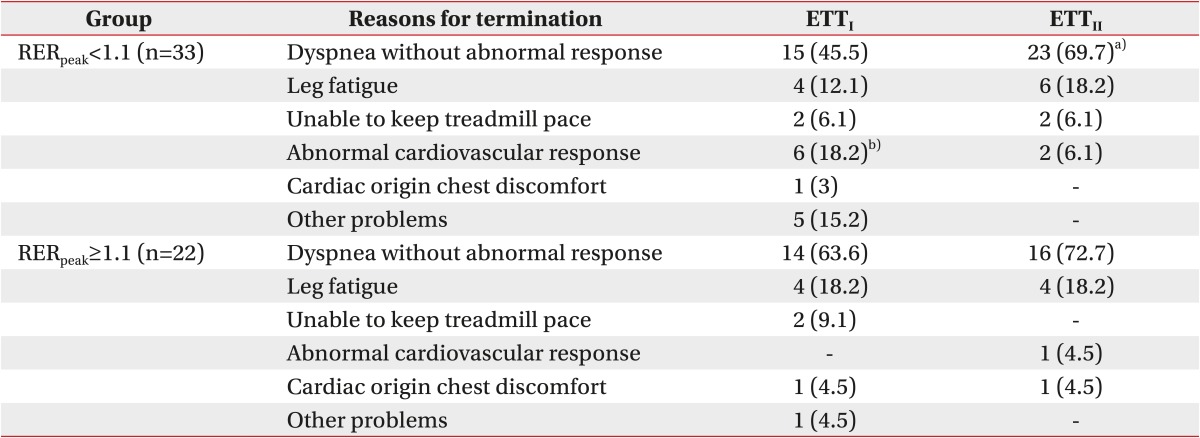
Reasons for termination of exercise tolerance test (ETT)
In the RERpeak≥1.1 group, the patients stopped the ETT due to subjective dyspnea without an abnormal response (n=14; 63.6%), leg fatigue (n=4; 18.2%), inability to keep treadmill pace (n=2; 9.1%), cardiac origin chest discomfort or pain (n=1; 4.5%), or other problems (n=1; 4.5%) in the first ETT. In the second ETT, patients in the RERpeak≥1.1 group stopped the ETT due to subjective dyspnea without abnormal response (n=16; 72.7%), leg fatigue (n=4; 18.2%), cardiac origin chest discomfort or pain (n=1; 4.5%), and abnormal CV response (n=1; 4%). In the first ETT, more patients stopped ETT due to an abnormal CV response in the RERpeak<1.1 group than in the RERpeak≥1.1 group, whereas there was no intergroup difference in the number of patients who stopped the first and second ETT due to other reasons.
Comparison of RERpeak before and after CR as classified by RERpeak=1.1
As for the changes in the RERpeak between the pre- and post-CR, the RERpeak<1.1 group showed an increased RERpeak (1.00–1.08) after CR, but the RER<≥1.1 group did not show any difference (1.17–1.15) when the subjects were classified using the first ETT. We saw subjects whose RER≥ was <1.1 in the second test after CR; in order to identify the patients' characteristics, they were classified using RERpeak=1.1 in the second test. When RERpeak=1.1 served as the criterion at the second test, the RERpeak values of the RERpeak<1.1 group (n=27) did not differ between the pre- and post-CR (1.04–1.02), whereas that of the RERpeak≥1.1 group (n=28) was increased after the CR (1.10–1.20) (Table 4).
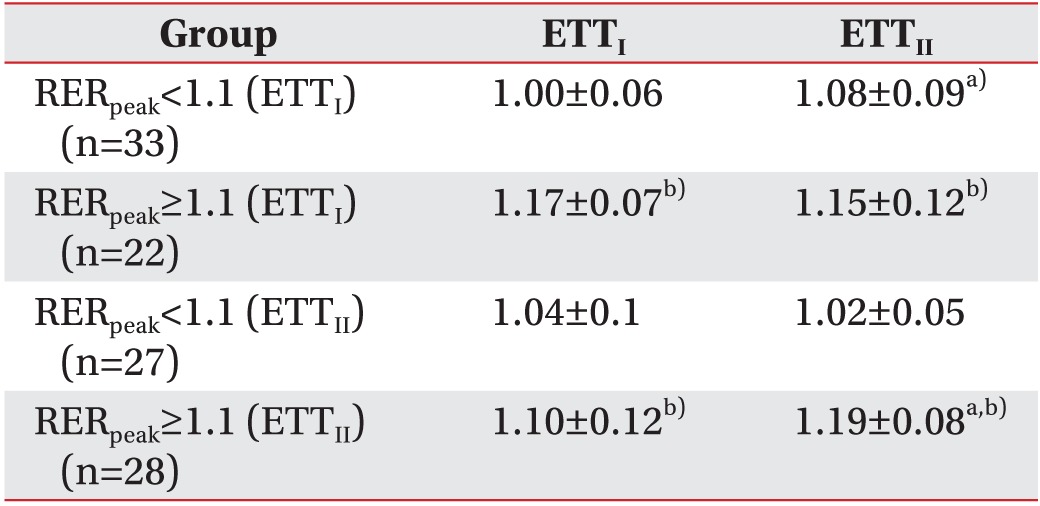
Changes in RERpeak before and after cardiac rehabilitation
DISCUSSION
ETT is widely used to assess various patients with cardiac disease, estimate its severity, assess patient function and prognosis, determine the effects of various CR treatments, and obtain information about exercise prescriptions [2]. The resulting test values are affected, depending on the subjects' abilities to reach sufficient exercise intensity levels. The RER is used as an objective measure to determine whether a person sufficiently achieves their maximal functional capacity. The RER is defined as the ratio of VCO2 and VO2, with values of 0.7–0.8 at a lower exercise level, 1.0 at a moderate exercise level, and 1.1–1.3 at a high exercise level [4]. If the RERpeak exceeds 1.0, additional energy is supplied anaerobically, during which induced metabolic acidosis occurs, to increase VCO2 [5]. Previous studies have usually focused on the importance of the RERpeak in ETT in the context of HF because patients with HF generally have difficulty reaching RER≥1.0 during ETT, in such cases, the test results are deemed insufficient for estimating prognosis. Rostagno et al. [6] reported that one-third of patients with HF were unable to reach the minimal sufficiency requirement (e.g., RER≥1.10).
Based on the existing guideline, RERpeak=1.10 is the minimum effort requirement for ETT [3]. In Chase et al. [7], in which 1,728 patients with HF served as subjects, while an RERpeak≥1.05 was the indicator of maximum effort of the patients. The authors determined that the RERpeak≥1.00 was likely to be acceptable and RERpeak<1.00 was unacceptably submaximal [7]. Previous reports [891011] determined that RERpeak≥1.00 was the indicator of proper effort from HF patients. Meanwhile, the guideline of the AHA on ETT considered RERpeak≥1.10 the maximal functional capacity of patients [12], a guideline that we followed in this study since we used RERpeak=1.10 as the requirement.
The demographic data of the two groups, the RERpeak<1.1 group showed a higher age and BMI than the RERpeak≥1.1 group, indicating that the two factors affected the RERpeak. Other demographic data and CR program processes were found to be identical between the two groups.
In a comparison of the two groups, the peak HR, RPE at stage 3, VO2peak, RERpeak, and exercise time were different between the two groups, in both the first and second ETT. As the subjects in the RERpeak≥1.1 group showed more sufficient effort on the ETT, it was shown as a longer exercise time, higher peak HR, and a higher VO≥ than the RERpeak<1.1 group. As the RPE at stage 3 was lower in the RERpeak≥1.1 group than the RERpeak<1.1 group, the subjects in the RERpeak≥1.1 group were more tolerable to submaximal effort exercise than the RERpeak<1.1 group.
After the 6-week CR, both groups showed a higher VO2peak than that of the first ETT. The RPE at stage 3 in both groups decreased from pre- to post-CR exercise training, indicating improved subjective functional capacity in the submaximal effort. The RPP at stage 3 in both groups also decreased after CR, indicating that the RPP in the submaximal effort decreased and the resistance of cardiac function against exercise increased. No interactions in VO2peak between the two groups were identified by repeated-measure ANOVA, and, using the linear mixed model to adjust the age and BMI indicating that there was no difference in the change in the rate of VO2peak. The effects of the CR were expected to be relatively lower in the RERpeak<1.1 group due to their lower exercise tolerance, but the change in rate in VO2peak did not differ between groups, indicating that the effects of CR were similar between groups.
While the RERpeak is estimated in the ETT, the reasons for ETT ending are also recorded to identify abnormal reactions, such as dizziness, cyanosis, and chest pain to identify risk factors such as decreased BP or arrhythmia and identify whether there are factors, such as knee pain or claudication that inhibit achieving the maximal functional capacity. When such limiting factors are identified, a more accurate ETT can be conducted using pain control, changing exercise methods, and/or customizing the exercise prescription based on the patient's condition. When other abnormal reactions do not occur, the ETT is continued until the patient almost achieves the maximal cardiopulmonary functional capacity and is only stopped when subjective dyspnea occurs. For both groups in the first and the second ETT rounds, the most common reason for stopping the ETT was dyspnea without an abnormal response (Table 3). In the first ETT of the RERpeak<1.1 group, the second most common reason for stopping the test was abnormal CV response and other problems, whereas in the second ETT, the second most common reason for stopping the test was leg fatigue in both groups. Such results may be due to inappropriate hemodynamic reactions or arrhythmias that were more common in the first test and various other reasons for stopping the exercise, such as headache and back pain that occurred because of a general deconditioning. Although the RERpeak≥1.1 group stopped the ETT when subjects reached the sufficient exercise effort requirement, 7 (36%) subjects stopped the ETT due to of reasons other than dyspnea, indicating that one third of the group could reach the RERpeak of 1.1, even for reasons other than dyspnea. Meanwhile, the RERpeak<1.1 group stopped the exercise without reaching the exercise effort requirement, and only 15 (45.5%) subjects stopped the test due to dyspnea without an abnormal response in the first ETT. The number of subjects that stopped the second ETT because of dyspnea without an abnormal response increased from 15 to 23 (69.7%) in the RERpeak<1.1 group (p<0.05). We stopped the ETT when the absolute or relative termination criteria [13] of the AHA regarding patient safety were met. In the RERpeak<1.1 group, an abnormal CV response was the second most common reason for stopping the test before CR; in contrast, it was the third most common reason for stopping the test (after dyspnea and leg fatigue) after CR.
Previous research of RER and cardiac disease has usually focused on the RERpeak values of HF patients [78] rather than the peak RER, however the submaximal RER is important for a proper understanding of the relevance of ETT and the significance of RER after exercise training. Submaximal RER is affected by functional capacity; subjects whose physical activities were vigorous who were undergoing exercise training showed a lower RER at submaximal exercise intensity compared with those who were not [1415]. Additionally, endurance training improves the activities of oxidizing enzymes, delaying the time to reach fatigue during exercise, lowering the submaximal RER [16], indicating that a lower RER alone does not necessarily indicate a lower functional capacity, but that the subject does not reach his/her personal maximal exercise effort. A lower RERpeak in ETT is usually considered as a lower functional capacity, but if the test is stopped prematurely, the termination might not be attributable to the maximal RER reached, but instead to the patient's submaximal RER. This is why it is important to identify the reason for ETT termination. When ETT was conducted in our CR clinic, some factors indirectly affect termination. First, most patients complained of discomfort and stuffiness when wearing a face mask for gas analysis, saying, “I could do more exercise without this mask.” Although all subjects wore face masks, the discomfort and adaptability varied subjectively among subjects. Second, patients who had recently overcome cardiac events usually stopped the test because of chest discomfort, dyspnea, or other symptoms that can be generally endured, due to “fear of another cardiac event.” Third, some subjects terminated the test even when objective indicators, such as HR or RERpeak, were not high enough, because they were presumed to have subjectively lower thresholds for dyspnea.
The RERpeak<1.1 group in the first ETT criterion generally increased the RERpeak post-CR (1.00–1.08). The mean value of the RERpeak<1.1 group in the second ETT criterion, which did not differ even post-CR (1.04–1.02), indicating that some of the subjects in the RERpeak<1.1 group consistently showed a maintained value, even following a 6-week CR exercise training. These phenomena may be due to various direct or indirect factors. It is our opinion that factors affecting RERpeak measurement include, not only situations in ETT as mentioned above, but also individual subject characteristics. As the RER is the ratio of VCO2 and VO2 it may be influenced by multi-organ systems, such as the cardiopulmonary system, vascular system, and the muscular system. Thus, subject characteristics, such as age, sex, BMI, drinking history, smoking history, exercise habits, pulmonary function, muscular, vascular, nervous system, psychological factors, and patient motivation, may influence the RERpeak under the same ETT protocol.
In this study, the RERpeak<1.1 group had a higher mean age and BMI, but no intergroup difference was found in terms of sex and history of drug use. Patients with musculoskeletal and nervous diseases that inhibit gait were excluded from this study. In contrast, drinking history, smoking history, and exercise habit were not investigated, and an estimation of the various causes of lower exercise tolerance, such as mild osteoarthritis, diabetic neuropathy, dysfunction by old age, muscular strength declines, and pulmonary or vascular system dysfunction, was insufficient or difficult. Song et al. [17] reported that patients with accompanying depression showed a lower functional capacity and more frequent dyspnea upon exercising; however, in this study, we did not estimate the psychological factors or motivation. By comparison, according to Chase et al. [7], the RERpeak<1.0 group had a higher mean age than the RERpeak>1.0 group, and according to Ingle et al. [18], the RERpeak<1.0 group included a higher proportion of women.
This study had several limitations: its number of subjects was relatively small, we did not identify patient characteristics and psychological status and could not correlate the difference in RERpeak or VO2peak with psychological factors; and only short-term changes could be identified due to a limited CR duration of 6 weeks. As such, further studies are needed to understand the possible correlation between psychological status and lower RERpeak through a psychological evaluation of motivation or depressive symptoms and the assessment of individual subjects' characteristics on a more multilateral basis. Further investigations on the indirect factors affecting ETT termination may be helpful to improve the clinical usefulness of RERpeak.
In conclusion, we observed that the reasons for early termination of the first ETT in the RERpeak<1.1 group were subjective dyspnea without an abnormal response, an abnormal CV response, other problems, and leg fatigue (in decreasing order). A 6-week CR exercise training could increase the VO2peak and ETT time and decrease the RPE and RPP at stage 3 in both RERpeak<1.1 and RERpeak≥1.1 groups. Thoughtful consideration of how to best identify the direct and indirect causes for early termination of ETT would be required to improve the efficiency of CR exercise training, especially in patients with an RERpeak<1.1.
Notes
CONFLICT OF INTEREST: No potential conflict of interest relevant to this article was reported.