Effect of Epidural Electrical Stimulation and Repetitive Transcranial Magnetic Stimulation in Rats With Diffuse Traumatic Brain Injury
Article information
Abstract
Objective
To evaluate the effects of epidural electrical stimulation (EES) and repetitive transcranial magnetic stimulation (rTMS) on motor recovery and brain activity in a rat model of diffuse traumatic brain injury (TBI) compared to the control group.
Methods
Thirty rats weighing 270-285 g with diffuse TBI with 45 kg/cm2 using a weight-drop model were assigned to one of three groups: the EES group (ES) (anodal electrical stimulation at 50 Hz), the rTMS group (MS) (magnetic stimulation at 10 Hz, 3-second stimulation with 6-second intervals, 4,000 total stimulations per day), and the sham-treated control group (sham) (no stimulation). They were pre-trained to perform a single-pellet reaching task (SPRT) and a rotarod test (RRT) for 14 days. Diffuse TBI was then induced and an electrode was implanted over the dominant motor cortex. The changes in SPRT success rate, RRT performance time rate and the expression of c-Fos after two weeks of EES or rTMS were tracked.
Results
SPRT improved significantly from day 8 to day 12 in the ES group and from day 4 to day 14 in the MS group (p<0.05) compared to the sham group. RRT improved significantly from day 6 to day 11 in ES and from day 4 to day 9 in MS compared to the sham group. The ES and MS groups showed increased expression of c-Fos in the cerebral cortex compared to the sham group.
Conclusion
ES or MS in a rat model of diffuse TBI can be used to enhance motor recovery and brain activity.
INTRODUCTION
Causes of traumatic brain injury (TBI) include a fall (35.2%), traffic accident (17.3%), sports injury (16.5%), violence (10%), and other events (21%) [1]. Treatment modalities for TBI include pharmacological, surgical, hyperbaric oxygen therapy, hypothermia, psychotherapy, and rehabilitation. In recent years, neuromodulation therapy has been of increasing interest as one of the treatment regimens that increase brain activity after TBI [2]. It mainly employs electrical and magnetic stimulation. Representative methods for electrical stimulation of the cerebral cortex include transcranial direct current stimulation (tDCS), epidural electrical stimulation (EES), and paired associative stimulation (PAS). Repetitive transcranial magnetic stimulation (rTMS) is a method that employs magnetic fields. EES is a method in which an electrode is implanted in the epidural or subdural space for stimulation. This method is advantageous in that continuous stimulation can be applied concomitant with rehabilitation training [3]. rTMS is a non-invasive treatment modality in which stimulation is applied to various types of nerve tissues [4]. Recent studies have demonstrated that rTMS is effective in improving motor, verbal and memory functions in patients with stroke [56]. But there is a great discrepancy in the pathophysiology between TBI and stroke. TBI originates from injuries in superficial layers of the brain and progresses to the deep layers with acceleration and deceleration. Only one study has attempted neuromodulation therapy for animals with TBI [7]. To date, however, no studies have reported the effects of the therapy in models of diffuse TBI. Therefore, through an experimental trial, we aimed to establish the baseline data for an animal model with diffuse TBI on EES and rTMS.
Given the above background, we conducted the present study to assess the effects of EES and rTMS in an animal model of diffuse TBI. To do so, we created an experimental model of diffuse TBI using a weight drop model in rats. We performed EES and rTMS in an attempt to examine the extent of the recovery of motor function and brain activity.
MATERIALS AND METHODS
Materials
The current study was conducted with 30 male Sprague-Dawley rats (10 rats per group) aged eight weeks and weighing 270-285 g. Each of the rats were bred and examined according to the guide for animal experiments edited by the Korean Academy of Medical Science and the Institutional Animal Care and Use Committee of Presbyterian Medical Center, Jeonju, Korea [7]. For 14 days prior to the induction of TBI, the rats were trained on the single-pellet reaching task (SPRT) and the rotarod test (RRT). Using a randomization program (Research Randomizer Form v4.0, www.randomizer.org/form.htm), the rats were randomly assigned into three groups: the EES group (ES), the rTMS group (MS), and the sham, by a member who was not involved in the processing or analysis of the data. Ten pellets were presented one after another and the dominance of the rat's forepaw was evaluated during the process of picking up the pellets before injury. The opposite side of the brain was assumed to be the dominant hemisphere.
The creation of an animal experimental model of TBI using rats
The rats were anesthetized with tiletamine hydrochloride (60 µg/g) and fixed in a prone position using a Model 900 Small Animal Stereotaxic Instrument (David Kopf Instruments, Tujunga, CA, USA). Following exposure of the skull, a metallic disc of 20 mm in diameter and 2 mm in thickness was placed on the bregma. Using a device designed by Marmarou et al. [8] and Foda and Marmarou [9], we inserted a tube catheter of 120 cm in length and 22 mm in diameter. Then, we made two holes in the tube catheter at a gap distance of 5 cm to minimize air resistance. As proposed by Ucar et al. [10], we dropped an object of 450 g in weight onto the rat's head from a height of 1 m, inducing diffuse TBI. A total of 51 rats were used for the experimental procedure and 21 died of skull fracture and subsequent bleeding.
Implantation of an electrode
Following the creation of TBI, A metal electrode of 3 mm in diameter (Oscor, Tampa, FL, USA) was implanted in the epidural space of the dominant motor cortex of all anesthetized rats and the scalp was sutured. Then, we monitored changes in respiratory function, episodes and other adverse effects [7].
EES
An electrode was connected to an electrical stimulator (HSRG Neuro; Cybermedic, Iksan, Korea) (Fig. 1). The voltage corresponding to 50% of the movement threshold [5] was used as the magnitude for the therapeutic stimulation. We selected a frequency of 50 Hz, a pulse duration of 194 µs, and continuous anodal stimulation for 24 hours a day, administered to the ES group between days 1 and 14 following the onset of TBI [7]. During the stimulation, there were no abnormal movements of the head and extremities or muscle contractions.
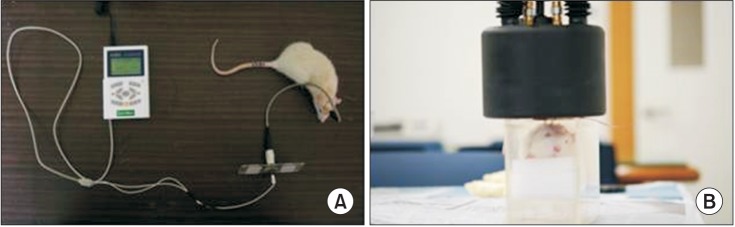
Application of continuous epidural electrical stimulation (A) and repetitive transcranial magnetic stimulation (B) in the traumatic brain injured rat model.
rTMS
The rats were placed in a customized mount in which the head and body were immobilized. The center of the magnetic stimulator (BioCon-1000C; Mcube Technology, Seoul, Korea) was placed on the bregma and positioned 1 cm away from the skull (Fig. 1). The magnetic coil had an oval shape with a width of 90 mm, a height of 60 mm, and a thickness of 7 mm. The magnitude of the maximum magnetic field was 1 Tesla. Between days 1 and 14 following the onset of TBI, we applied stimulations with an intensity corresponding to 90% of the maximal intensity and a frequency of 10 Hz for three seconds followed by a 6-second resting period. The stimulations were performed for 10 minutes in the morning and 10 minutes in the afternoon, with a total of 4,000 stimulations a day. During the stimulations, there were also no abnormal incidents.
Evaluation
Confirmation of the occurrence of TBI
Within 24 hours after the creation of a rat model of diffuse TBI, we performed a limb placing test [11] (Table 1) and compared the degree of TBI between the three groups.
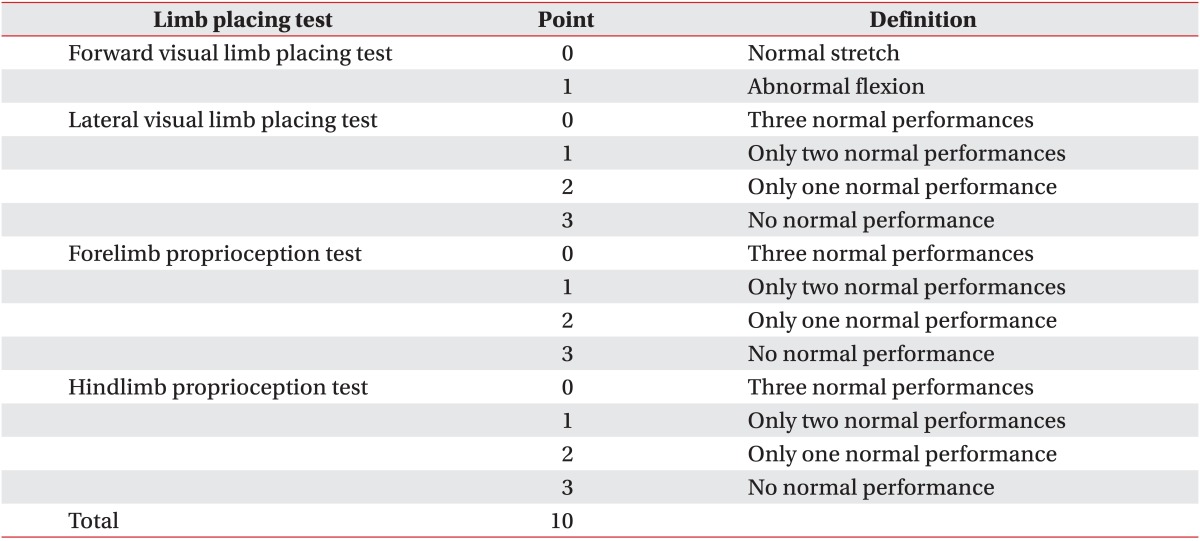
Limb placing test
SPRT
To acclimatize the rats to the food, we provided 20 pellets for 14 days for 20 minutes each in the morning and in the afternoon. The location of the food was adjusted to allow the rats to use their dominant forepaw [12]. To ensure that the rats underwent both electrical stimulation and SRPT, we prepared a customized box [13]. We analyzed the success rate recorded from the afternoon session, which was based on the amount of food the rats ingested after using their front paws to successfully transport the food to their mouths.
RRT
The rotarod was composed of five cylinders and the velocity was gradually increased at a rate of 1 rpm/2 seconds from 1 to 60 rpm for a maximum of 5 minutes. The rats were placed on the cylinder and subjected to a training session [14]. The mean value of three average times prior to the onset of TBI was compared with the value after TBI, based on the percentage values.
Histopathologic examination
At the end of the 2-week experimental period, all rats were anesthetized with a phenobarbital intramuscular injection and euthanized using the transcardiac perfusion method. The brain tissue was promptly extracted and fixed in a 4% paraformaldehyde (PFA) and 30% sucrose solution for more than 12 hours. After that, the tissue was sectioned along the coronal plane and stained using a hematoxylin & eosin dye. This was followed by a histopathologic examination in which the light microscopic findings were enlarged under low-to-high magnification.
Immunohistochemical staining
To assess the expression of c-Fos [15], we performed an immunohistochemical staining of 40-µm thick tissue sections on the coronal plane from 4 mm anterior to 4 mm posterior of the motor cortex [6]. All tissues were stained through complex processes [7]. Following staining, we performed a light microscopy of the brain tissue samples and examined the expression of c-Fos between the left and right sides within the same group and among groups the evaluated the degree of c-Fos expression.
Statistical analysis
Statistical analysis was done using SPSS ver. 14 (SPSS Inc., Chicago, IL, USA). To test the statistical significance in the improvement of the SPRT success rate and the RRT performance time rate, we used a repeated measure analysis of variance (ANOVA). To compare the results of the limb placement test and the results from each day of SPRT and RRT, we used one-way ANOVA with the Bonferroni post-hoc test. A p-value of <0.05 was considered statistically significant. All data were expressed as mean±standard deviation.
RESULTS
Limb placement test
The total scores for the limb placement test on postoperative day 1 were 9.8±0.42 in the ES group, 9.7±0.48 in the MS group, and 9.6±0.52 in the sham group, with no significant differences among the three groups (p>0.05). This indicates that a similar degree of neurological deficits occurred in all three groups.
SPRT success rate
Prior to the onset of TBI, there were no significant differences in mean SPRT success rates between the three groups (p>0.05). All three groups had 0 points until postoperative day (POD) 3. The SPRT success rate increased significantly in the ES and MS groups compared to the sham group (p<0.05, repeated measures ANOVA). Between POD 8 and 12, SPRT success rate was significantly higher in the ES group than in the sham group (p<0.05). In the MS group, the improvement in the SPRT success rate was significantly higher between postoperative days 4 and 14 (p<0.05). Particularly in the MS group, as compared with the other two groups, the change in the success rate reached statistical significance on both POD 4 and 5 (p<0.05) (Fig. 2).
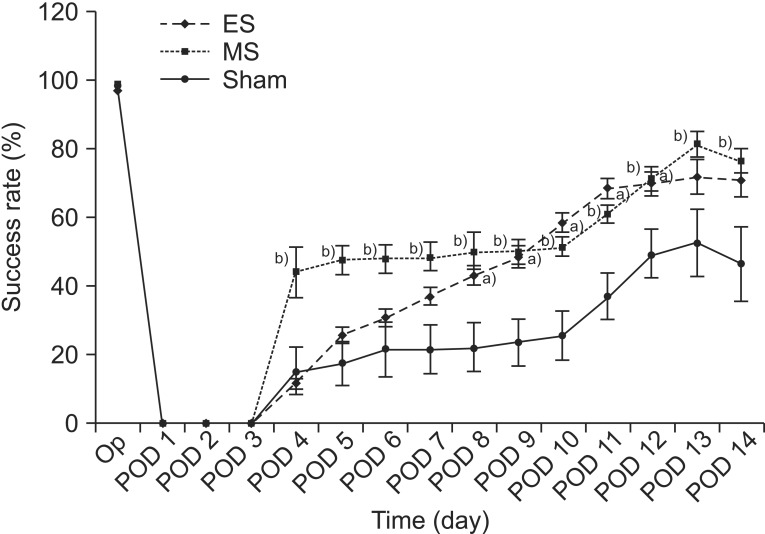
The success rates of the single-pellet reaching task (SPRT) in the ES, MS, and sham groups. The success rate of the ES group was significantly higher between day 8 and day 12 while that of the MS group was significantly higher from day 4 to day 14. Note that the success rate of SPRT in the MS group increased significantly compared to the other two groups between day 4 and day 5. a)p<0.05 by one-way analysis of variance (ANOVA) with post-hoc comparison between the ES and sham groups, b)p<0.05 by one-way ANOVA with post-hoc comparison between the MS and sham groups. ES, electrical stimulation; MS, magnetic stimulation; Op, operation; POD, postoperative day.
RRT performance time rate
Prior to the onset of TBI, there were no significant differences in the time rate for RRT between the three groups (p>0.05). The RRT performance time rate increased significantly in the ES and MS groups compared to the sham group (p<0.05, repeated measures ANOVA). In the ES group, the time rate was significantly longer compared with the sham group between POD 6 and 11 (p<0.05). The time rate for the ES group was significantly longer than that of both groups between POD 8 and 10 (p<0.05). In the MS group, the time rate was significantly longer compared with the sham group between POD 4 and 9 (p<0.05) and was longer than the other two groups on POD 4 (p<0.05). On POD 14, however, there was no significant difference between the three groups (p>0.05) (Fig. 3).
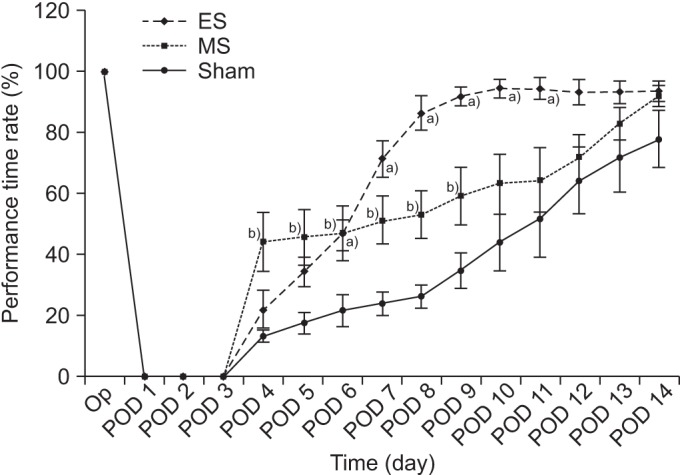
The average time for the rotarod test (RRT) in the ES, MS, and sham groups. The average time for RRT in the ES group was significantly longer than in the sham group from day 6 to day 11, while that of the MS group was significantly longer than that of the sham group from day 4 to day 9. The MS group showed a more significant increase in average RRT time compared to the other two groups on day 4, whereas the ES group showed a more significant increase than the other two groups between day 8 and day 10. a)p<0.05 by one-way analysis of variance (ANOVA) with post-hoc comparison between the ES and sham group, b)p<0.05 by one-way ANOVA with post-hoc comparison between the MS and sham group. ES, electrical stimulation; MS, magnetic stimulation; Op, operation; POD, postoperative day.
Histopathologic findings
Microscopically, there were varying degrees of hemorrhage, coagulation necrosis, and cystic changes in the necrotic tissue in addition to vacuolization due to neuronal degeneration (Fig. 4).
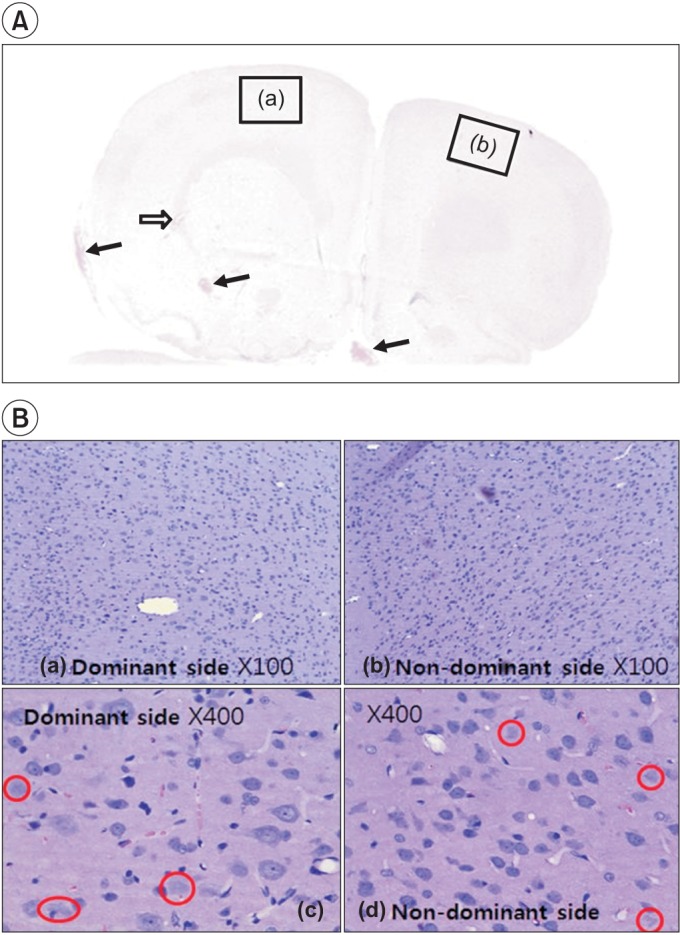
Hematoxylin-eosin staining shows the injured area in the left and right hemispheres. In (A), focal hemorrhage (arrows) in the cerebral cortex, deep white matter, base, and necrosis with hygroma (void arrow) can be observed because of diffuse cerebral contusion. (B) shows lots of dead cells that have no nucleus throughout the brain parenchyme in the left (a, ×100) and the right (b, ×100) sides. Red circles indicate the nuclear vacuolation in the brain cell after traumatic brain injury in the dominant (c, ×400) and the non-dominant (d, ×400) sides of the cerebral hemisphere.
Immunohistochemical findings
All three groups had c-Fos expression in the cerebral cortex where the diffuse brain injury occurred, but the expression was more marked in the ES and the MS groups than in the sham group. c-Fos was expressed on the non-stimulated side in the ES group, though at a lower amount than on the stimulation side. In the MS group, the expression of c-Fos was even on both sides. The expression of c-Fos was much lower in the sham group (Fig. 5).
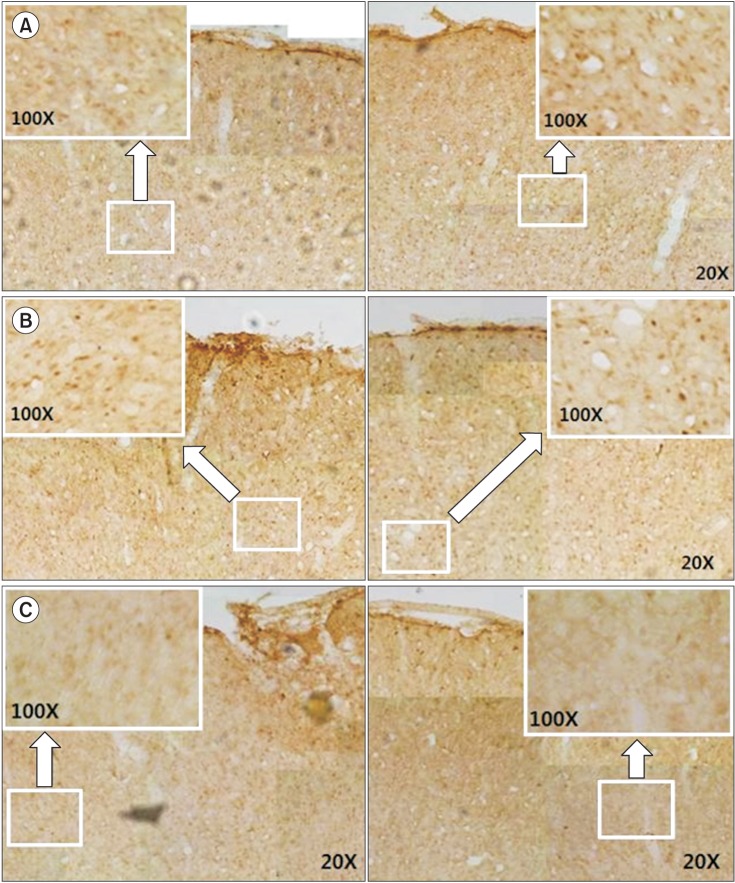
Immunohistochemistry staining for c-Fos protein in the cerebral cortex of rats with diffuse traumatic brain injuries. The left (stimulation) and the right (non-stimulation) cortex in the ES group (A). The dominant and non-dominant cerebral cortex in the MS group (B) and in the sham group (C). In (A), note the increase in c-Fos expression on both sides, although the increase is more pronounced on the stimulated side, In (B), note the increase in c-Fos expression over the entire cerebral cortex, with the same level of expression on both sides. In (C), there is c-Fos expression on both sides, with much lower expression than in the ES group (A) and the MS group (B). ES, electrical stimulation; MS, magnetic stimulation.
DISCUSSION
This study was designed to investigate the effect on motor recovery and brain activity after EES or rTMS in rats with diffuse TBI.
The rat model for TBI is based on a weight drop, a controlled cortical impact and a fluid percussion, all of which are created using a direct contact injury [1617]. In a weight drop model, the impact can induce the occurrence of cerebral edema, contusion, and diffuse axonal injury [18]. Marmarou et al. [8] induced the occurrence of TBI by dropping an object with a weight of 450 g from the height of 2 m, with a mortality of 44%. In the current experiment, we induced the occurrence of TBI by dropping an object with a weight of 450 g from the height of 1 m to create a severe brain injury model (at first, we started by dropping a weight of 300 g from the height of 1 m similar to Ucar et al. [10], but found that there was rapid natural recovery in the motor behavior of rats during the postoperative period).
The safety of EES has been questioned. Brown et al. [19] conducted a clinical study to demonstrate its safety and multi-center clinical studies have been conducted since [2021]. Monopolar currents are used for EES, because they are more beneficial to neuronal plasticity than bipolar currents [22]. Adkins-Muir and Jones [23] and Teskey et al. [24] used a rat model of cerebral infarction and reported that motor performance increased in rats that were stimulated at a frequency of 50 Hz. Based on these reports, we also used 50 Hz as the stimulation frequency. With regard to the effects of EES, brain tissue was remodeled and brain function was improved [20]. The cerebral cortex was also reorganized for motor control [2526]. In the current study, we evaluated the extent of brain activity using c-Fos expression and found that brain activity was high in the cerebral region where EES was performed. In addition, motor function improved based on the SPRT and RRT scores. This suggests that brain activity was increased gradually by a remodeling of the brain tissue. Especially in the ES group, the RRT performance time rate increased to near-normal values from POD 8 and increased significantly more than in the MS group (from POD 8 to 10). This might be due to the continuous direct and concentrated stimulation [13] to the motor cortex for 24 hours a day over two weeks and may be related to the high expression of c-Fos in the stimulated cerebral cortex. With regard to the expression of c-Fos observed on the non-stimulated side, EES may have affected the contralateral hemisphere indirectly or led directly to the activation of the opposite side.
With rTMS, it is generally known that high-frequency stimuli of ≥5 Hz increase the excitability of the cerebral cortex. Ji et al. [27] reported that the degree of brain activity was increased through an immediate early gene expression following the use of rTMS in rats. In addition, Post et al. [28] reported that the long-term use of rTMS demonstrated an in vivo neuroprotective effect in rats. In the current study, SPRT and RRT scores were significantly higher in the early stages (POD 4 and 5 in SPRT and POD 4 in RRT) for rTMS compared with EES and the expression of c-Fos was even throughout the overall cerebral cortex. These results may be due to the strong stimulation of the overall cerebral cortex, leading to prompt activation of the brain.
c-Fos is a marker that is promptly expressed in response to various types of stress stimuli [15], but it shows no responses in the absence of neuronal activation [29]. It is promptly expressed in the post-synaptic neurons and used as a neurological marker for activation of the neurons in the brain following injury to the central nervous system. Increases in neuronal activity in response to injury lead to changes in gene expression in addition to prolonged changes in the nervous system. This activity-dependent plasticity causes functional restoration [30]. In the current study, the expression of c-Fos was observed on both the stimulated and non-stimulated sides in the ES group whereas there was a homogeneous distribution in all areas of the cerebral cortex in the MS group. These results indicate that the neuronal activity increased after electrical and magnetic stimulation.
The limitations of this study are that there are no established treatment guidelines using rTMS for brain diseases including TBI. Therefore, we arbitrarily selected the frequency, duration and intensity of treatment and overlooked the fact that the use of rTMS would be limited in a clinical setting if a metal object was implanted in the brain. We only evaluated the effect immediately after 2 weeks of stimulation, so the significant changes after EES and rTMS were limited to a short period, which was during the acute period. The degree of c-Fos expression was not evaluated by statistical analysis, therefore, we cannot confirm the effects of EES or rTMS on the change of c-Fos in this study.
In conclusion, we performed EES and rTMS in a rat model of diffuse TBI and found that the brain activity and motor behavioral functions of the rats recovered significantly after stimulation. Our study will serve as a reference study for electrical or magnetic stimulation applications in animals and patients with TBI.
ACKNOWLEDGMENTS
This study was supported by a grant from the Korea Healthcare technology R&D Project (No. A091220), Ministry of Health & Welfare, Republic of Korea.
Notes
CONFLICT OF INTEREST: No potential conflict of interest relevant to this article was reported.