Comparison of Fat Mass Percentage and Body Mass Index in Koreans With Spinal Cord Injury According to the Severity and Duration of Motor Paralysis
Article information
Abstract
Objective
To analyze the relationship of the change in fat mass percentage (FMP) and body mass index (BMI) with the change in obesity rate according to gender, extent of spinal cord injury (SCI) and the duration.
Methods
The retrospective study was conducted with medical records of 915 patients. FMP was calculated with BMI and bioelectrical impedance analysis (BIA). Statistical analysis of the relationship between FMP and gender, extent of SCI and the duration after SCI was done.
Results
FMP increased in relation to the duration. The mean FMP was higher in the motor complete tetraplegia group, as compared to the motor incomplete group. The rate of obesity was 69.8% with cutoff FMP values of over 22% and 35% for male and female patients, respectively. Rate of obesity was correlated with the duration after SCI and degree of paralysis. The rate of obesity was 17.1% with a cutoff value of BMI 25 kg/m2 and 51.3% with a cutoff value of 22 kg/m2. For evaluation of the diagnostic value of BMI to predict obesity according to FMP standards, a cutoff value of 25 kg/m2 showed a sensitivity level of 22.3% and specificity level of 94.9%. When the cutoff level for BMI was set at 22 kg/m2, the sensitivity and specificity were 59.3% and 67.0%, respectively.
Conclusion
In Korean SCI patients, FMP showed good correlation with the duration of SCI and the extent of SCI, while BMI did not. Especially in the motor complete tetraplegia group, the diagnostic value of BMI decreased as the duration after SCI increased. This study suggested that FMP could be used complementarily when evaluating the obesity of SCI patients.
INTRODUCTION
Prevalence of obesity in the general population has been on the rise and various socioeconomic and physiometabolic factors are associated with its progress [1234]. Patients with spinal cord injury (SCI) are not an exception, being exposed to the same living conditions and environmental factors of obesity as the general population [567]. Mean life expectancy of SCI patients has increased due to better medical and post-injury care, but the rate of cardiovascular disease has become more common in these patients as well [234]. Increase in cardiovascular disease is primarily due to reduced activity with dietary change, leading to susceptibility to obesity that in turn leads to chronic illness including cardiovascular disease [8]. In addition, body composition considerably changes after spinal injury. Patients experience loss of muscle mass with elevated fat content [9], and reduction in metabolic rate post-injury decreases the use of body fat that results in high fat accumulation in the body [10]. Therefore, diet control and management of obesity has become an important goal for patients with spinal cord injury to improve quality of life and prevent unexpected mortality [111213].
Generally, body mass index (BMI) is used to measure the degree of obesity, but its efficacy in patients with SCI is controversial [1114]. Dual-energy X-ray absorptiometry (DEXA) has become a reliable tool to estimate body fat mass percentage (FMP) and is frequently used as a standard measurement tool in obesity research [151617]. However, the cost and exposure to radiation limits its application in the clinical environment [12]. Hence, for easier and safer measurement of BMP, bioelectrical impedance analysis (BIA) has gained attention as the alternate tool to reliably assess FMP [1318]. Han et al. [15] reported a strong correlation between measurements of FMP calculated by DEXA and BIA; and several previous studies successfully utilized FMP data measured by BIA [192021]. However, there are no investigations on change in FMP and differences between changes of FMP and BMI in accordance to extent of cord injury and duration after SCI. In this study, we therefore measured changes in FMP and BMI of Korean SCI patients in relation to duration after SCI and degree of paralysis, and the obesity rate was determined based on acquired data of FMP and BMI.
MATERIALS AND METHODS
Subjects
This was a retrospective study that reviewed charts of 915 Korean SCI patients whose BMI and FMP were measured at our institution. General demographics such as age, gender and post-injury time (month) and American Spinal Injury Association impairment scale (AIS) were recorded. Tetraplegia was defined as injuries at first thoracic level or above, and paraplegia was considered as injuries at second thoracic nerve level or below. In relation to injury level and degree of paralysis, these patients were divided into 3 groups, i.e., motor complete tetraplegia group (AIS-A,B), motor complete paraplegia group (AIS-A,B), and motor incomplete group (AIS-C,D).
Fat mass percentage measurement
FMP was measured with InBody S20 (Biospace Co. Ltd., Seoul, Korea) that uses BIA for calculation, and InBody S20 allows measurements in supine position, the only suitable position for SCI patients. BIA estimates body composition by measuring differences in electrical conduction level in various tissues. The amount of conduction is proportional to water and electrolyte content. Fat tissue contains relatively small amounts of water than other tissues, and more fat mass results in reduction of electrical conduction [15]. Many previous studies have confirmed its efficacy in measuring fat mass percentage and diagnosing obesity in SCI patients with the same cutoff value of obesity used in the general population [2022]. Thus, our study also designated the diagnosis of obesity as 22% of FMP or above for male and 33% of FMP or above for female [23].
Body mass index measurement
Height (m) and weight (kg) were measured, and BMIs (kg/m2) were calculated in all patients. The diagnosis of obesity in accordance to BMI was based on 2 standards. First, obesity was diagnosed when BMI was 25 kg/m2 or above following WHO's diagnostic criteria of obesity in the Asian [24]; in addition, those with BMI of 22 kg/m2 that is the suggested cutoff point for obesity in SCI patients by Laughton et al. [20], were also considered to be obese. Other studies such as a study by de Groot et al. [25] likewise used the 22 kg/m2 cutoff point of BMI for analysis in their study.
Statistical analysis
Duration after SCI was divided into 3 categories, i.e., less than 1 year, between 1 and 5 years, and more than 5 years. One way ANOVA was used to analyze changes in BMI and FMP according to prevalent time, gender and extent of paralysis. Scheffe post-hoc test was conducted to obtain maximum and minimum among the groups. Linear by linear association was used for tendency analysis of BMI and FMP in relation to prevalent durations found in the groups with different degree of paralysis. Statistical analysis was done with SPSS ver. 20.0 (IBM SPSS Inc., Armonk, NY, USA) and p-value of <0.05 was considered significant.
RESULTS
Demographics and clinical characteristics of the study participants
Mean prevalent time for all 915 patients was 71.98±76.53 months. There were 640 males (69.9%) and 275 females (30.1%) with the mean age of 45.17±14.63 years. There were 478 patients (52.2%) classified as ASIA-A group, 139 (15.2%) in ASIA-B, 122 (13.3%) in ASIA-C, and 176 (19.2%) in ASIA-D. There were 453 patients (49.5%) with tetraplegia and 462 (50.5%) with paraplegia, and 617 patients (67.4%) suffered motor incomplete injury, while 298 (32.6%) had complete motor injury (Table 1).
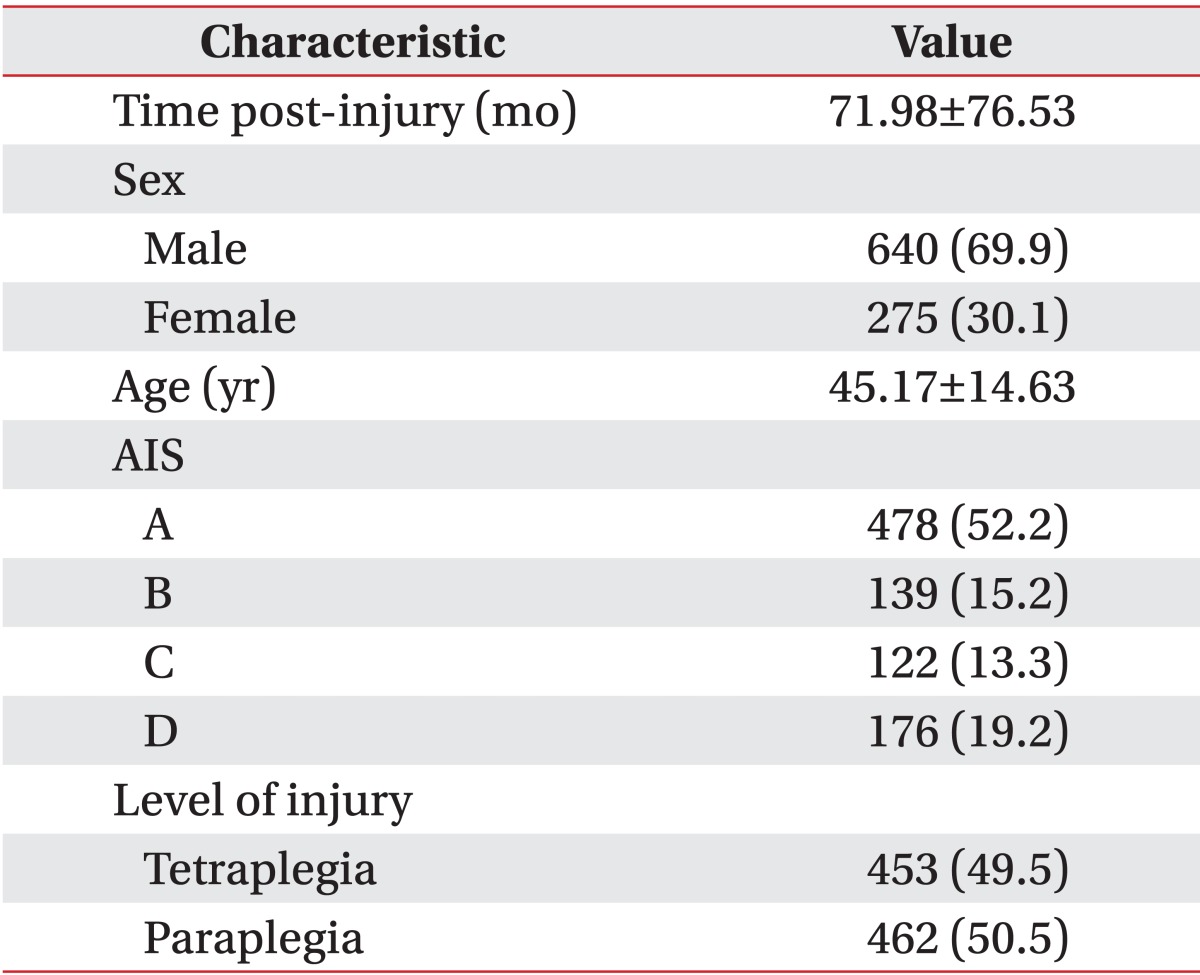
Demographics and clinical characteristics of the study participants (SCI, n=915)
Analysis of the change of FMP ac cording to the severity of motor paralysis and duration of SCI patients
The SCI patients were first divided in accordance with gender and degree of paralysis. FMP changes were analyzed in relation to prevalent time in each group. The analysis results indicated that level of FMP was elevated with increased duration after the cord injury. In male patients, the changes in FMP had statistical significance in relation to the duration after SCI in motor complete paraplegia (p<0.001) and motor incomplete groups (p=0.001). Scheffe post-hoc test showed that FMP was significantly higher in the group with more than 5 years duration, as compared to groups with less than 1 year and between 1 and 5 years duration (Table 2).
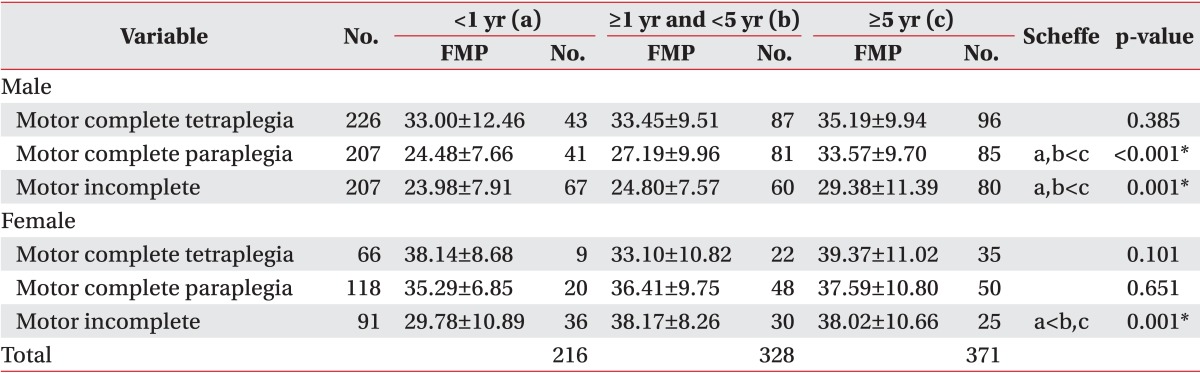
Changes of FMP according to the severity and duration of the injury
When FMP changes in male patients were analyzed in relation to extent of paralysis against different duration times, FMP in the motor complete tetraplegia group with less than 1 and between 1 and 5 years of the duration had significant increases than the motor complete paraplegia and motor incomplete groups with same duration (p<0.001). FMP values in the motor complete tetraplegia and paraplegia groups of more than 5 years duration showed significant elevation than the motor incomplete group with more than 5 years duration (p=0.001). For females, the motor incomplete group had statistically significant changes of FMP in accordance with the duration after the injury (p=0.001). Scheffe post-hoc test resulted in significant elevation of FMP in the groups with over 5 years prevalence time and between 1 and 5 years than those with less than 1 year duration (Table 2).
Analysis of the change of BMI ac cording to the severity of motor paralysis and duration of SCI patients
SCI patients were categorized based on gender and degree of paralysis and subsequently, changes in BMI over the duration after the injury was analyzed. When changes in BMI over the different post-injury periods were analyzed there was no tendency for consistent change of BMI over the time. In the group with motor complete paraplegia, females had reduction in BMI when the time after the injury increased. Thus, BMI does not adequately reflect clinical changes in the patients.
For the analysis based on gender, males showed significant difference among changes of BMI over the different durations after the injury in the motor complete paraplegia group (p=0.037). Scheffe post-hoc test revealed significantly higher BMI in the group with more than 5 years than the group with less than 1 year duration (Table 3). When BMI changes in accordance to extent of paralysis were statistically analyzed, the prevalent time between 1 and 5 years (p=0.004) and more than 5 years (p<0.001) had significantly elevated BMI in the motor complete paraplegia group than the motor complete tetraplegia group. The same analysis in females showed that the motor complete paraplegia group had significant changes of BMI in accordance with prevalence time (p=0.001). For those with less than 1 year prevalence of injury, significantly higher BMI was found in Scheffe post-hoc test than those with more than 5 years duration (Table 3). When degree of injury was considered in the analysis, for the patients with less than 1 year duration, the motor complete paraplegia and motor incomplete groups had significant elevation of BMI than those with motor complete tetraplegia (p<0.001). For the patients with more than 5 years of the duration, the motor incomplete group had significant increase of BMI than the motor complete tetraplegia group (p<0.001).
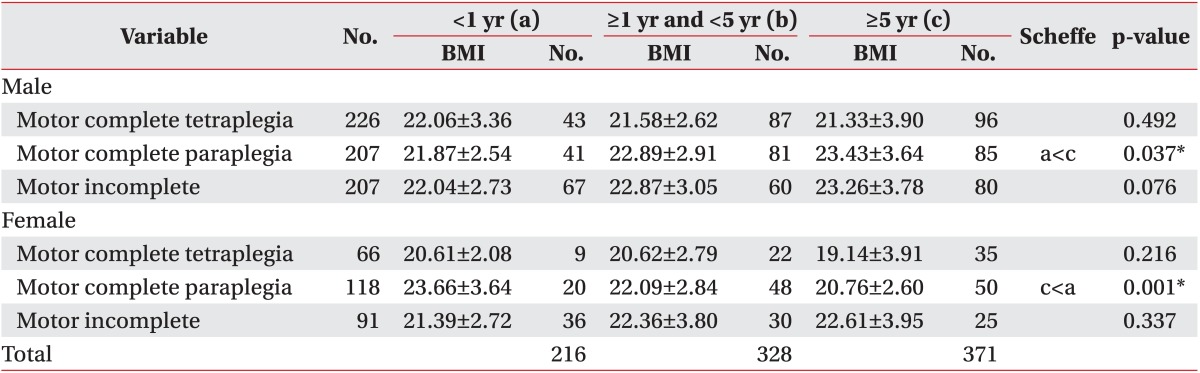
Changes of BMI according to the severity and duration of the injury
Change of the percentage of obesity based on FMP and BMI
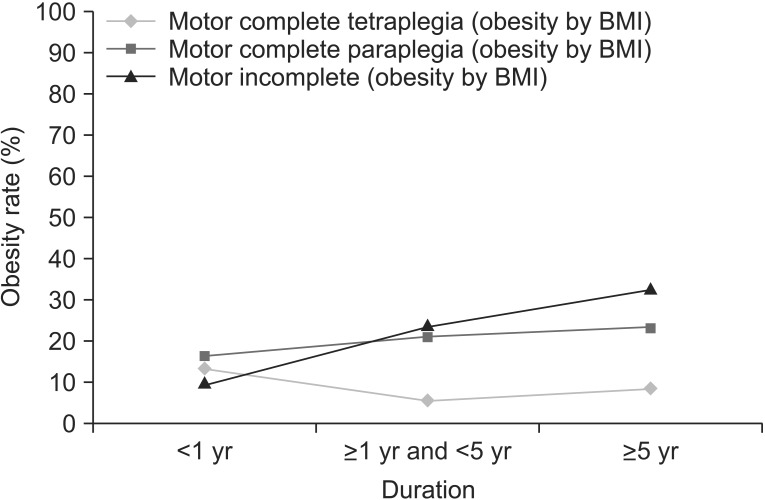
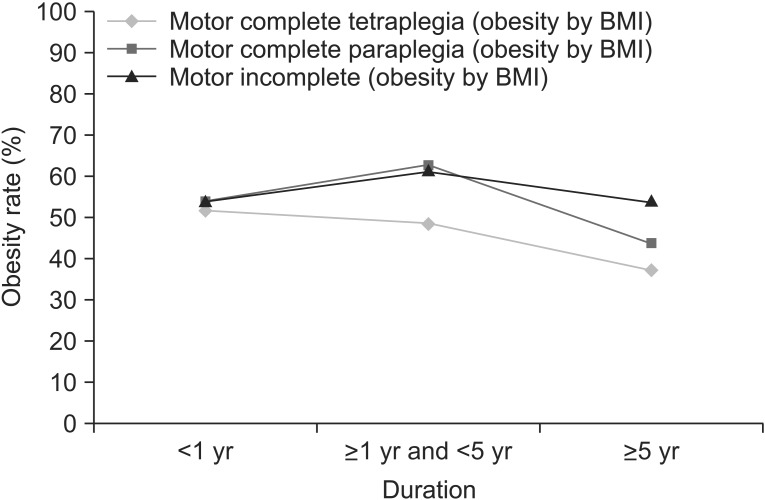
After the SCI patients were divided based on different injury extent, obesity rates based on measured BMI and FMP were investigated in relation to the duration after the injury. Obesity rate based on FMP was 69.8% in all SCI patients included in the study. Furthermore, the obesity rate for patients with less than 1 year of the duration was 54.6%, 69.5% in patients with the duration between 1 and 5 years, and 78.9% in patients with more than 5 years of the duration. Obesity rates in relation to extent of paralysis were 79.4% for the motor complete tetraplegia group, 69.5% for the motor complete paraplegia group and 60.7% for the motor incomplete group. Obesity rates based on FMP showed tendency of increase with the increased duration in the motor complete paraplegia (p=0.002) and motor incomplete groups (p<0.001) (Fig. 1). When obesity rate based on BMI was investigated with the reference of 25 kg/m2 as a cutoff point for obesity, overall obesity rate was 17.1% in all SCI patients. Obesity rate was 12.5% in those with less than 1 year of prevalence time, 16.4% in those between 1 and 5 years, and 20.4% in those with over 5 years of the duration. Obesity rate in relation to degree of paralysis showed 8.2% of obese patients in the motor complete tetraplegia group, 20.9% of obese patients in the motor complete paraplegia group and 21.8% in the motor incomplete group. In the motor incomplete group only, the obesity rate increased while the duration was protracted (p<0.001) (Fig. 2).

Changes in the percentage of obesity based on the cutoff points of fat mass percentage (FMP) (male≥22%, female≥35%).
Changes in the percentage of obesity based on the cutoff point of body mass index (BMI) ≥25 kg/m2.
When the definition of obesity was designated as BMI of ≥22 kg/m2, the rate was elevated to 51.3% in all SCI patients. For those with less than 1 year of the duration, the rate was 53.7%, 57.6% for patients with the duration between 1 and 5 years and 44.4% for patients with more than 5 years of the duration. In accordance to extent of paralysis, obesity rates for the motor complete tetraplegia, motor complete paraplegia, and motor incomplete groups were 44.1%, 53.2%, and 56.3%, respectively. However, the rates showed decrease in the motor complete tetraplegia (p=0.041) and motor complete paraplegia (p=0.045) groups, while the post-injury prevalent time lengthened (Fig. 3).
Changes in the percentage of obesity based on the cutoff point of body mass index (BMI) ≥22 kg/m2.
Comparison of sensitivity and specificity for prediction of obesity in participants at BMI cutoffs of 25 kg/m2 and 22 kg/m2
In this study, we presumed that the diagnosis of obesity using FMP is accurate. Hence, we investigated the predicted value of obesity based on FMP with reference to obesity defined based on BMI. When BMI cutoff was set at 25 kg/m2, overall sensitivity and specificity were 22.3% and 94.9%, respectively (Table 4). The sensitivity and specificity were raised to 59.3% and 67.0%, respectively, when the cutoff value was altered to 22 kg/m2. In the motor complete tetraplegia group, the sensitivity was low at 54.6%, among patients with the duration between 1 and 5 years and 41.6% among the patients with duration of more than 5 years in the motor complete tetraplegia group. For the motor complete paraplegia group, low sensitivity (52.3%) was found in the patients with the duration of over 5 years (Table 5).
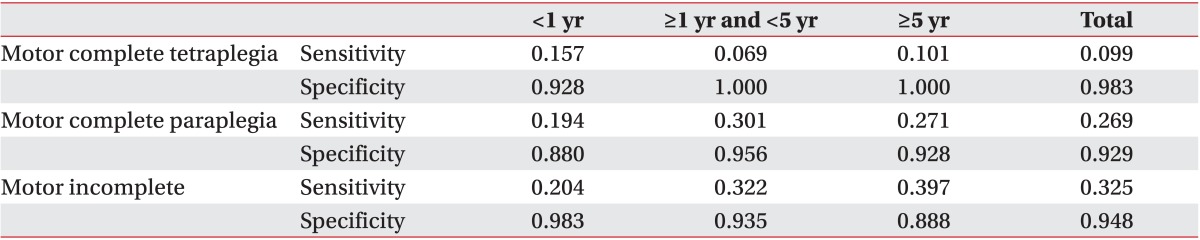
Comparison of sensitivity and specificity for prediction of obesity in the participants at BMI cutoff point of 25 kg/m2
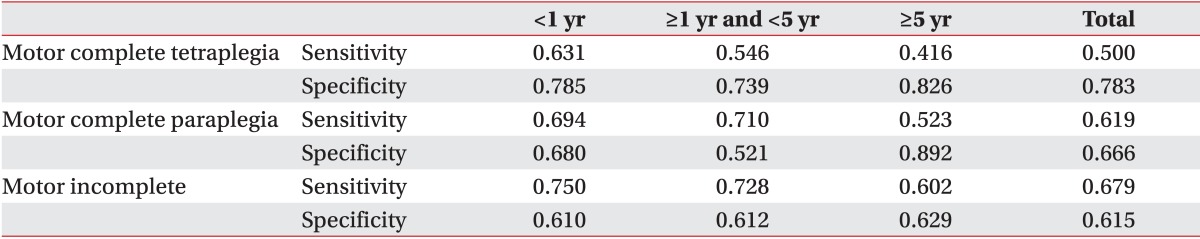
Comparison of sensitivity and specificity for prediction of obesity in the participants at BMI cutoff point of 22 kg/m2
DISCUSSION
We compared FMP and BMI in Korean SCI patients. Although there have been some studies on changes in BMI according to duration after the injury counted after discharge of patients with spinal cord injury [25], no study has investigated the changes in FMP over the post-injury duration and compared the changes in FMP over time with the changes in BMI over the same period of prevalence. Several studies measured changes in obesity index according to different durations after SCI, but these studies were not conducted on Korean patients. In addition, these studies reported changes of BMI in a prospective manner [25]; or the FMP patient groups were limited to motor complete patients with AIS-A and B [26]. In this study, we classified patients according to injury level and extent of paralysis and recorded detailed changes of FMP measured by BMI and BIA over the different durations after the injury. This study is the first of its kind to date. Since obesity index may differ according to race, it was imperative to measure FMP in Korean SCI patients. In addition, this study is noteworthy since comparisons between BMI and FMP in relation to many variables, such as extent of paralysis, gender, and the duration, were made on a larger patient cohort than previous studies [20].
In this study, mean FMP and obesity rate based on FMP were increased when the duration after SCI increased and extent of paralysis was more severe. On the contrary, mean BMI in relation to the duration and the extent of paralysis did not show a tendency for consistent change. For obesity rate with BMI set at ≥22 kg/m2, the rate rather had decreased tendency while the duration after SCI extended. When obesity references were set as BMI of ≥22 kg/m2 or ≥25 kg/m2 to predict the rate of diagnosis of obesity based on FMP, the sensitivity of predicting the diagnosis decreased for both references while the duration and extent of paralysis became longer and more severe. We believe that the low sensitivity is the result of muscle mass reduction in the motor complete group whose body weight is significantly affected by the muscle mass diminution than other factors. Previous studies such as a study by de Groot et al. [25] used BMI to investigate obesity prospectively in SCI patients. They showed that BMI had increased significantly for 1 year after the discharge from a hospital. They also found that the tendency was evident 2 and 5 years after the initial admission for the injury. However, our study did not show similar tendency of significant increase in obesity over the period of prevalent time when BMI was used as reference for obesity, but only FMP had consistent increase in relation to the duration after the injury. A patient who suffers from SCI experiences change in body composition, where loss of muscle mass is replaced by increase in fat mass [121825]. The inconsistent tendency is likely because BMI that uses body weight cannot reflect this change clearly. Hence, BMI that is computed with body weight and height is not considered as a reliable tool to diagnose obesity in SCI patients as the duration after the injury is prolonged. FMP measured through BIA enables more direct evaluation of body composition in relation to changes of fat mass. Thus, we assumed that the method provided a better estimation of obesity rates over different periods of prevalent time.
We made an analysis of different obesity rates on each obesity index. In both 22 and 25 kg/m2 cutoff points of BMI, patients with more severe paralysis showed a tendency of lowered obesity rates. In contrast, FMP showed increase in obesity rate as the extent of paralysis became more severe. Several studies showed the similar inconsistent tendency for obesity rate based on BMI. Other studies [520] reported a higher obesity rate in paraplegic patients than tetraplegic patients, and concluded that since paraplegic patients can use their upper limbs freely they were able to have higher dietary intake than those with tetraplegia, leading to higher obese proportion in paraplegic patients. However, in other studies that used DEXA to determine FMP, more FMP in upper limb was found in patients with tetraplegia than patients with paraplegia [26]. The differences in the results among the studies are possibly due to the diverse selection criteria and classification systems used. In addition, different methodology was used to measure or compute the rate of obesity. Nonetheless, in general, patients with tetraplegia have significantly greater limitation in movements and activities than those with paraplegia [27]. Hence, when both groups of patients are assumed to have the same amount of calorie intake, patients with tetraplegia are expected to spend less calories than patients with paraplegia. Also, since level of cord injury is higher in tetraplegic patients, more muscles including muscles in trunk are lost and replaced by fat resulting in higher chance for obesity than paraplegic patients. A previous study provided evidence of the large replacement of fat tissue in SCI patients [28]; DEXA was used to evaluate body composition showing a high loss in muscle content that was replaced by fat tissue, despite the absence of gross obesity, with significantly large proportion of body fat composition. Thus, we concluded that the different results found between BMI and FMP in relation to obesity indices in our study are due to the unreliable reflection of body composition by BMI in SCI patients. FMP is potentially a more appropriate way of clinical diagnosis of obesity in SCI patients. Similarly, Kim et al. [29] reported significantly higher number of obesity cases in complete motor paralysis than incomplete motor injury and concluded that the higher obesity rate in complete injury is the result of considerable limitation of activity in these patients.
When these results were compared with the results of DEXA that is regarded as a gold-standard in measuring body fat content in SCI patients [30], FMP measured through BIA showed significant correlation with values that are measured by DEXA [1231]. BIA measurements can be affected by hydration status of fat tissue [11] and may have some dissimilarities with the values that are measured by DEXA that is more appropriate for anatomical fat quantity measures [12]. However, a study by Spungen et al. [21] reported meaningful correlation between the values measured by BIA and DEXA. Therefore, our assumption of appropriateness of FMP measured by BIA in this study is well suited for evaluating and making the diagnosis of obesity in our patients.
Our study had some limitations. First, we did not conduct follow-ups of the same patient groups. We reviewed follow-up data of different patient groups with certain degrees of injury and durations after the injury. Hence, our result may show some dissimilarity to a longitudinal study that investigated result of each individual in a cohort. Second, we were not able to acquire data of body composition analysis immediately after SCI injury in our participants, and the absence of data does not allow us to interpret changes in body composition immediately after the injury. Also, without the data, we were not able to tell whether the increase in FMP is the result of simple increase in body fat content or the result of sarcopenia from loss of muscle in paralytic limbs. Further studies that analyze initial body composition are required to make a clarification. Finally, comparison of FMP with other obesity diagnostic tools may be incomplete in this study. We did not perform waist measurement [32] or DEXA that is regarded as a gold standard procedure to measure body fat content [30]. Inclusion of these and other variables for more thorough comparison with other study tools are necessary in future studies for more sophisticated interpretation of the results.
In conclusion, we made the following conclusions based on the analysis and comparison of results between FMP and BMI measured in 915 Korean SCI persons. Firstly, FMP showed increase as the duration after SCI prolonged, and the increase was more prominent in the groups with more severe paralysis. On the contrary, BMI did not properly reflect clinical changes in relation to the duration and the severity of the injury. Furthermore, value of BMI as a reference to make the diagnosis of obesity showed low sensitivity in predicting actual obesity, and the sensitivity was even lower for patients with longer duration and more severe paralysis. Therefore, FMP in addition to BMI must be recommended for patients in motor complete groups (AIS-A, B), whose duration after SCI is extended, to make an accurate diagnosis of obesity for preventing and managing chronic illnesses of these patients more effectively.
Notes
CONFLICT OF INTEREST: No potential conflict of interest relevant to this article was reported.