Quantitative Analysis of Magnetic Resonance Imaging of the Neck and Its Usefulness in Management of Congenital Muscular Torticollis
Article information
Abstract
Objective
To quantify magnetic resonance imaging (MRI) findings of congenital muscular torticollis (CMT) and to demonstrate the usefulness of quantitative MRI findings in the management of CMT.
Methods
This was a retrospective study of 160 subjects with CMT who had undergone neck MRI at the age of 48 months or younger at a tertiary medical center. Among the 160 subjects, 54 had undergone surgical release of CMT and 106 subjects had not undergone surgery. For the quantitative analysis, the ratios of area and intensity of the MRI findings were measured and compared between the two groups (ratio of area = the largest cross-sectional area of the SCM with CMT - the cross-sectional area of the contralateral SCM without CMT / the cross-sectional area of the contralateral SCM without CMT; ratio of intensity = the mean gray color intensity of the contralateral SCM without CMT - the lowest mean gray color intensity of the SCM with CMT / the mean gray color intensity of the contralateral SCM without CMT). Receiver operating characteristic (ROC) curve analysis was conducted for the ratios of area and intensity in order to find the optimal cutoff value for determining the need for surgery in CMT cases.
Results
The ratios of area and intensity were significantly higher in the surgical group than in the non-surgical group (p≤0.001), suggesting that the sternocleidomastoid muscle (SCM) was thicker and darker in the surgical group than in the non-surgical group. The optimal cutoff value for the ratio of area was 0.17 and that for the ratio of intensity was 0.05. All subjects with a ratio of intensity less than 0.03 belonged to the non-surgical group, and all subjects with a ratio of intensity greater than 0.16 were categorized in the surgical group.
Conclusion
The quantitative MRI findings, i.e., ratios of area and intensity, may provide a guideline for deciding the need for surgical intervention in CMT patients. Further prospective studies are required to verify these findings.
INTRODUCTION
Congenital muscular torticollis (CMT) is one of the most common musculoskeletal problems in children [1]. Incidence of CMT has been reported to be as high as 3.92% in neonates [2]. Clinically, CMT is characterized by thickening and/or tightness of the unilateral sternocleidomastoid muscle (SCM), resulting in limited neck motion [3,4].
It was reported that CMT might be defined as a developmental disorder of the SCM characterized by fibrosis that leads to shortening of the SCM. Fibrosis reduces the mobile proton density that presents as hypointensity on both T1- and T2-weighted magnetic resonance images (MRI). Furthermore, if the fibrosis is localized, then localized low signal intensity is observed, but when the fibrosis is diffuse, then the entire SCM will show diffuse hypointensity [5].
About 90% of the CMT cases can be treated primarily through stretching exercises without causing additional musculoskeletal complications, because most cases have small amount of fibrosis [3]. However, the remaining 10% CMT cases have a large amount of dense connective tissue within the SCM that presents as increased hypointensity on T1- and T2-weighted MRI scans. Such cases with dense connective tissue within the SCM rarely show improvement with stretching exercises [3,6]. Therefore, these cases require surgical release of the SCM in order to minimize secondary musculoskeletal complications [4].
Our previous study, using neck ultrasonography, showed that children with a thicker SCM may require a longer duration of stretching exercise in combination with other therapeutic interventions, such as surgery. This suggests that the thickness of the SCM may be one prognostic factor for CMT treatment [7]. We also reported that the MRI and histopathologic findings correlated well with the amount of fibrosis and aberrant dense connective tissue within the SCM. This may suggest that if multiple or large low-signal intensities within the SCM are noted, surgical release should be considered [6].
However, from the literature review and to the best of our knowledge, there is no report on the quantitative analysis of MRI findings in terms of cross-sectional area and gray color intensity of the SCM related to CMT. Therefore, the objectives of this study were 1) to quantify CMT MRIs in terms of cross-sectional area and gray color intensity and 2) to demonstrate the usefulness of quantitative MRIs in management of CMT.
MATERIALS AND METHODS
This retrospective study was carried out in a single tertiary medical center. This research was approved by the Institutional Review Board of Ajou Medical Center.
Subjects
Among the subjects who visited the Clinic for Torticollis, Department of Physical Medicine and Rehabilitation in a single tertiary medical center, for symptoms of abnormal head and neck posture between January 2012 and December 2013, those who had met the following inclusion criteria were included: 1) diagnosed with CMT; 2) had undergone an MRI of the neck for CMT; 3) were 48 months or younger at the time of the MRI; and 4) had a follow-up period of ≥3 months. Individuals were excluded if they had a previous history of surgery or injection of botulinum toxin into the SCM for CMT. A diagnosis of CMT was made when the following criteria were simultaneously met: 1) the head was tilted toward the shoulder of one side, and the chin was turned toward the shoulder of the opposite side and 2) the SCM of the involved side was >2 mm thicker than that of the contralateral side, as detected on ultrasonography [8].
The subjects were divided into two groups, the non-surgical group and the surgical group, which included the patients who had undergone surgical release of CMT. Surgical release was performed by the third author at the age of 6 months or older for one or more of the following conditions: 1) functional limitation of neck motion attributable to shortening of the unilateral SCM with no further functional gain anticipated from stretching exercise and/or objection to performing stretching exercise by the participant; 2) participants had an obvious craniofacial deformity due to neglected CMT; and 3) participants displayed multiple (more than 2) and/or large low-signal intensities evident to the naked eye within the SCM on T1-weighted MRI images [6].
Stretching exercise was performed in patients less than 6 months of age with functional limitation of neck motion. Manual stretching exercise was conducted in patients with a shortened SCM, 30 minutes of manual stretching exercise was performed two to five times a week by an experienced physical therapist, and ultrasound was applied to the enlarged SCM. Caregivers were taught stretching exercise and encouraged to give sessions of manual stretching exercise at home. The treatment was considered to be successful when the full range of motion of neck rotation was achieved. The treatment was considered to be unsuccessful when there was functional limitation of neck motion due to shortening of the unilateral SCM after 6 weeks of stretching exercise or objection to performing stretching exercise before the end of the treatment [9] (Fig. 1).

Therapeutic protocol for congenital muscular torticollis (CMT). OPD, outpatient department; SCM, sternocleidomastoid muscle; MRI, magnetic resonance imaging.
Acquisition of neck MRI
MRI scans of the neck were taken when subjects presented with one or more following conditions: 1) resistance to motion of the neck at the age of 6 months or older even after adequate physical therapy; 2) objection to performing stretching; 3) obvious craniofacial deformity due to neglected CMT; 4) parental consent was obtained.
An MRI of the neck was performed using a 1.5-T MRI unit (Signa; GE Medical Systems, Milwaukee, WI, USA) or a 3.0-T MRI unit (Achieva; Philips Medical Systems, Amsterdam, Netherlands). The following imaging parameters were used for the MRI: TR/TE, 400-600/11-14 for T1-weighted imaging and 3,000-4,000/75-100 for T2-weighted imaging; section thickness, 3.0-6.0 mm; slice gap, 1-2.5 mm; and FOV, 180-240 mm depending on the body side and section planes. Contrast enhancement was not used, and the MRIs were reviewed with a picture archiving and communication system (PACS) (PiViewSTAR; Infinitt, Seoul, Korea).
Quantitative analysis of neck MRI findings
The first and second authors conducted a quantitative analysis of the neck MRIs in an independent and blinded way. After inter-rater reliability was assessed, the mean values measured by the two raters were used for further analysis.
Ratio of area
The difference in pre-operative cross-sectional area between the affected and unaffected SCMs was used as an indicator of radiological severity. To calculate this difference, the largest SCM cross-sectional area was measured on the affected side using the region of interest (ROI) method on an axial T1-weighted MRI image, and the cross-sectional area of the unaffected side was also measured on the same T1-weighted image (Fig. 2A). Finally, the ratio of area was calculated in all 160 subjects as follows:
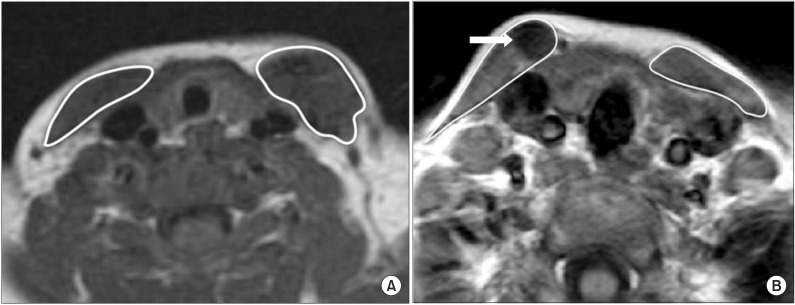
T1-weighted magnetic resonance image of the neck of a patient with congenital muscular torticollis. (A) Methods for measuring the sternocleidomastoid muscle (SCM) area by drawing regions of interest around the SCM. (B) Methods for measuring the SCM gray color intensity (arrow) by drawing regions of interest around the SCM.
Ratio of area = (the largest cross-sectional area of the SCM with CMT - the cross-sectional area of the contralateral SCM without CMT) / the cross-sectional area of the contralateral SCM without CMT.
Ratio of intensity
The difference in gray color intensity between the affected and unaffected SCMs on the pre-operative neck MRI was used as another indicator of radiological severity. This difference was measured using the lowest mean gray color intensity of the affected side on the preoperative axial T1-weighted MRI images using the ROI method, and the mean gray color intensity of the unaffected side was also measured on the same T1-weighted image [5] (Fig. 2B). Finally, ratio of intensity was calculated in all 160 subjects as follows:
Ratio of intensity = (the mean gray color intensity of the contralateral SCM without CMT - the lowest mean gray color intensity of the SCM with CMT) / the mean gray color intensity of the contralateral SCM without CMT.
Statistical analysis
For comparison between the non-surgical and surgical groups, a normality test was performed for the two groups. Since both groups did not have a normal distribution curve, Mann-Whitney U-tests were performed to determine if differences in the radiological measurements between the non-surgical and surgical groups were significant. Binary regression analyses were performed with adjustment for age at the time of acquiring the MRI image. Fisher exact tests were used to compare gender differences and the side affected with CMT between the two groups. Inter-rater reliability was assessed using the intra-class correlation coefficient (ICC), while receiver operating characteristic (ROC) curve analysis was used to determine the optimal cutoff value of the ratios of area and intensity in the surgical group. Statistical Package for the Social Sciences (SPSS) ver. 19.0 (IBM, Armonk, NY, USA) was used for statistical analysis, and statistical significance was set at a p-value <0.05.
RESULTS
Subject characteristics
Among the 788 subjects who had visited the Clinic for Torticollis with symptoms of abnormal head and neck posture, from January 2012 to December 2013, 160 patients (104 boys and 56 girls) met the inclusion criteria and were included in this retrospective study. The right side was affected by CMT in 93 (58%) participants, and the left side was affected by CMT in 67 (42%) participants. The mean age at the time of diagnosis of CMT was 11.58±10.23 months (range, 1 to 46 months). The mean age at the time of neck MRI was 13.13±9.37 months (range, 6 to 46 months).
One hundred six participants (66.3%) were included in the non-surgical group, and 54 subjects (33.7%) were included in the surgical group (Fig. 3). The characteristics of subjects according to the group are presented in Table 1. At the time of MRI, participants in the surgical group (12.44±7.84 months) were significantly younger than those in the non-surgical group (13.48±10.08 months) (p=0.047). The ratio of boys to girls was significantly higher in the non-surgical group than that in the surgical group (p=0.03). There was no significant difference in the affected side of CMT between the two groups.
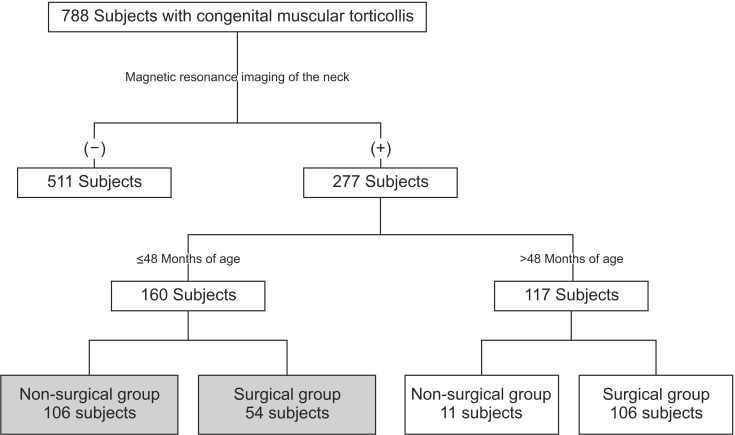
The algorithm for enrollment of the subjects from January 2012 to December 2013.
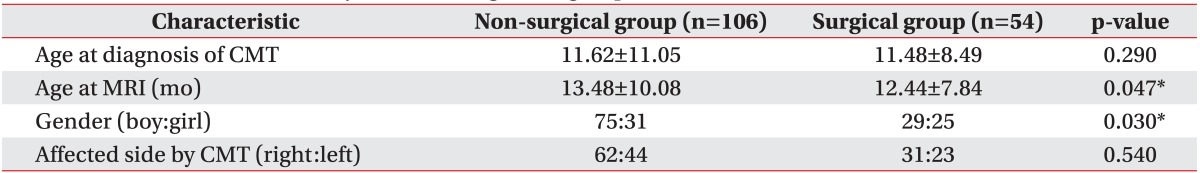
Characteristics of the subjects according to the group
The ratios of area and intensity
Table 2 shows that ICC values for ratios of area and intensity were 0.92 and 0.95, respectively, suggesting a good inter-rater reliability (p<0.001).
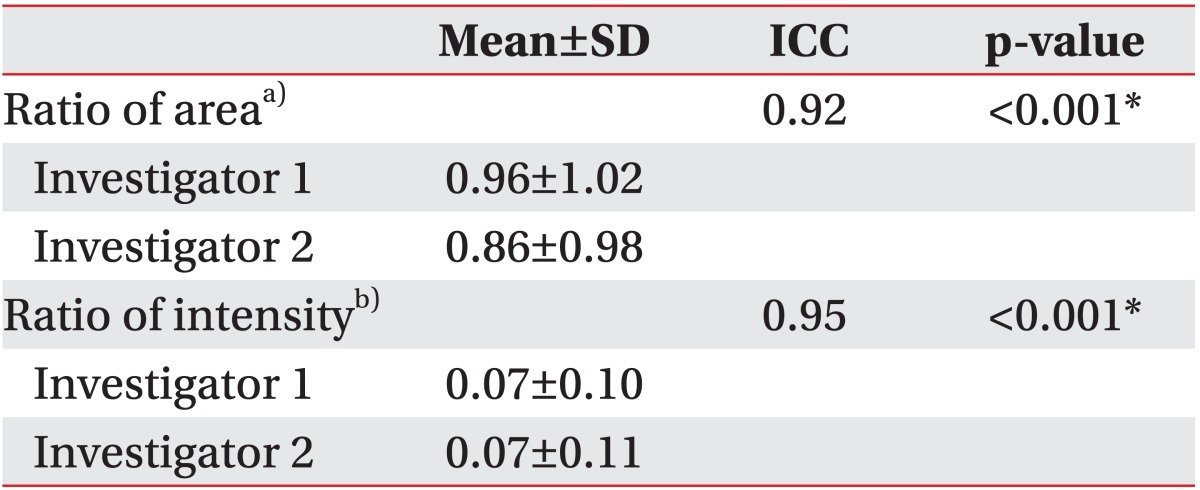
Inter-rater reliability of the measurements of ratios of area and intensity
Quantitative analysis of MRI findings of the neck with CMT between the surgical and the non-surgical groups
The ratio of area was significantly higher (p<0.001) in the surgical group (1.44±1.26; range, -0.39 to 3.83) than in the non-surgical group (0.66±0.76; range, -0.36 to 2.58) (Fig. 4A). The ratio of intensity was significantly higher (p=0.001) in the surgical group (0.15±0.10; range, 0.03 to 0.46) than in the non-surgical group (0.03±0.06; range, -0.13 to 0.16) (Fig. 4B). This relationship was statistically significant even after adjusting for age at the time of acquiring the MRI image (the ratio of area, adjusted p<0.001; the ratio of intensity, adjusted p<0.001).
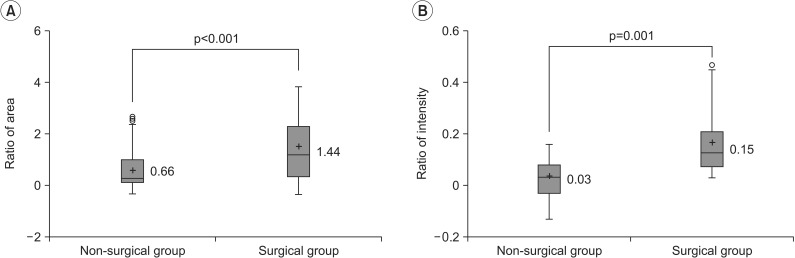
Comparison of quantitative magnetic resonance imaging findings of congenital muscular torticollis (CMT) between the 2 groups. (A) The ratio of areaa) was significantly higher in the surgical group (1.44±1.26) than in the non-surgical group (0.66±0.76) (p<0.001). (B) The ratio of intensityb) was significantly higher in the surgical group (0.15±0.10) than in the non-surgical group (0.03±0.06) (p=0.001). '+' denotes the mean value. SCM, sternocleidomastoid muscle. a)Ratio of area = (the largest cross-sectional area of the SCM with CMT - the cross-sectional area of the contralateral SCM without CMT) / the cross-sectional area of the contralateral SCM without CMT. b)Ratio of intensity = (the mean gray color intensity of the contralateral SCM without CMT - the lowest mean gray color intensity of the SCM with CMT) / the mean gray color intensity of the contralateral SCM without CMT.
Usefulness of quantitative MRI findings in CMT management
ROC curve analysis was conducted on the ratios of area and intensity in order to find an optimal cutoff value at which surgery should be performed. The optimal cutoff value for the ratio of area was 0.17 (sensitivity 85.2%, specificity 28.3%) for the need for surgery to treat CMT (area under the ROC curve [AUC] = 0.693) (Fig. 5A and 5B). The optimal cutoff value for the ratio of intensity was 0.05 (sensitivity 96.3%, specificity 53.8%) for the need for surgery to treat CMT (AUC=0.856). All participants with a ratio of intensity <0.03 belonged to the non-surgical group, and all participants with a ratio of intensity >0.16 were in the surgical group (Fig. 5C and 5D).
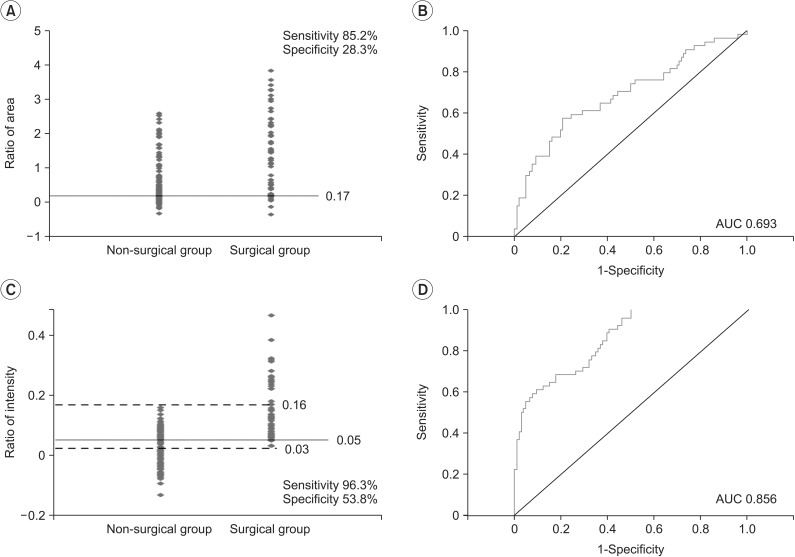
Dot histogram of quantitative magnetic resonance imaging findings of the neck affected by congenital muscular torticollis (CMT) for both the non-surgical and surgical groups. The optimal cutoff values were calculated by the receiver operating characteristic (ROC) curve analysis. (A) The optimal cutoff value for the ratio of area was 0.17 (sensitivity 85.2%, specificity 28.3%) for the need for surgery to treat CMT. (B) For the ratio of area, the area under the ROC curve (AUC) was 0.693. (C) The optimal cutoff value for the ratio of intensity was 0.05 (sensitivity 96.3%, specificity 53.8%) for the need for surgery to treat CMT. While all subjects with a ratio of intensity <0.03 did not undergo surgery, all subjects with a ratio of intensity >0.16 underwent surgery. (D) For the ratio of intensity, the AUC was 0.856.
DISCUSSION
To the best of our knowledge, this is the first report to quantitate MRI findings of CMT patients. Hwang et al. [6] reported that when multiple or a large amount of low-signal intensities within the SCM are visible on MRI scans, surgical release of CMT should be considered, because skull asymmetry or plagiocephaly may occur in the presence of prolonged uncorrected CMT. Furthermore, facial asymmetry and scoliosis may also develop and become aggravated as the patient grows [10,11]. However, the authors did not provide a quantitative MRI cutoff at which surgery should be performed. The present study aimed to determine this cutoff value and to demonstrate the usefulness of quantitative MRI findings in the management of CMT.
The results of this study indicate that the ratio of area (p<0.001) and the ratio of intensity (p=0.001) were statistically significant between the non-surgical and surgical groups. However, the ratios of area overlapped substantially, since most values were dispersed more widely in the surgical group than in the non-surgical group. Although there was an overall statistical significance, due to extensive overlapping, it was difficult to determine a cutoff value for deciding the need for surgery, thus limiting the clinical application of this value. On the other hand, in terms of the ratio of intensity, all participants who underwent surgery had a value greater than 0.16 while none of the participants who had a value less than 0.03 underwent surgery. In addition, if values ranging from 0.03 to 0.16 were obtained, the cutoff value for the need for surgery was 0.05 (sensitivity 96.3%, specificity 53.8%), thereby presenting a guideline for deciding whether surgery should be performed. The sensitivity was set at the cutoff values, and as such, a value was selected at which the sensitivity peaked at 96.3%. The AUC value obtained from the ROC curve was greater for the ratio of intensity (AUC=0.856) than for the ratio of area (AUC=0.693). Therefore, the ratio of intensity was selected as a more useful parameter for deciding whether surgery should be performed to treat CMT.
With respect to the ratio of area, negative values were obtained in several patients. This may be because at the time of their hospital visit for the diagnosis of CMT, there was a difference of >2 mm in thickness of the SCM on the CMT-affected side, as assessed using ultrasonography. However, when analyzed with MRI, the CMT-affected SCM appeared smaller, thereby reducing the area in comparison to the contralateral side [6,12].
Several negative ratios of intensity were also calculated. When the MRI ROIs were measured, the average gray color intensity of the SCM was measured on T1-weighted images. Although some MRI scans that displayed images with lower intensities indicated the presence of fibrotic tissue, there were cases where the areas of higher intensity were greater than the areas of lower intensity in the CMT-affected SCM. Therefore, SCMs with CMT displayed higher average intensities than the contralateral, non-affected SCMs. Images that showed a higher intensity were presumed to be due to subacute hemorrhagic changes in the muscle, suggesting that the negative values resulted from changes in the state of subacute hemorrhage [13,14].
Although the exact causes of CMT are not yet known, it can be presumed that the SCM is affected prior to or at the time of childbirth [15,16,17]. Swelling is initially noted in the SCM; however, it heals gradually. Although wound healing may occur naturally, if damage to the SCM is severe, a portion of the muscle may be replaced with fibrotic tissue. The fibrotic tissue then causes shortening of the SCM, subsequently limiting the range of motion of the neck. Therefore, differences in the clinical severity of CMT may explain the differences in the thickness and signal intensities of the SCM in CMT subjects.
The results suggest that at the time of MRI, the participants in the surgical group were significantly younger than those in the non-surgical group. The surgical group displayed functional limitations in neck motion that may be attributable to the shortening of the unilateral SCM. Because of this problem, MRIs were acquired earlier in the surgical group than in the non-surgical group. In this study, 54 participants (33.8%) underwent surgery, among the 160 subjects with CMT who had undergone neck MRI, which is a high percentage than that reported previously [18,19]. If patients had symptoms of resistance to motion of the neck after adequate physical therapy or obvious craniofacial deformity due to neglected CMT, a neck MRI was performed to assess the need for surgical intervention, thus resulting in a greater number of surgeries.
The ratio of boys to girls was significantly higher in the non-surgical group (75:31) than in the surgical group (29:25) (p=0.03), a finding that is contradictory to that in the previous work. For example, Cheng and Au [18] reported a ratio of boys to girls of 3:2. Unfortunately, we cannot provide a reasonable explanation for sex differences between the non-surgical and surgical groups. To more accurately evaluate the correlation between gender and surgical intervention, a larger study is necessary.
Several limitations of this study should be noted. First, it was a retrospective study. MRI was performed only when the symptoms were severe. One of the criteria for surgical release of SCM for treating CMT was the presence of multiple and/or large low-signal intensities within the SCM evident to the naked eye on T1-weighted MRI scans. However, at the time of surgery, we were not aware of any quantitative values indicating the area and low-signal intensity on MRI scans. Therefore, quantitative values of MRI in CMT cases might provide a guideline for deciding the need for surgical intervention. Therefore, large prospective studies are required in the near future. A second limitation is that the study only the two-dimensional characteristics of the muscle were assessed, although the SCM has a three-dimensional structure, i.e., it is long and spindle shaped. In spite of the aforementioned limitations, this study was able to provide some clinically significant quantitative MRI findings of CMT and it demonstrated the usefulness of these findings in the management of CMT.
However, the above limitations are offset by several strengths. First, this study included a large number of participants. Previous studies on MRI findings of CMT have been conducted in a smaller number of patients, thus limiting the clinical application of their findings. For example, Parikh et al. [20] only included 40 subjects and Hwang et al. [6] only studied 33 subjects. The current study included 160 CMT patients who had undergone neck MRI, and surgery was performed in 54 of these 160 CMT patients. The second strength of the current investigation was that the risk of MRI measurement bias was controlled. This was achieved by ensuring that two authors of this study assessed the MRIs in a blinded and independent way. Overall, the inter-rater reliability was high enough for using the mean.
In conclusion, the ratios of area and intensity were used to quantify MRI findings of CMT. The results suggest that these measures may provide a guideline for deciding the need for surgical intervention in CMT patients. These findings support the usefulness of quantitative MRI findings in the clinical management of CMT. Prospective studies are required to further verify these findings.
Notes
CONFLICT OF INTEREST: No potential conflict of interest relevant to this article was reported.