Prognostic Value of Electroneuronography in Severe Cases of Facial Palsy
Article information

Abstract
Objective
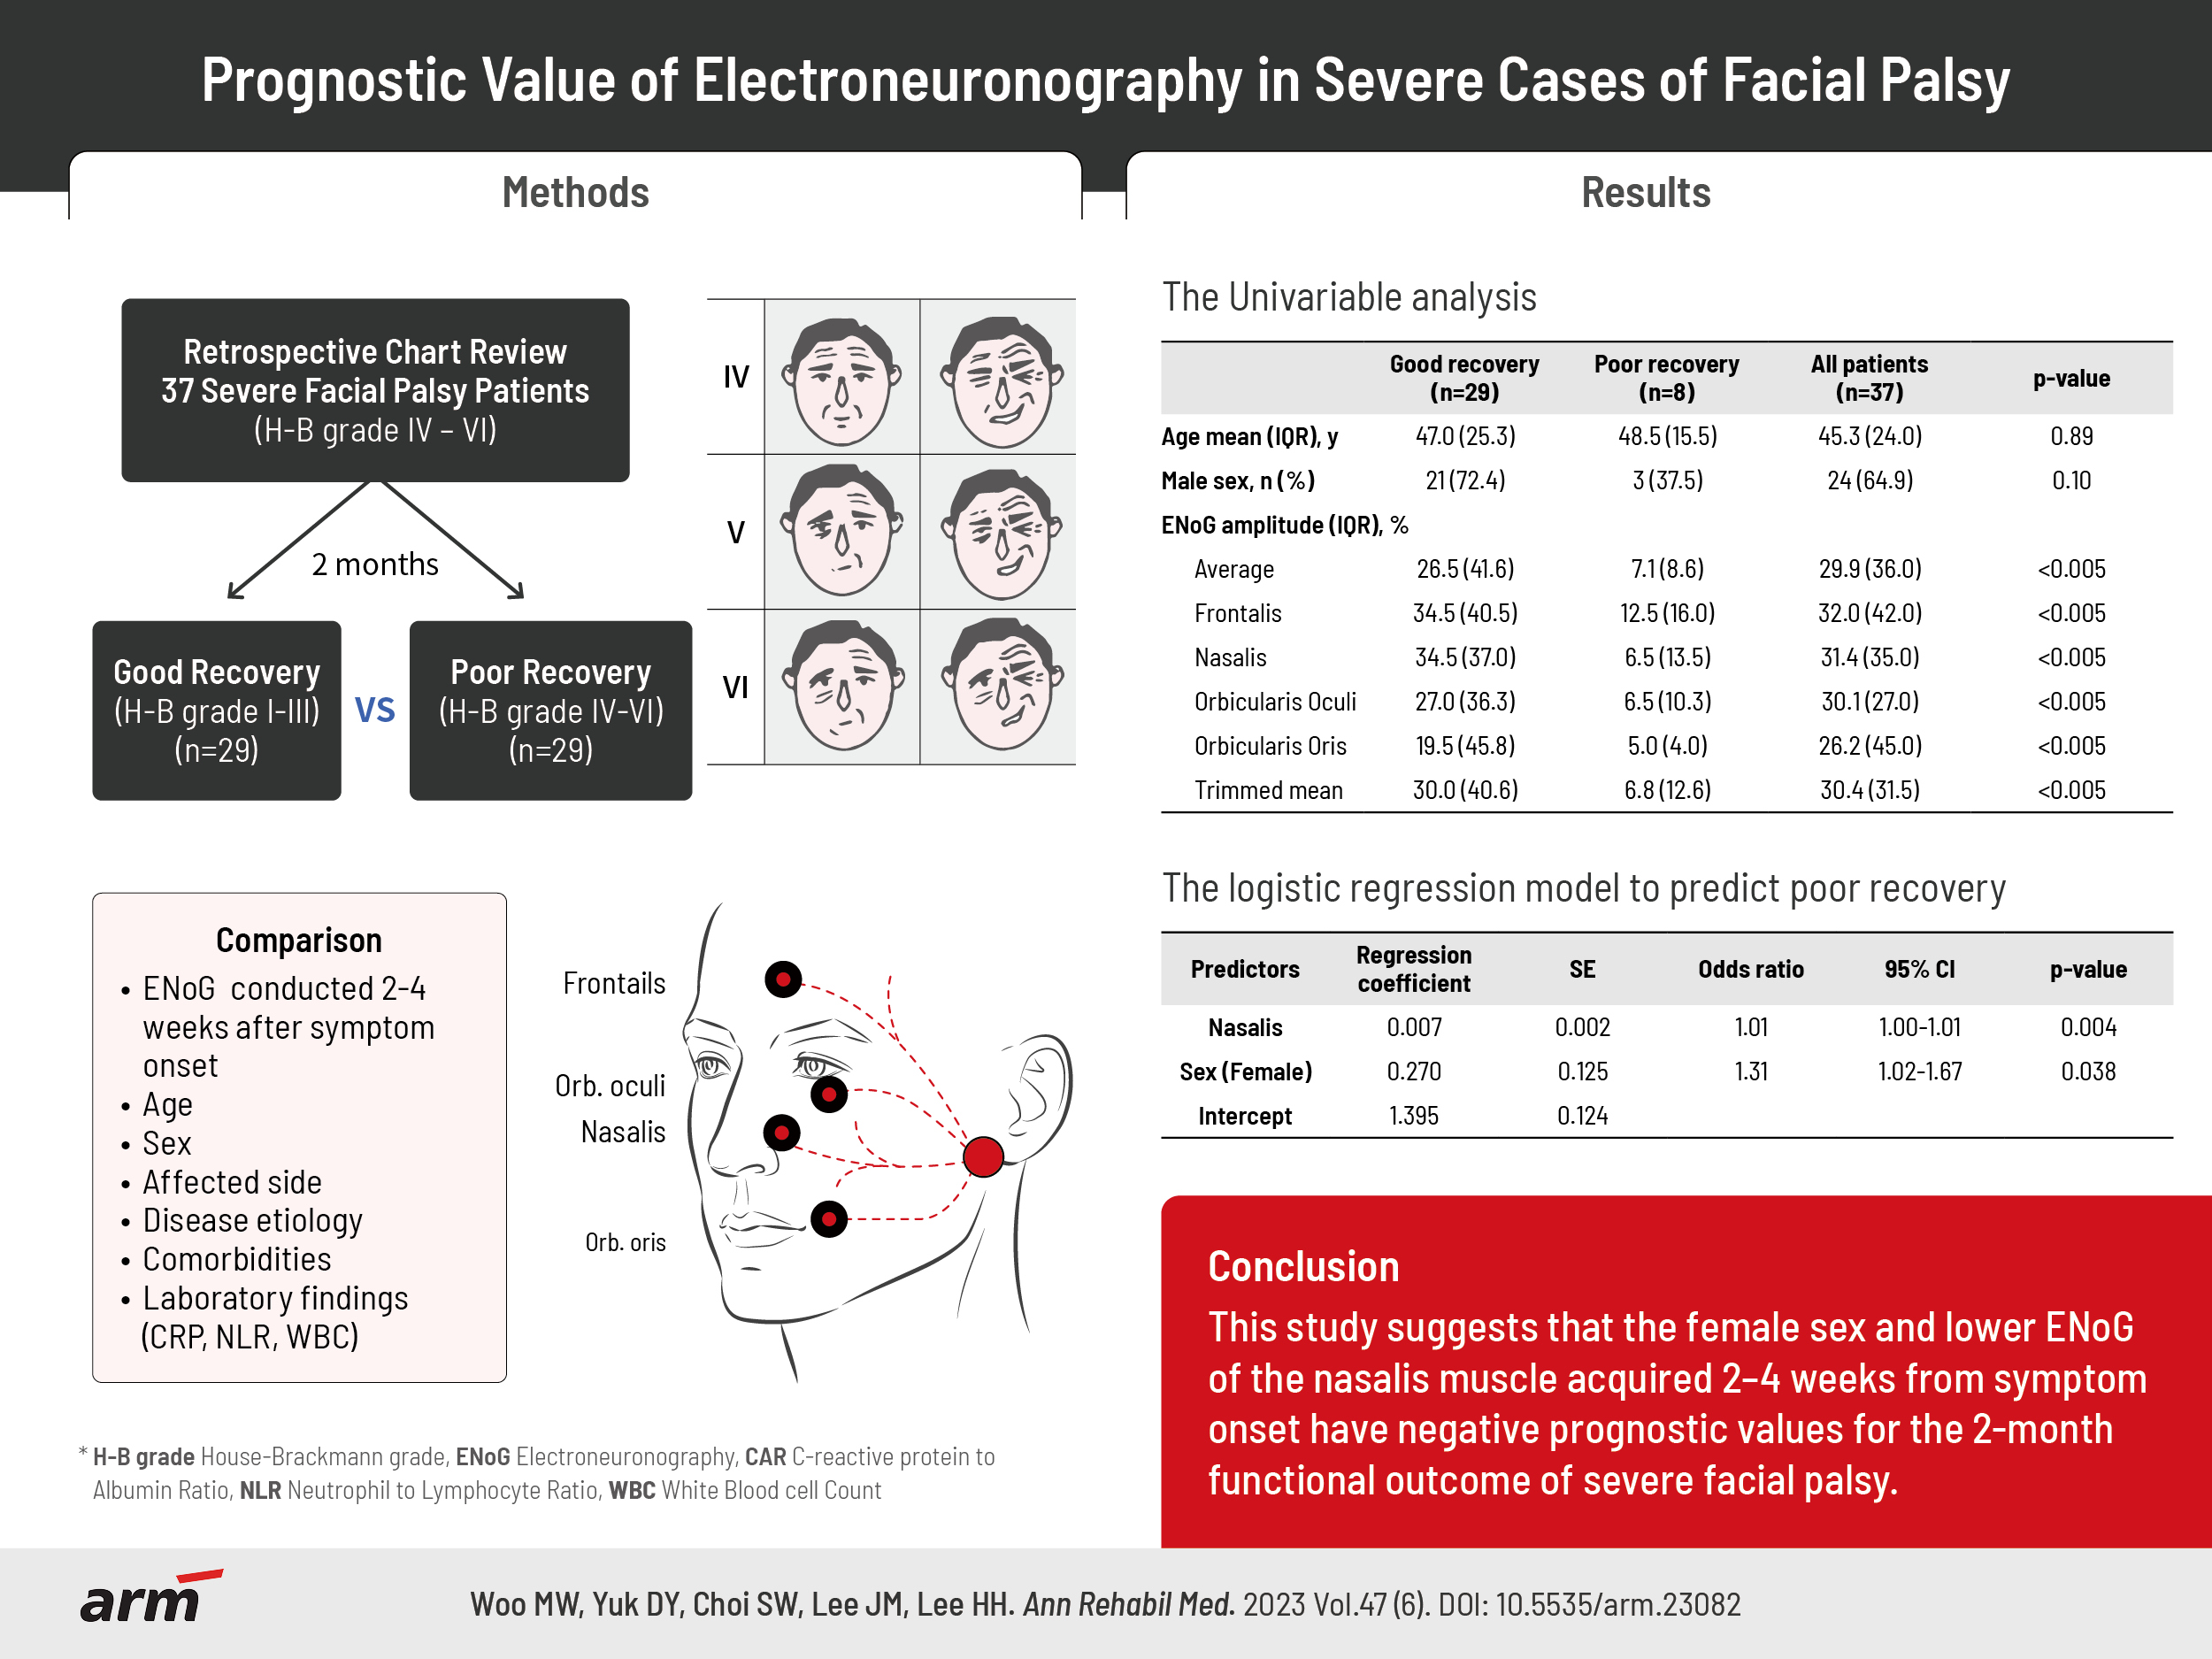
To examine the prognostic value of electroneuronography (ENoG) in predicting functional recovery in severe cases of acute facial palsy.
Methods
Patients with severe degrees of facial palsy (initial House–Brackmann [HB] grades IV to VI) with available electrodiagnostic studies conducted 2–4 weeks after symptom onset were reviewed retrospectively. The patients were categorized into “good recovery” and “poor recovery” groups, with the former showing mild to no dysfunction (HB I to III) and the latter exhibiting moderate to severe dysfunction (HB IV to VI) on follow-up evaluation, 2 months after onset. ENoG amplitudes in four facial muscles (frontalis, nasalis, orbicularis oculi, and orbicularis oris), as well as age, sex, affected side, disease etiology, comorbidities, and laboratory findings, were compared between the two groups.
Results
Thirty-seven patients were included. Twenty-nine of the patients showed “good recovery,” and eight showed “poor recovery” at 2 months after symptom onset. Univariate analysis yielded no significant difference in age, sex, affected side, disease etiology, comorbidities, and laboratory findings between the two groups. Preserved ENoG amplitudes (individual, average, and trimmed means) were significantly higher in the good recovery group than in the poor recovery group (p<0.005). Sex (p=0.038) and the ENoG of the nasalis muscle, acquired 2–4 weeks from symptom onset (p=0.004), showed significant differences in multivariate regression analysis.
Conclusion
This study suggests that the female sex and lower ENoG of the nasalis muscle, acquired 2–4 weeks from symptom onset, have negative prognostic value for the 2-month functional outcome of severe facial palsy cases.
INTRODUCTION
Acute facial nerve palsy is one of the most commonly encountered cranial neuropathies characterized by varying degrees of facial muscle paralysis. Bell’s palsy, an acute facial neuropathy with idiopathic origins, is the most common etiology of acute facial nerve palsy. The symptoms can begin suddenly and worsen over a few hours to days, varying from mild difficulty in making facial muscle movements and facial expressions to inability to close the eye or mouth or even social and psychological distress [1]. The neurologic and psychological symptoms are more prominent when the patient cannot voluntarily move their facial muscles.
Numerous studies have evaluated the degree of nerve degeneration in facial nerve palsy using electroneuronography (ENoG), introduced by Esslen [2] in 1973. The nerve excitability test, maximal stimulation test, ENoG, electromyography, and blink reflex are special tests that can assess the electrophysiological extent of facial nerve damage. In particular, ENoG, by determining action potential amplitude, provides the degree of nerve fiber degeneration with great accuracy [3].
Since it takes about 72 hours for Wallerian degeneration to reach the extratemporal nerve distal to the stylomastoid foramen, which is the area for electrostimulation for ENoG in idiopathic facial palsy, ENoG can be normal in the first 72 hours after symptom onset. The response to ENoG is quickly lost during the next 5–6 days and would not change after 21 days when the nerve degeneration is complete [3,4]. This means that performing ENoG within 14 days after symptom onset may be too early for the test to reflect the full effect of the neurodegeneration. Thus, it seems necessary to determine the predictive usefulness of ENoG performed around 21 days after symptom onset, which is slightly later than the timeframe in traditional studies.
Several factors appear to be related to the prognosis of facial palsy, such as age, sex, and severity of paralysis, and the degree of nerve degeneration obtained by ENoG is the most reliable prognostic factor [5]. However, prior studies on ENoG findings as a prognostic factor did not consider the clinical severity of the paralysis [6,7]. Since facial palsies with more severe axonal damage are associated with longer treatment times and greater variance in treatment results, setting an appropriate treatment duration according to each patient’s treatment potential is necessary for severe cases of facial palsy.
This study aimed to evaluate the cutoff values of electroneuronographic data obtained within 2–4 weeks after symptom onset in severe facial palsy cases to provide an objective basis for predicting functional presentation within 2 months post-symptom onset.
METHODS
Patients
The clinical records of patients who underwent electrodiagnostic laboratory tests in Konkuk University Medical Center between January 2005 and August 2021 were reviewed retrospectively. The clinical severity of facial palsy was evaluated using the House–Brackmann (HB) scale. Patients with HB grades IV to VI were considered to have severe facial palsy since they had obvious facial motor weakness and facial asymmetry [8]. Patients with available electrodiagnostic study data were included 2–4 weeks after symptom onset (Fig. 1, Table 1). The patients were categorized into “good recovery” and “poor recovery” groups. The good recovery group displayed mild to no dysfunction (HB I to III, n=29), while the poor recovery group showed moderate to severe dysfunction (HB IV to VI, n=8) on a follow-up evaluation 2 months after the onset of symptoms.
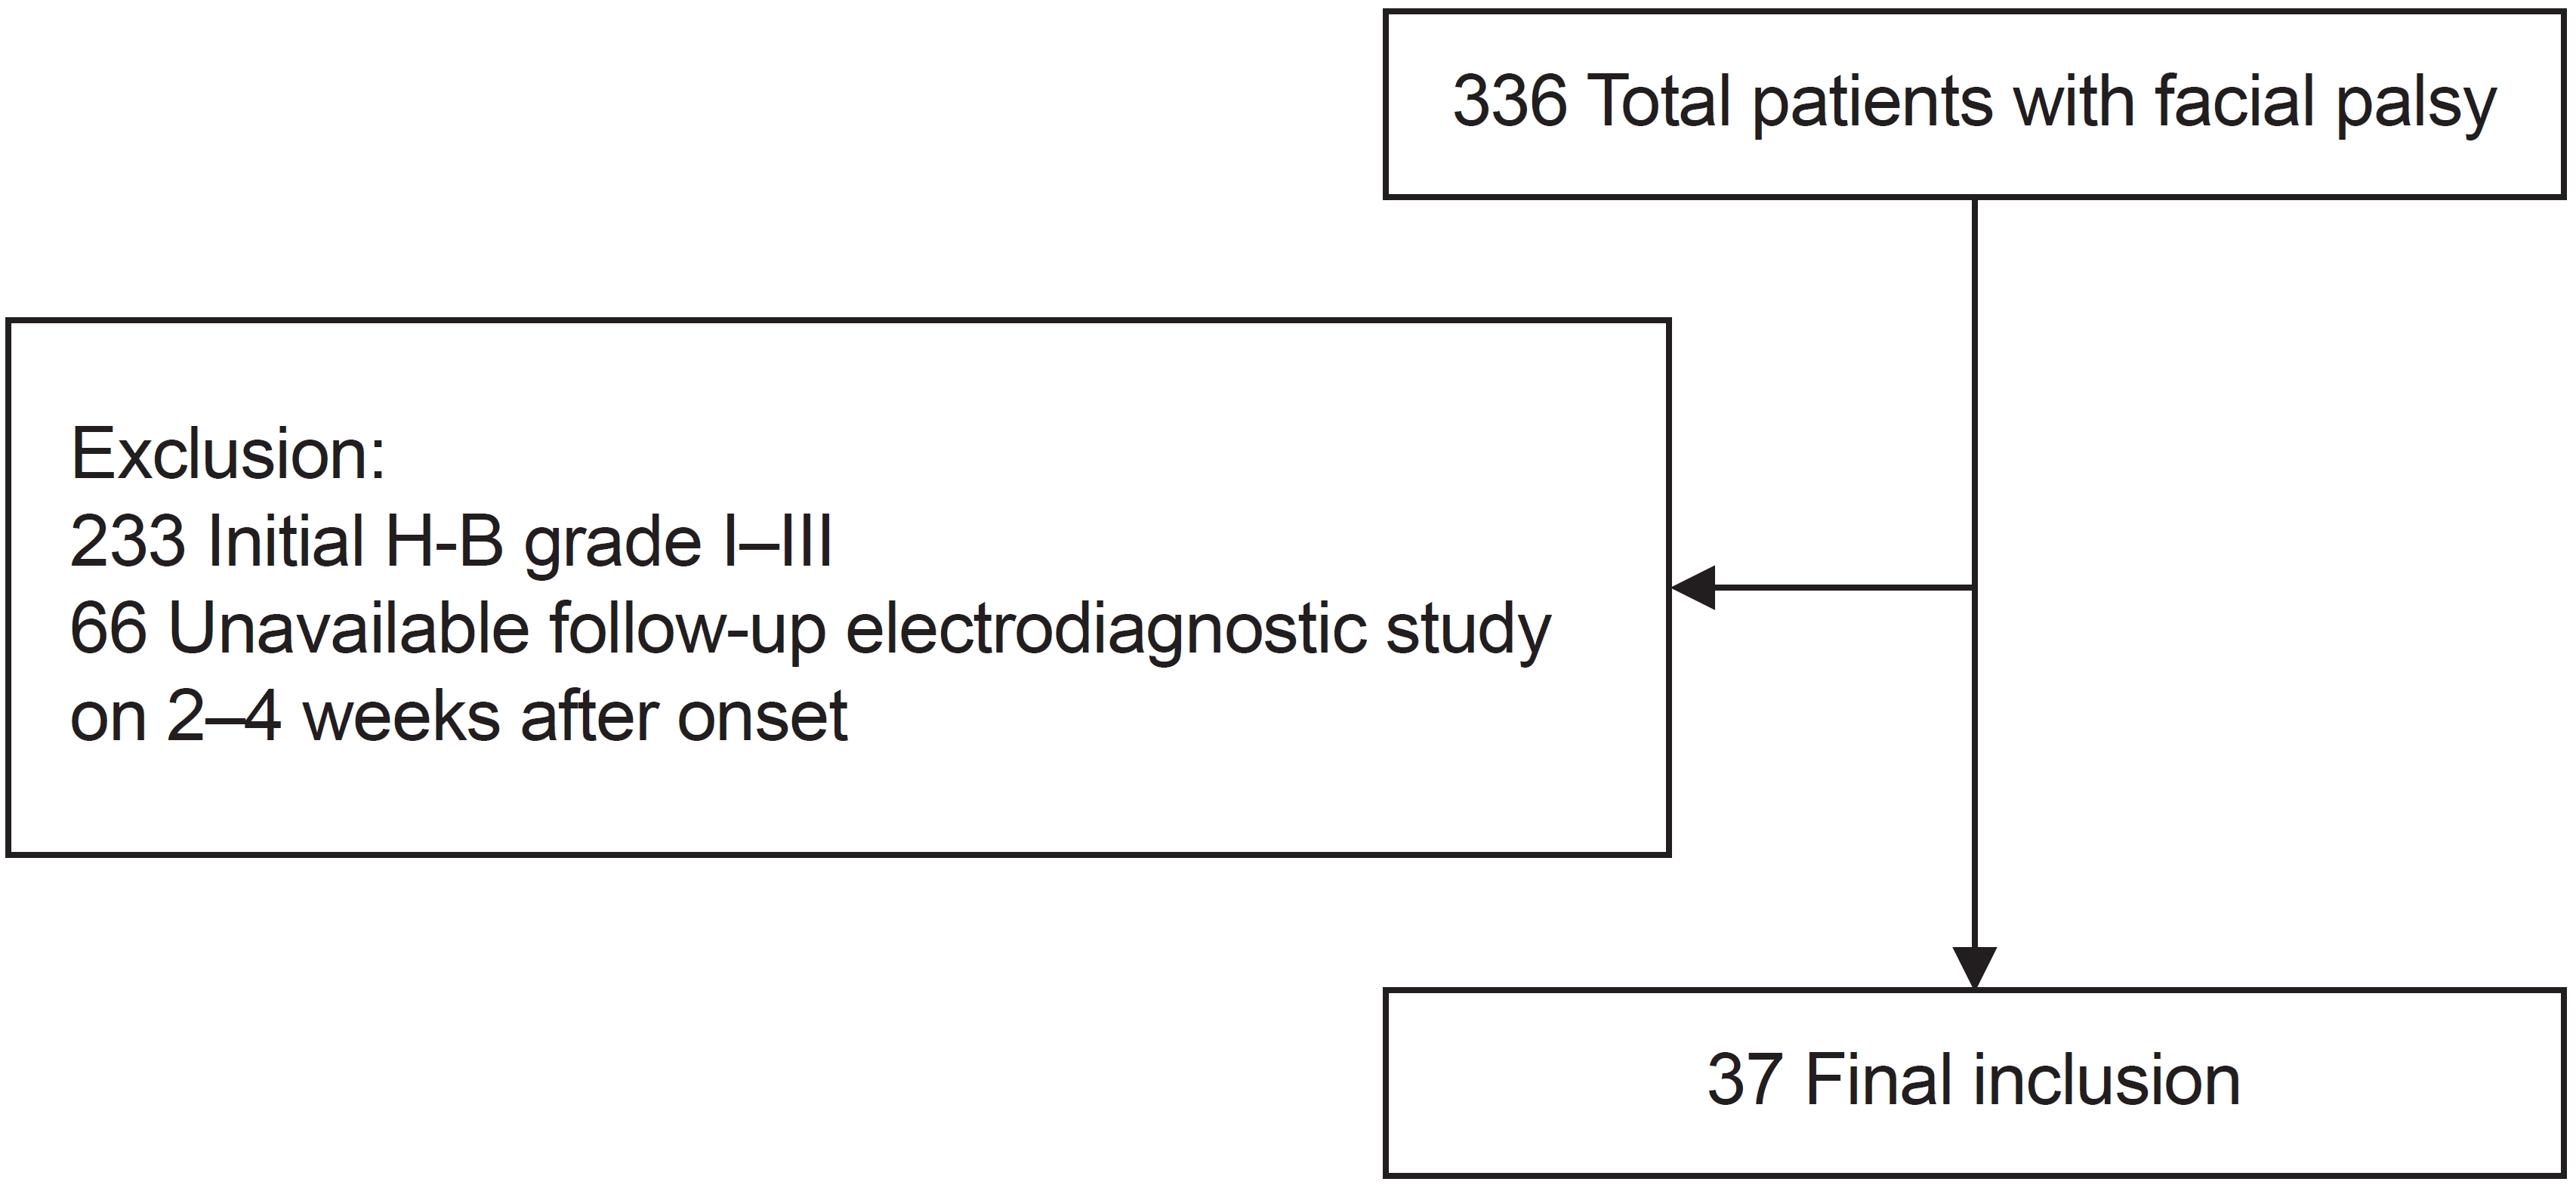
Patient inclusion flow chart. H-B, House–Brackmann.

Patient characteristics
Our study was approved by KUMC Institution Review Board (approval no. 2022-10-014) on November 7, 2022. This is a retrospective study, and informed consent was not required. Patient data would not be shared with outside parties.
Electrodiagnosis
An electrodiagnostic evaluation was performed using the Nicolet EDX® system and Synergy software program (Natus Medical, Inc.). Only patients who underwent electrodiagnosis 2–4 weeks after symptom onset were included because at least 10–15 days are required [9] for electrodiagnosis to adequately reflect the full effect of axonal loss.
ENoG amplitudes for both sides of the four facial muscles (frontalis, nasalis, orbicularis oculi, and orbicularis oris) were collected, along with the average values for the four muscles. The trimmed mean (mean value of conserved ENoG amplitude excluding the maximum and the minimum values) was also considered to minimize the effect of outliers. The preserved amplitudes of ENoG (%) on the affected side compared to the unaffected side were used to assess the degree of nerve fiber degeneration [10] and compare the good and poor recovery groups. The amount of preserved ENoG amplitude was calculated as follows:
During the examinations, the facial nerve was stimulated supramaximally at the stylomastoid foramen, and baseline-to-peak-amplitudes of compound motor action potentials were measured.
Laboratory evaluation
Several previous studies considered a high inflammatory level a poor prognostic factor for facial palsy [11,12]. C-reactive protein (CRP) is a positive acute-phase inflammatory biomarker, and albumin is a negative acute-phase protein. CRP to albumin ratio (CAR) is widely used as a prognostic factor in either short or long-term disease inflammation [10]. Neutrophil to lymphocyte ratio (NLR) has been recommended as a marker for systemic inflammation and facial palsy [13]. This study included CAR, NLR, and white blood cell (WBC) count as prognostic parameters. Serum CRP levels (mg/dL), albumin level (g/dL), and WBC with differential counts obtained from blood samples collected within 7 days from symptom onset were used.
Statistical analysis
Differences in side-to-side ENoG amplitude percentage, age, and laboratory results between the two groups were assessed using Welch’s t-test, considering the unequal variance of variables. Fisher’s exact test assessed categorical variables.
To identify the discriminatory capability of each ENoG amplitude, we constructed receiver operating characteristic (ROC) curves. Each ROC curve’s area under the curve (AUC) was also calculated. The cutoff values of ENoG amplitudes with optimized sensitivity and specificity were evaluated using the Youden Index.
Finally, a logistic regression model was constructed to determine the association between ENoG amplitudes and clinical outcomes. Statistical analysis was performed using R Statistical Software (R-studio version 4.2.1; R Foundation for Statistical Computing). Statistical significance was set at p<0.05.
RESULTS
Patients’ characteristics
A total of 336 patients diagnosed with facial palsy were enrolled, of which 103 patients were considered to have severe facial palsy. Ultimately, 37 patients with available electrodiagnostic study data for the first 2–4 weeks (16.9±4.2 days) after symptom onset were included. Twenty-nine of the patients showed “good recovery,” and the remaining eight showed “poor recovery” at 2 months after symptom onset (Table 1). Idiopathic facial palsy (Bell’s palsy) was the predominant etiology in 22 patients (75.9%) in the good recovery group and 5 (62.5%) in the poor recovery group, followed by Ramsay Hunt syndrome (6 patients [20.7%] in the good recovery group and 1 [12.5%] in the poor recovery group). Three patients had a history of head trauma causing the facial palsy (1 patient [3.4%] in the good recovery group and 2 [25.0%] in the poor recovery group). Although all cases of traumatic facial palsy showed mild traumatic subarachnoid hemorrhage on brain computed tomography, the patients were treated conservatively. The patients with traumatic facial palsy were confirmed to have peripheral-type facial palsies by experienced physicians. All (94.6%), except two patients, were diagnosed with facial palsy for the first time. One patient in each group had previously experienced idiopathic facial palsy. One patient in the good recovery group had facial palsy on the ipsilateral side (left) 6 years earlier. The other patient in the poor recovery group had facial palsy on the contralateral side (right) 15 years prior. Neither reported sequelae (such as facial motor weakness or asymmetry) after their first episode of facial palsy.
Electroneuronography
Electrodiagnostic procedures were performed at an average of 16.9 days after symptoms appeared. Preserved ENoG amplitudes of patients in the good recovery group were significantly higher than those of patients in the poor recovery group in terms of individual, average, and trimmed means (p<0.005). The optimal cutoff values of ENoG for each muscle were obtained by plotting ROC curves (Fig. 2). The optimal cutoff, which constrained either the sensitivity or specificity of the test, was 95% for the frontalis, nasalis, and orbicularis oculi muscles. The orbicularis oris muscle had the largest AUC (87.3%; Table 2).
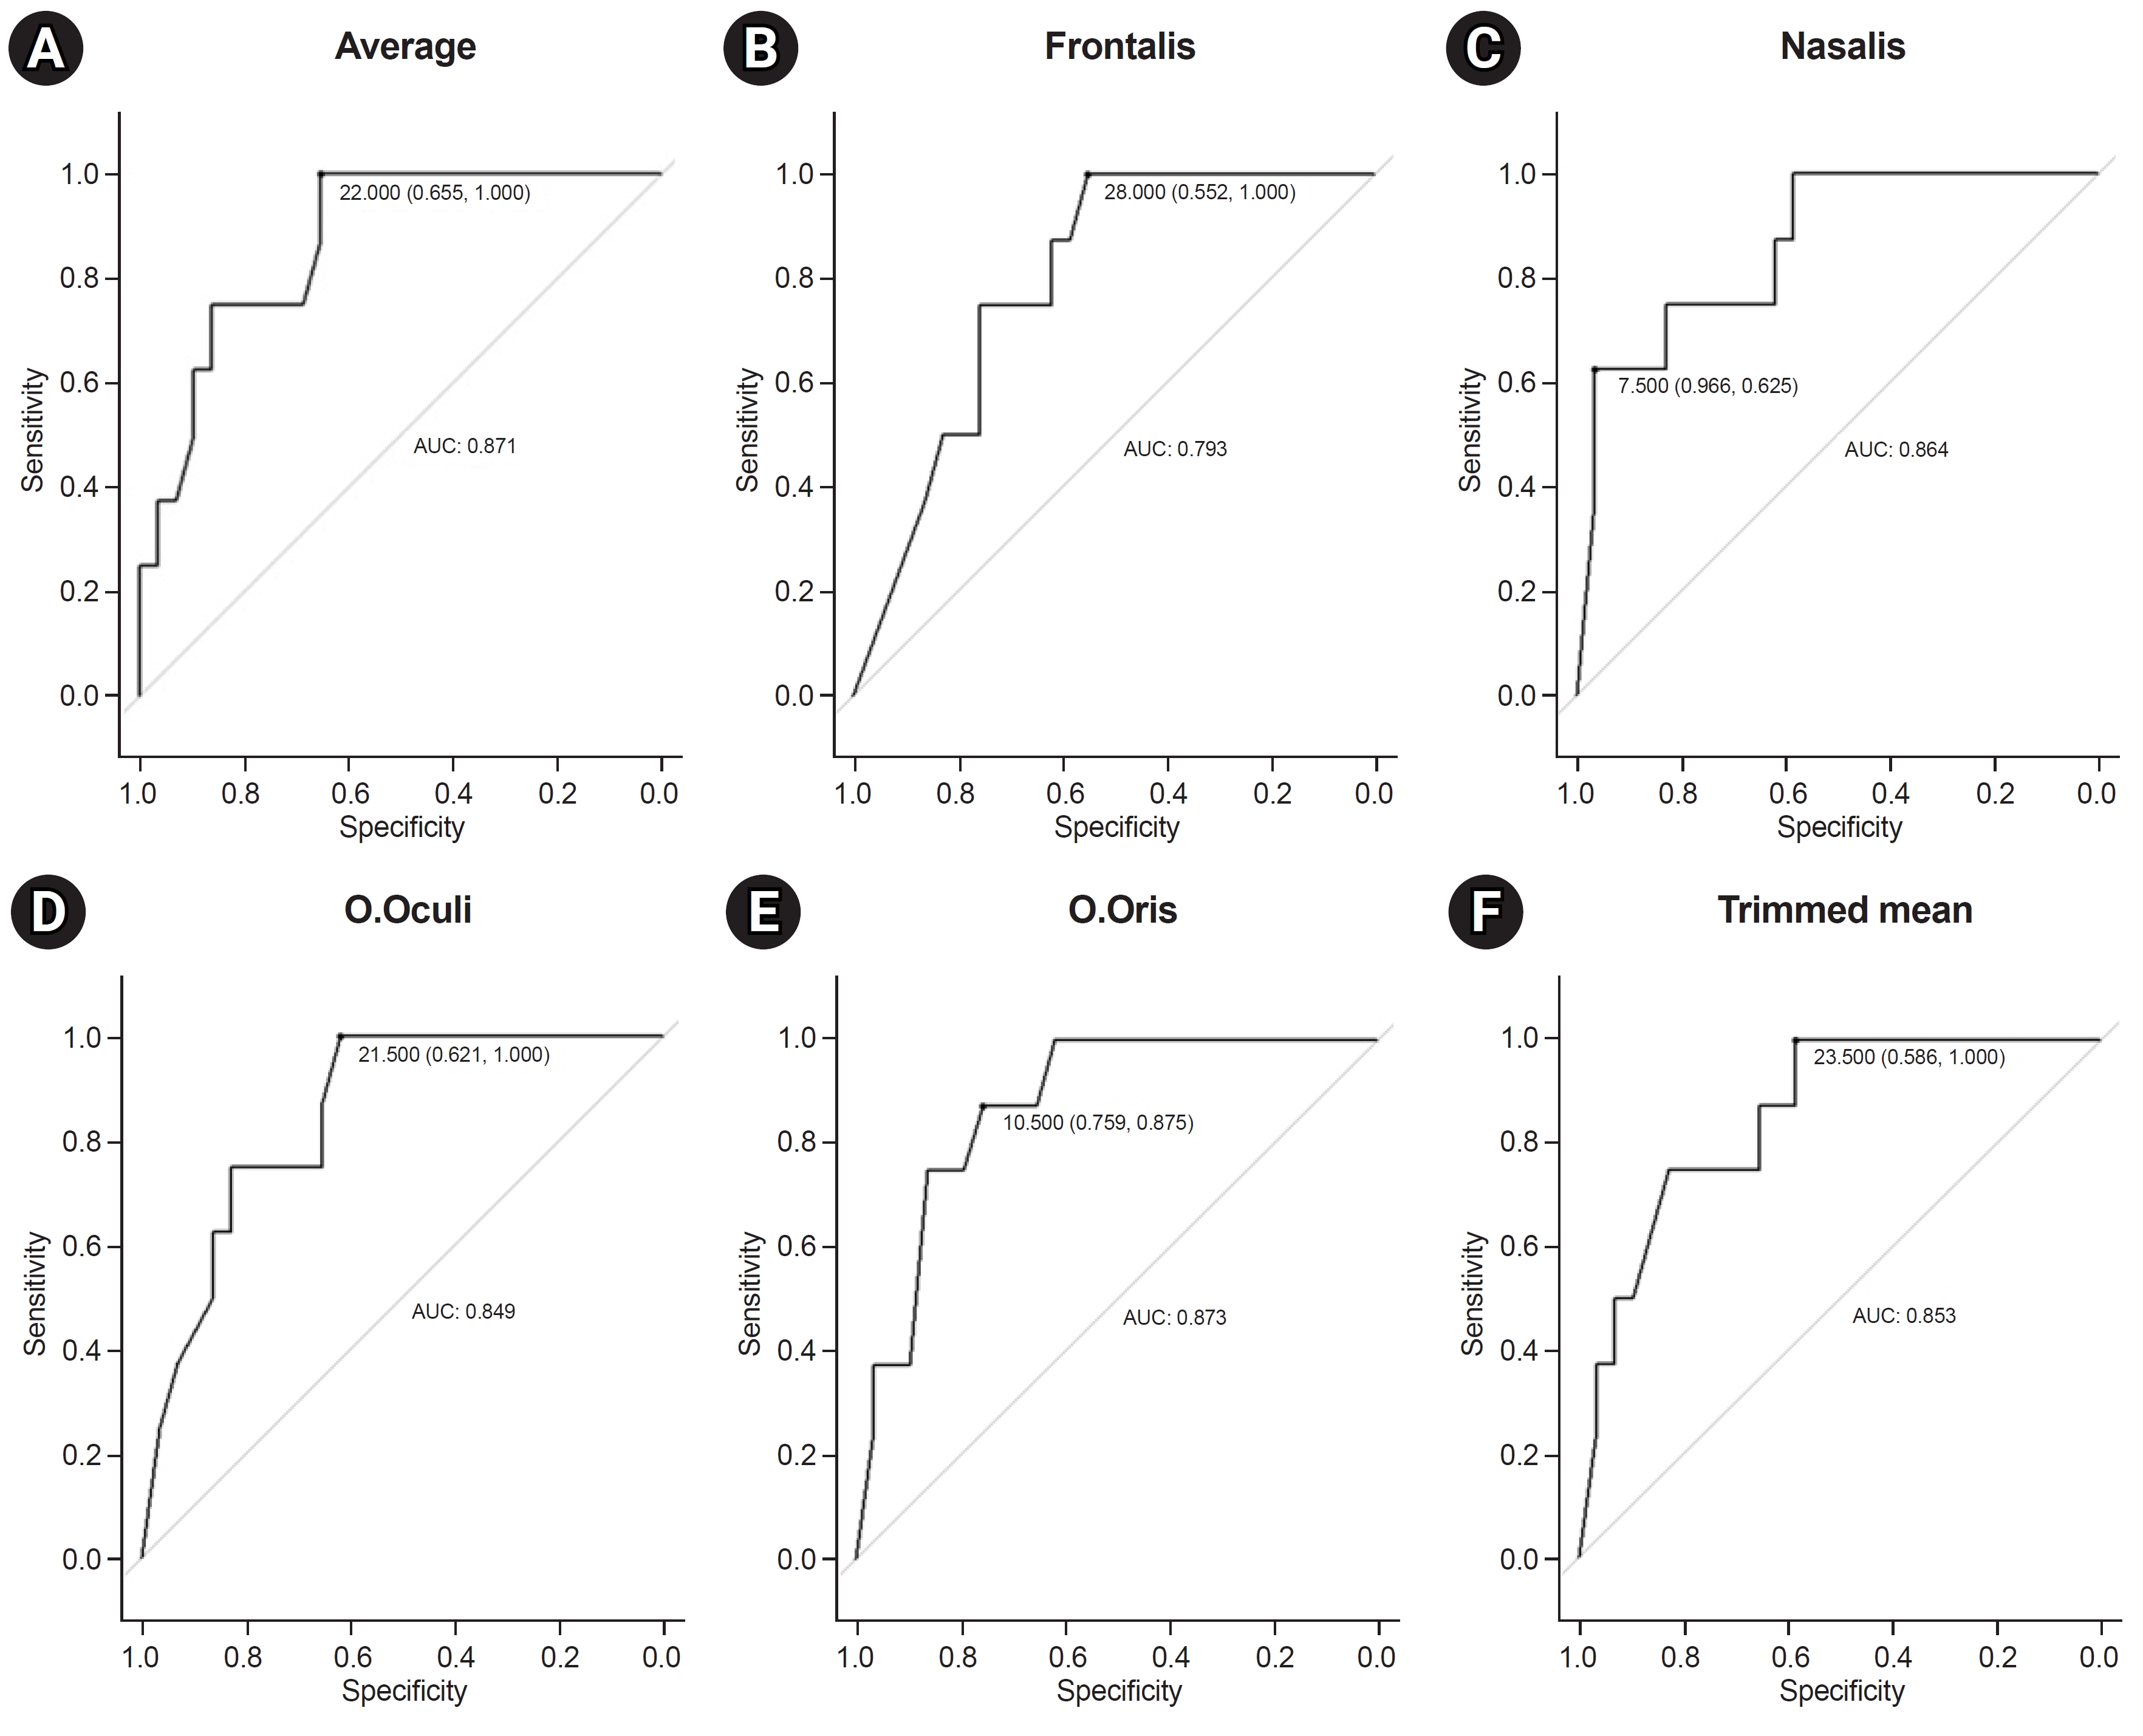
Receiver operating characteristic (ROC) curves for the discriminatory capability of each muscle. (A) Preserved electroneuronography (ENoG) amplitude averages for all four facial muscles. Preserved ENoG amplitudes of the frontalis (B), nasalis (C), orbicularis oculi (O.Oculi) (D), and orbicularis oris (O.Oris) (E) muscles. (F) Trimmed means of the preserved ENoG amplitude of all four muscles.
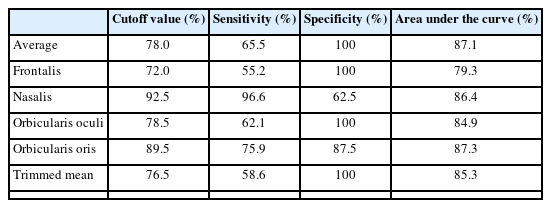
Optimal cutoff values for each facial muscle
Laboratory analysis
Blood samples were acquired within 7 days from symptom onset. Five patients in the good recovery group were unavailable for sample collection. The two groups had no significant differences in CAR, NLR, and WBC counts. Patients with a traumatic etiology (n=2, the other patient was unavailable for sampling) displayed a marked elevation of CRP level. Nevertheless, there were no significant differences in the results after removing these two patients to exclude inflammatory conditions caused by trauma (CAR, p=0.78; NLR, p=0.42; and WBC counts, p=0.57) [14].
Prognosis prediction model
Logistic regression with backward elimination was conducted to obtain a significant value that can predict prognosis. We found that the lower preserved ENoG amplitude of the nasalis muscle (p=0.004) and sex (p=0.038) were negative prognostic factors in patients with severe facial palsy (Table 3).

Logistic regression model used to predict poor recovery in severe cases of facial palsy
DISCUSSION
It is established that ENoG amplitude has a prognostic value in facial palsy. Our study showed that ENoG amplitude also has predictive value in severe facial palsy. In our study, statistically significant differences were found between patients with severe facial palsy in the good and poor recovery groups concerning the facial nerve degeneration rate of each of the four facial muscles (frontalis, nasalis, orbicularis oculi, and orbicularis oris) and their mean values and trimmed means (p<0.005).
The ENoG amplitudes of the four facial muscles showed significant differences between the two groups; however, only that of the nasalis muscle had prognostic value for severe facial palsy. This finding is concurrent with those of several other studies. Kim et al. [15] studied the prognostic value of ENoG of Bell’s palsy at the orbicularis oculi and nasolabial fold in 81 patients and found that the ENoG of the nasolabial fold had more prognostic value than that of the orbicularis oculi. The facial nerve has five extracranial terminal branches: temporal, zygomatic, buccal, marginal mandibular, and cervical. According to most literature and anatomy textbooks, the frontalis muscle is innervated by the temporal branch, the orbicularis oculi muscle is double-innervated by the temporal and zygomatic branches, the buccal branch innervates the nasalis muscle, and the orbicularis oris muscle is double-innervated by the buccal and mandibular branches [16,17]. In our study, we adopted the muscles representative of each branch in standardized settings; temporal-frontalis, zygomatic-orbicularis oculi, buccal-nasalis, and mandibular-orbicularis oris. Martínez Pascual et al. [18] studied the extracranial course of the facial nerve in 23 Caucasian adult cadavers and found that the buccal branch has the most varied origin. It can be inferred that muscles located in the central part of the face are more significant since they are dominated by the facial nerve plexus [15]. Since ENoG amplitude reflects nerve fibers reacting to electrical stimulation and their synchronicity [19], the ENoG of muscles that are mostly innervated by the facial nerve plexus, such as central muscles of the face, e.g., the nasalis (or nasolabial fold as in Kim et al. [15]), is more significant than that of their counterparts for predicting recovery from facial nerve insult. Similarly, Engström et al. [20] reported that initial (mean, day 11) ENoG measurements of the nasalis and/or mentalis were the best single recordings for predicting favorable outcomes in patients with Bell’s palsy.
Sex has a predictive value for severe facial palsy. Although it seems controversial whether sex is a risk factor for facial palsy, several studies have suggested a male predominance in Bell’s palsy. According to the National Health Insurance Service National Sample Cohort data of Korea from 2006 to 2015, the male sex is a significant risk factor for Bell’s palsy [21]. Another Korean population-based study reported similar epidemiologic results [22]. In our study, the male sex appeared to have a slight predominance in the overall incidence of severe facial palsy (64.9%). Male patients exhibited better prognoses in the 2-month post-onset period in another previous Korean study. The retrospective cohort study, which aimed to establish whether clinical prognostic factors differ according to H-B grade, found that among patients with severe facial palsy (initial H-B grades, 5–6), male had a more favorable outcome than female (odds ratio, 1.12) [23].
Many prior studies have shown that a <90% degeneration rate of the affected facial nerve has a favorable outcome [5-7]. Our ROC analysis showed that the best cutoff values of preserved ENoG amplitude (%) for sensitivity and specificity were 72.0%, 92.5%, 78.5%, and 89.5% in the frontalis, nasalis, orbicularis oculi, and orbicularis oris muscles, respectively. The nasalis and orbicularis oris muscles displayed similar outcomes to those in previous studies, whereas the frontalis and orbicularis oculi muscles showed stricter cutoff values (72.0% and 78.5%, respectively). It seems that the more severe the nerve damage, the more variable the regenerative potential for each branch of the facial nerve, resulting in heterogeneous regeneration patterns. Since prior studies did not consider facial palsy severity, a 90% prognostic threshold cannot be uniformly applied to severe facial palsy.
The pathophysiology of idiopathic facial palsy remains unclear; it is considered that an inflammatory mechanism is a major contributor to the disease pathogenesis. Cayir et al. [11] reported that higher CAR and NLR levels were associated with poor prognoses in patients with Bell’s palsy. Our study did not find significant differences in laboratory data (CAR, NLR, and WBC count) between the two groups in the univariate analysis or logistic regression model. These inflammatory markers can identify levels of inflammation at the acute phase; however, their responses to strong anti-inflammatory medications (such as corticosteroids) vary among individuals. Additionally, there were differences in the time when anti-inflammatory medication was administered, the time when the blood test was performed, and the pathophysiology of the patients. Eliminating this variable response rate could yield a better probability of predicting disease progression; this may be achieved by controlling the blood sampling time before treatment.
This study has some limitations. First, in excluding patients who underwent electrodiagnosis other than 2–4 weeks from symptom onset, 66 patients (64.1%) with missing values were detected, resulting in bias. However, Wallerian degeneration in the peripheral facial nerve takes 72 h after symptom onset to reflect in electrodiagnostic tests and approximately 21 days for complete degeneration [3,4]. Thus, a strength of this study is the inclusion of only electrodiagnostic data collected after this period (at least 2 weeks after the onset of symptoms). Second, the laboratory data of five patients (17.2%) in the good recovery group were unavailable, and the mean imputation method was used to obtain the missing values. Third, the follow-up period was limited to 2 months. In most cases of facial palsy, the complete recovery rate reaches a plateau after 3 months from onset [24]. However, in some cases, recovery occurs after 1 year; therefore, a longer follow-up period would have yielded ENoG amplitude values that can predict the final recovery state.
In conclusion, this study suggests that the female sex and lower ENoG of the nasalis muscle acquired 2–4 weeks from symptom onset have negative prognostic values for the 2-month functional outcome of severe facial palsy.
Notes
CONFLICTS OF INTEREST
No potential conflict of interest relevant to this article was reported.
FUNDING INFORMATION
None.
AUTHOR CONTRIBUTION
Conceptualization: Woo M, Lee HH. Methodology: Woo M, Lee HH. Formal analysis: Woo M, Yuk D, Choi SW. Project administration: Woo M, Lee HH. Visualization: Woo M, Yuk D, Choi SW. Writing – original draft: Woo M. Writing – review and editing: Woo M, Lee HH, Lee J. Approval of final manuscript: all authors.