Change of Femoral Anteversion Angle in Children With Intoeing Gait Measured by Three-Dimensional Computed Tomography Reconstruction: 3-Year Follow-Up Study
Article information

Abstract
Objective
To investigate long-term changes in femoral anteversion angle (FAA) in children with intoeing gait and to identify factors that affect FAA changes.
Methods
We retrospectively analyzed three-dimensional computed tomography data from 2006 to 2022 of children with intoeing gait with ≥3 years of follow-up without active treatment. The study examined the mean changes in FAA, the effects of sex, age, and initial FAA on FAA change, and mean FAAs by age. Changes in FAA severity up to eight years of age were also observed and analyzed by sex.
Results
A total of 126 lower limbs of 63 children (30 males, 33 females) with intoeing gait were included, with a mean age of 5.11±1.05 years and a mean follow-up period of 43.59±7.74 months. The initial FAA was 41.42°±8.29° and the follow-up FAA was 33.25°±9.19°, indicating a significant decrease (p<0.001). Significant correlations were observed between age and changes in FAA, as well as between initial FAA and changes in FAA (r=0.248, p=0.005; r=-0.333, p<0.001). At age 8 years, only 22 limbs were classified as having mild FAA severity.
Conclusion
During the follow-up period, children with intoeing gait had a significant decreased in FAA. No significant difference in FAA change was found between sex, but younger children and those with greater initial FAA were more likely to have decreased FAA. However, most children retained moderate to severe severity of increased FAA. Further studies are required to validate these findings.

INTRODUCTION
Intoeing gait is a major cause of pediatric outpatient referral to pediatric clinics and is caused by increased femoral anteversion, internal tibial torsion, and metatarsus adductus [1]. Especially after the age of 3 years, increased femoral anteversion is known to be the most frequent cause of an intoeing gait [2]. Femoral anteversion angle (FAA) is defined as the angle formed by the transcondylar axes of the distal femur and proximal femoral neck. Typically, the FAA is approximately 30° at birth; however, in the majority of cases, it decreases to a range (15°–25°) during early adolescence. Generally, it shows spontaneous improvement before the age of 8 years without specific interventions [3,4]. In addition to aesthetic issues, gait can lead to functional problems such as unsteady gait and frequent falls [5]. Furthermore, compensatory external tibial rotation can be induced in the long term, causing pain in the knee and hip joints. Previous studies have demonstrated an association between increased FAA levels and femoroacetabular impingement, labral tears, and patellofemoral malalignment [6-8].
Most cases of intoeing gait can be managed conservatively with simple postural education as well as the use of orthotics and shoe modifications [9]. However, evidence for the effectiveness of conservative management is still lacking. In some rare cases, surgical intervention such as femoral derotational osteotomy may be required. Although there are no unified guidelines for surgical indications, Nelitz [10] suggested in their review that surgical treatment should be considered for symptomatic patellofemoral malalignment and FAA exceeding 30°. Hartigan et al. [11] established surgical indications for extreme anteversion of 35° or more, prominent intoeing gait, hip internal rotation exceeding 65° on physical examination, and the presence of anterior hip pain. Therefore, it is essential for clinicians to closely monitor children with intoeing gait and determine whether active intervention is necessary if increased FAA levels do not spontaneously improve. Accurate measurement of the FAA is crucial for making informed decisions.
Traditionally, computed tomography (CT), magnetic resonance imaging, and other imaging techniques are commonly used to measure the FAA. However, errors can occur depending on the position of imaging owing to the complex three-dimensional (3D) structure of the femur, and the measured values may vary by up to 20°, even for the same person, depending on the imaging technique and landmarks used [12,13]. Recently, studies using 3D-CT to measure FAA have been published to compensate for these errors, and it has been demonstrated that 3D-CT is a useful tool for measuring FAA with high accuracy and reliability [12,14,15]. In addition, Shalaby et al. [16] reported that the 3D technique is superior to the two-dimensional technique in measuring FAA in patients with unilateral developmental dysplasia of the hip.
Until now, most studies reporting FAA changes in children with intoeing gait have been based on Western data [17,18]. In countries where floor culture is prevalent, such as Japan and Korea, children with increased FAA are more likely to assume the W-sitting position, which can act as a significant impediment to the natural resolution of FAA. A previous study investigated the changes in FAA in Korean children with an intoeing gait using 3D-CT [19]. The study examined the effects of age, sex, and initial FAA on FAA changes over time and showed the largest decrease in the 4–6-year-old group during a follow-up period of >1 year. Additionally, it was found that females, younger children, and those with larger initial FAA had greater FAA changes.
To the best of our knowledge, few studies have observed changes in the FAA in children with intoeing gait for a follow-up period of at least three years using 3D-CT. Furthermore, no previous study has examined long-term FAA changes in Asian populations. Therefore, the primary objective of this study was to investigate longitudinal changes in femoral FAA in Korean children with intoeing gait using 3D-CT for a minimum follow-up period of three years. Second, we analyzed the correlation between age, initial FAA level, and sex and their influence on FAA reduction. Finally, we sought to determine the number of children with an intoeing gait who achieved a normal or near-normal FAA by the time they turned 8 years old compared to their initial severity.
METHODS
Participants
We retrospectively analyzed 3D-CT data of children with intoeing gait in Gyeongsang National University Hospital from 2006 to 2022. The initial screening process included patients who presented with an intoeing gait and had undergone 3D-CT measurements at least three times. The inclusion criteria were exhibiting more than 5° of internal rotation on visual inspection and preference to observe the natural progression of FAA reduction over time through periodic follow-up 3D-CT scans rather than undergoing active treatment, such as using corrective devices. The exclusion criteria were as follows: (1) an interval of <3 years between the initial and final follow-up 3D-CT scans; (2) implementation of corrective devices or other interventions during the follow-up period; and (3) the presence of abnormal gait due to orthopedic problems or developmental disorders.
This retrospective study was approved by the Institutional Review Board (IRB) of Gyeongsang National University Hospital (IRB No. 2023-02-011). The requirement for informed consent was waived due to the retrospective design of the present study. However, their personal information was anonymized and de-identified before analysis.
Initially, a total of 171 patients were screened. Among them, 68 patients had intervals of less than three years between their initial and follow-up 3D-CT scans, and 17 individuals were excluded due to chief complaints other than intoeing gait, the presence of neurodevelopmental disorders, or other orthopedic issues. Another 23 patients were excluded due to the implementation of active treatment such as corrective devices. Finally, a total of 126 limbs from 63 children were included in the analysis (Fig. 1). All initial and available follow-up images were included, with a minimum time interval of 3 years between the first and last 3D-CT scans.

Flowchart of patient inclusion. 3D-CT, three-dimensional computed tomography.
In order to evaluate the improvement of intoeing gait, we included initial and follow-up foot progression angle (FPA) data measured using the Gaitview AFA-50 system (alFOOTs, Seoul, Korea) for patients who underwent dynamic foot pressure measurement through chart review.
The children did not receive corrective devices or surgical treatment, but they received simple posture-correction education, such as the tailor position and Achilles tendon and hamstring stretching, during their initial visit. The participants visited the follow-up clinic at intervals of 3–6 months to confirm whether their intoeing gait had improved visually and were encouraged to perform simple posture correction exercises during each visit. Additionally, to evaluate changes in the FAA angle, 3D-CT was performed at intervals of approximately one year or more.
In this study, the severity of femoral anteversion was assessed as a categorical predictor variable and classified as mild (<25°), moderate (25°–40°), or severe (>40°). The cutoff values were selected based on the results of a previous investigation of 100 Korean children with intoeing gait, where the average initial femoral anteversion (with standard deviation) was 31.1°±7.8°, as determined by 3D-CT scans [19]. the “moderate” category for femoral anteversion severity was determined by selecting values around one standard deviation below and above the previously established mean of 31.1°±7.8° on 3D-CT images. As a result, the lower and upper values of the “moderate” category were set at 25° and 40°, respectively.
We calculated the severity of excessive FAA using the FAA value measured at the initial visit and when the child was 8 years old. We compared the severity of excessive FAA between these time points. Furthermore, we observed changes in FAA severity up to 8 years of age and analyzed them according to sex. The reason for reevaluating the severity at the age of 8 years was that Fabry et al. [17] reported no significant regression of increased femoral anteversion after this age.
Radiologic evaluations using 3D-CT
A 64-channel CT scanner (Brilliance 64; Philips Medical Systems, Amsterdam, Nederland) was used for the CT scans. Children were instructed to lie supine on a sliding table with lower limbs fully extended. The legs were secured with a strap to prevent movement. CT images were obtained for both legs. Image acquisition parameters were: field of view=314 mm; detector collimation=64.0×0.6 mm; table movement speed=44.4 mm/rotation; gantry rotation speed=1 second; kVp=120; and mAs/slice=36. The image was remodeled with a thickness of 2 mm and spacing of 1 mm.
The volume-rendering method was employed to reconstruct the 3D images using the Extended Brilliance Workspace ver. 2.0 software from Philips Medical Systems. Corresponding images were acquired after 3D-CT reconstruction (Fig. 2). Based on the obtained images, FAA was measured by a doctor from the Department of Rehabilitation Medicine. We employed the method for FAA measurements as described by Byun et al. [14] in their study.
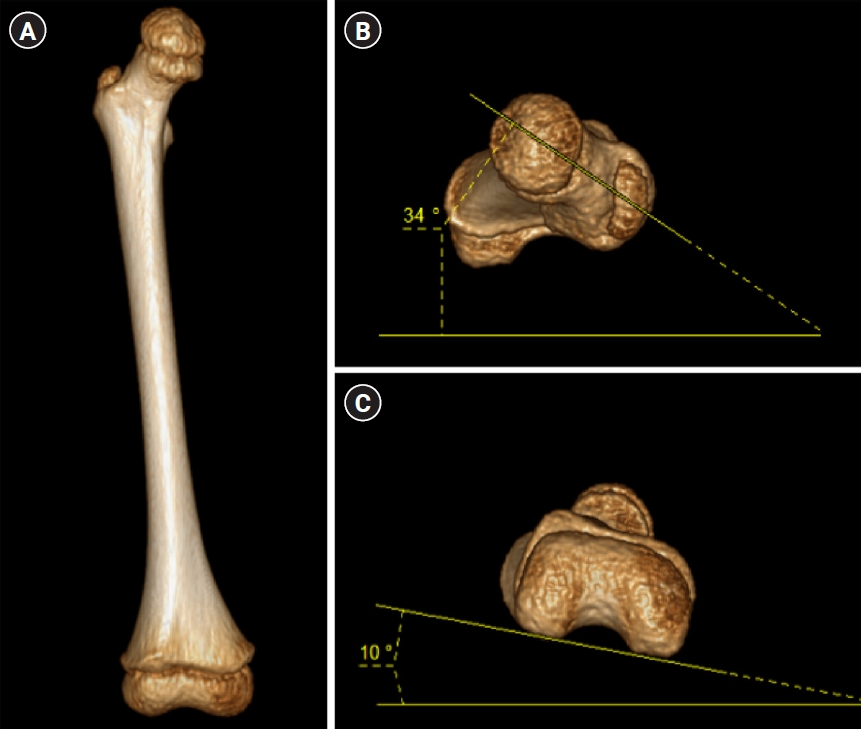
(A) Anteroposterior view of right femur obtained from three-dimensional computed tomography. (B) Looking down view of the femur and the measurement of femoral neck angle. (C) Upside-down view of the femur neck and the measurement of trans-condylar axis.
The femur neck angle was calculated by measuring the angle between the neck axis of the femur and the horizontal axis. The neck axis of the femur, which served as the reference axis for proximal measurement, was defined as the line that intersected two central points of the neck and head of the femur in a craniocaudal direction. To calculate the condylar angle, the angle of the medial and lateral condylar axis against the horizontal axis was measured. Similarly, the medial and lateral condylar axis was used as the reference axis for distal. It was set as the line encountering the most posterior aspects of medial and lateral condyles of the distal femur from the caudocranial of the 3D image (Fig. 2C). The FAA was calculated by subtracting the condylar angle from the femur neck angle if they were oriented in the same direction against the horizontal axis or by adding the two angles if they were in the opposite direction.
Data analysis
Chart reviews were conducted to collect the patients’ clinical information, including age at the initial visit, sex, body weight, preterm birth status, presence of spasticity, and Achilles tendon tightness, as well as the FAA in both limbs at the time of the 3D-CT scan. The follow-up periods between the initial and final FAA were also recorded. FAAs of both lower extremities were calculated from all 3D-CT scans, allowing us to obtain values for the initial FAA, final follow-up FAA, and FAA changes. The difference between the initial and follow-up FPA was also analyzed as well. Additionally, we analyzed the average FAA according to age at the time of 3D-CT using all the 3D-CT data obtained in this study. Lastly, the study classified the severity of patients’ initial FAA values and those measured at approximately 8 years of age and compared the changes in severity between the two time points.
Statistical methods
Normal distribution was checked for all data; otherwise, non-parametric tests were performed. We performed a ANOVA and Tukey honest significant difference test to identify differences in demographic and clinical characteristics. To confirm differences in clinical findings between the two groups, we conducted independent t-tests for continuous variables and chi-squared tests or Fisher’s exact tests for categorical variables. Statistical significance was set at p<0.05, and R3.6.3 (R Foundation for Statistical Computing, Vienna, Austria) was used for all analysis. We conducted correlation analysis to investigate the relationship between age and changes in FAA as well as between initial FAA and changes in FAA, using Pearson’s correlation coefficient.
RESULTS
A total of 63 participants were included in the study, 30 of whom were male and 33 were female, with mean ages of 5.11±1.05 years and 5.27±1.14 years, respectively. No significant difference existed in age between the two groups. The average period between the initial FAA and the last follow-up 3D-CT was 43.59±7.74 months (Table 1). A total of 252 3D-CT images were obtained from all patients during the follow-up period, which allowed us to obtain FAA data for 504 limbs according to age (Fig. 3).
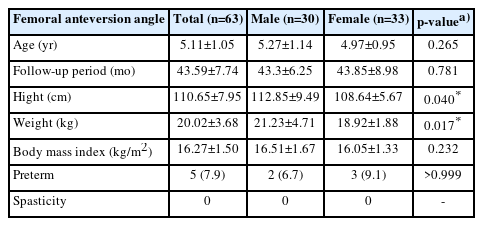
The characteristics of the patients studied
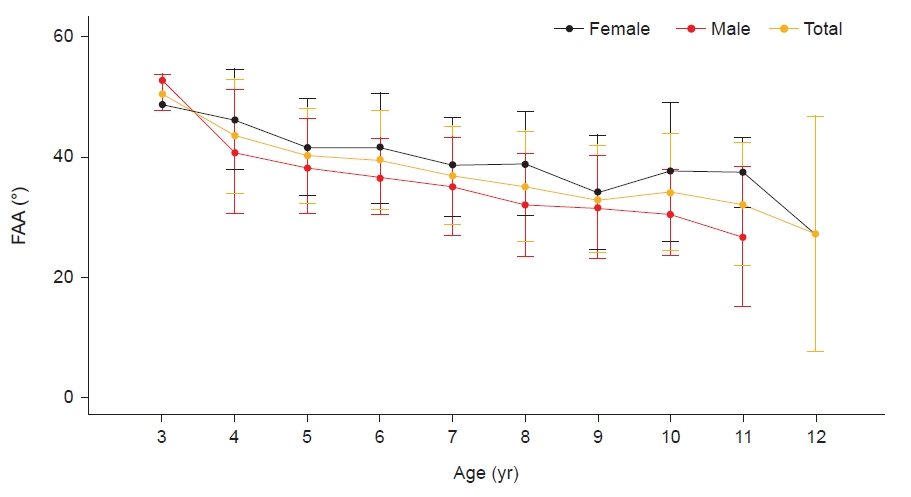
Changes in femoral anteversion angle (FAA) measured from total three-dimensional computed tomography images according to age.
Mean change in FAA and effects of sex on FAA changes
The total initial FAA was 41.42°±8.29°, and the follow up FAA was 33.25°±9.19°, showing a significant decrease in angle (p<0.001). The initial FAA and follow-up FAA for male were 38.53°±8.88° and 30.59°±8.34°, respectively. For female, the initial FAA and follow-up FAA were 44.05°±6.84° and 35.67°±9.37°, respectively. Both males and females showed significant angle changes in the follow-up FAA compared to the initial FAA.
The initial and follow-up FAAs of male and female children differed significantly, with females having larger initial FAA than males. However, no significant difference was found in FAA change between males (-7.95±7.52) and females (-8.38±6.67) based on sex (Table 2).

Initial and follow-up FFA, and changes in FFA according to sex
Differences between the initial and follow-up FPA
Dynamic foot pressure measurement was measured for 57 out of 63 patients, from which the initial and follow-up FPAs were obtained. The mean initial FPA was -10.09°±3.44°, while the follow up FPA was -0.74°±3.76°, indicating a significant difference in the angle between the two time points (p<0.001; Table 3).
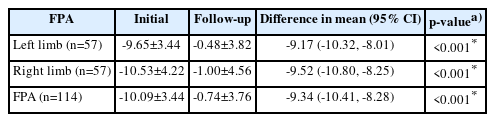
Initial and follow-up foot progression angle
Correlation analysis of age and FAA change as well as initial FAA and FAA change
A significant correlation was found between the initial age at the time of 3D-CT imaging and the change in FAA, with a greater change observed in younger children (r=0.248, p=0.005). The change in FAA was found to be significantly greater when the initial FAA was larger (r=-0.333, p<0.001) (Fig. 4).

Femoral anteversion angle (FAA) change was greater in younger children (r=0.248, p=0.005) (A) and in those with higher initial FAA (r=-0.333, p<0.001) (B), according to correlations with age and initial FAA, respectively.
Change in severity of increased FAA
We classified the initial FAA and the FAA measured at approximately 8 years of age in 63 patients according to the defined severity criteria.
Of the 126 limbs, 71 (56.3%) were classified as severe for initial FAA, while 37 (29.4%) were classified as severe for FAA at approximately 8 years of age. Among the 126 limbs, only 4 (3.2%) were classified into the mild category at the initial age, while 22 (17.5%) were classified into the mild category at the age of approximately 8 years (Table 4).

The severity of the initial femoral anteversion angle and at 8 years old, according to sex
For males, the severity of the initial FAA was mostly moderate at 55.0%, whereas for females, the severity was most common in the severe category at 71.2%. The difference in the severity rates between males and females was significant (p=0.002).
The severity of FAA at 8 years of age was most commonly in the moderate category for males (65.0%) and females (42.4%). However, when improvement was assessed according to sex, 43.3% of males and 42.4% of females showed improvement, and there was no significant difference between the sexes in the rates of severity change (Fig. 5).

The change in femoral anteversion angle severity between the initial measurement and at age 8.
DISCUSSION
We aimed to investigate changes in FAA in children with an intoeing gait using 3D-CT, a reliable and useful tool for measuring FAA [12,14,15,20,21], over a follow-up period of >3 years. We confirmed a significant decrease in the FAA of 126 limbs obtained from 63 subjects over a total period of 43.59±7.74 months, from 41.42°±8.29° to 33.25°±9.19°. This study is significant in that it utilized 3D-CT to follow up on FAA changes in children with an intoeing gait for a relatively long period. Fabry et al. [17] observed changes in 154 limbs from 77 children with an intoeing gait over an average follow-up period of 5 years and 6 months, while Svenningsen et al. [18] conducted a prospective follow-up study on 30 patients for an average of 9 years until a minimum age of 15 years. However, these studies used a biplanar method with simple X-rays, which is known to demonstrate errors of up to 20° and can occur in living subjects owing to positioning errors [22]. On the other hand, the use of 3D-CT reconstruction allows for an accurate determination of femoral torsion, independent of their positioning, as well as the determination of the femoral neck axis [19,22,23].
In the study by Kong et al., [19] the FAA values of 100 children with intoeing gait were measured using 3D-CT and compared over a follow-up period of 18.0±5.4 months. The study found that FAA decreased significantly in both the 4–6-year and 8–10-year age groups, and that younger age and larger initial FAA angle were associated with a greater decrease in FAA, with females showing a greater FAA decreases than males [19]. Consistent with this, our study showed that the greater the initial FAA, the greater the decrease in FAA. This result may be due to the higher compliance with posture correction and stretching exercises among patients with a higher initial FAA angle, as they may have had more prominent symptoms of intoeing gait when they first presented for treatment. However, in our study, there was no objective evaluation of compliance in the medical records; therefore, this could not be used in the analysis. Future studies, including information on patient compliance using questionnaires, could be help assess the effects of simple postural correction and stretching exercises according to age.
Previous studies indicated that younger children tend to exhibit greater changes in FAA [18,19,24]. In particular, Kong et al. [19] analyzed the correlation between age and FAA changes using a similar method to ours. Although they reported a tendency for greater FAA changes in younger children, it was not statistically significant. However, in this study, we obtained results that support the trend of greater FAA changes at a younger age, with a statistically significant correlation. (Fig. 4).
Our results regarding FAA changes according to sex partially differed from those in previous studies [19,25]; we found no difference in FAA change according to sex (Fig. 4). This may be because we observed changes over a longer period compared with the previous studies. Nevertheless, because the initial FAA values were significantly different between males and females in this study, the interpretations should made with caution.
Fabry et al. [17] reported that there was no significant regression of FAA after 8 years of age; thus, active management may not be delayed even if there is severe FAA up to 8 years of age. Accordingly, we investigated the number of limbs that improved to a mild degree of severity at 8 years of age. Our study demonstrated that only a small number of limbs (22 of 126 limbs) were classified as mild in terms of FAA severity at age 8. Although the severity decreased in more than 40% of the patients of both sexes, the majority remained at a moderate to severe degree of FAA. This could be a result of racial differences. In addition, in Asian countries such as Korea and Japan, floor living may result in children adopting positions such as W-sitting more easily. In these cases, improvement may be delayed compared with Western children. Furthermore, contrary to Fabry et al. [17]’s study, some studies reported that FAA continues to regress steadily even after the age of 8 [18,26]; we also observed a somewhat decreasing trend in the graph of FAA obtained from the total 3D-CT images according to age, particularly in the 9–12-year age range. Therefore, if there is a persistent moderate-to-severe degree of excessive FAA even after 8 years of age, continuous follow-up may be necessary during the growth period. However, our results showed a tendency for FAA to decrease with increasing age; therefore, active interventions such as corrective orthosis at a young age may be helpful. Further research is required to confirm these hypotheses.
This study had several limitations. First, owing to its retrospective nature, there may have been selection bias in the included patients. It is possible that parents and children did not visit the hospital if their symptoms improved within three years of their first visit to the outpatient clinic, and even if they did visit, they might have discontinued periodic 3D-CT follow-ups once their condition improved. As a result, children with long-term follow-up 3D-CT who visited the hospital regularly for more than three years may have had severe symptoms from the beginning and may have had little improvement in their condition during the follow-up period, and caution is needed in interpreting the results accordingly. Second, the initial age of the children included in the study was limited to 4–8 years old. Therefore, future studies will need to expand to include larger samples of all ages. Finally, this study only observed changes in FAA in children with intoeing gait who were not actively treated and did not compare the differences between those who received early intervention and those who did not. Future research should compare cases where interventions, such as orthotic devices, are used with cases where no intervention is used to determine the effectiveness of early intervention.
In addition to the limitations of the study design, it is important to consider the practical limitations and potential risks associated with using 3D-CT as a diagnostic tool for evaluating intoeing gait in children. 3D-CT is relatively expensive and can only be performed in relatively large hospitals, which may limit its accessibility to some patients. Moreover, potential risks are associated with radiation exposure especially in children [27,28]. A CT scan employed to evaluate the lower extremity torsional profile releases an average radiation dose of 0.3–0.5 mSv, which is substantially lower—around 5–15 times less—than the radiation exposure linked to pediatric abdominal and head CT scans [29,30]. Furthermore, scans targeting the arms and legs pose a lower risk of provoking conditions like leukemia and brain tumors in children below 10 years, relative to scans focused on the brain, chest, and abdomen [31]. Nevertheless, it’s important to limit the frequency of scanning to mitigate any elevated risk associated with radiation exposure. Therefore, in clinical practice, it is important to carefully evaluate patients’ conditions and consider factors such as age, medical history, and potential risks associated with radiation exposure. Follow-up 3D-CT scans should only be performed if deemed necessary and at appropriate intervals to minimize the associated risks.
Despite these limitations, FAA measurement using 3D-CT can serve as an objective basis for considering active treatment by accurately assessing the degree of improvement in the anteversion angle. This can assist in preventing long-term complications in children whose FAA does not improve spontaneously. The strength of our study lies in the use of the 3D-CT method, which has high intra- and inter-rater reliabilities in measuring FAA [14], to follow up on FAA changes over a relatively long period. These results could be used as valuable data providing information on FAA changes in children with an intoeing gait.
In conclusion, this retrospective study using 3D-CT imaging showed that younger children with intoeing gait and those with greater initial FAA are more likely to exhibit larger decreases in FAA over a minimum 3-year follow-up period. Furthermore, since most children still have moderate-to-severe FAA even after the age of 8 years, periodic follow-up is necessary even if the intoeing gait appears to have improved visually, and early intervention may be necessary. However, the retrospective design and single-center nature of this study have limitations that should be considered when interpreting the results. Future prospective studies with larger sample sizes and longer follow-up periods are required to confirm these findings.
Notes
No potential conflict of interest relevant to this article was reported.
None.
Conceptualization: Shin H. Methodology: Shin H, Park Y. Formal analysis: Kim MJ, Park Y, Project administration: Shin H, Byun H. Visualization: Kim MJ. Writing – original draft: Park Y. Writing – review and editing: Shin H, Byun H, Park Y. Approval of final manuscript: all authors.