Effect of Antigravity Treadmill Gait Training on Gait Function and Fall Risk in Stroke Patients
Article information

Abstract
Objective
To investigate the effect of antigravity treadmill gait training (AGT) on gait function, balance, and fall risk in stroke patients.
Methods
This study included 30 patients with stroke (mean age, 73 years). All subjects were randomly divided into two groups. The intervention group (n=15) performed AGT for 20 minutes, five times per week for 4 weeks. The control group (n=15) received conventional gait training for the same duration. To assess fall risk, the Tinetti Performance-Oriented Mobility Assessment (POMA) was measured. The Berg Balance Scale (BBS), Timed Up and Go test (TUG), and 10-m walk test (10mWT) were measured to assess dynamic balance. All scales were measured before intervention (T0) and at 4 weeks (T1) and 12 weeks (T2) after intervention.
Results
Results showed that the total POMA score, BBS, and 10mWT scores improved significantly (p<0.05) at T1 and T2 in both groups. The POMA gait score (4.20±1.37 at T1, 4.87±1.36 at T2) and TUG (4.52±4.30 at T1, 5.73±4.97 at T2) significantly improved (p<0.05) only in the intervention group. The changes in total POMA score and BBS of the intervention group (7.20±2.37, 7.47±3.07) improved more significantly (p<0.05) between T0 and T2 than the control group (2.53±2.10, 2.87±2.53).
Conclusion
Our study showed that AGT enhances dynamic balance and gait speed and effectively lowers fall risk in stroke patients. Compared to conventional gait therapy, AGT would improve gait function and balance in stroke patients more effectively.
INTRODUCTION
After the onset of stroke, patients occasionally experience diminished balance and asymmetrical weight support, which provokes secondary problems, such as the loss of functional gait, restriction of movement, and falls [1]. Among those problems, falls are a very common and serious problem affecting approximately 12%–47% of all hospitalized stroke patients [2,3]. Particularly, falls in stroke patients are significantly linked to disease-specific physical deficits, such as lower extremity weakness, loss of balance, and reduced gait speed, and cognitive impairment in stroke patients is known to be at an elevated risk for falls [4-8]. Falls trigger problems, such as fracture and depression in stroke patients, thereby hindering quick recovery, resulting in functional sequelae and delayed return to a normal life, which in turn prolongs hospital stay and increases medical cost [9,10]. Therefore, improving gait functions and reducing fall risk in stroke patients is important issue. Various treatment modalities are applied in rehabilitation therapy to improve patients’ dynamic balance and lower their fall risk; antigravity treadmill training has been actively researched as a method of gait training in recent years [11].
Antigravity treadmill was developed by the National Aeronautics and Space Administration (NASA) to train astronauts for postural and movement control in space [12]. Inside an antigravity treadmill machine, patients can walk with reduced weight load and intra-articular pressure in the lower limbs; therefore, it is an appropriate gait training approach for patients with muscle weakness [13]. Berthelsen et al. [14] reported that early gait training using antigravity treadmill improved postural stability and gait abilities in patients with muscular dystrophy. Baizabal-Carvallo et al. [12] reported that antigravity treadmill training improved gait freeze and mobility in patients with Parkinson’s disease. However, research on the effects of antigravity treadmill in stroke patients is rare. Therefore, this study aimed to investigate the effects of antigravity treadmill training (AGT) on gait function and fall risk in stroke patients.
MATERIALS AND METHODS
Subjects
This study was a single-blinded controlled trial conducted on 30 stroke patients hospitalized in the outpatient clinic of our hospital. The inclusion criteria were as follows: (1) patients aged ≥20 years, (2) at least 6 months since the diagnosis of stroke, (3) ability to walk for at least 10 min with or without assistance, (4) impaired balance (Berg Balance Scale [BBS] score ≤45), (5) had undergone the conventional therapy but not AGT, (6) medically stable and lack of major cardiovascular or other medical conditions. Patients with serious cognitive impairment (Mini-Mental State Examination score ≤20), those with a history of orthopedic surgery in the past 6 months, and those with a neurological diagnosis other than stroke were excluded. This study was approved by the Institutional Review Board of Gwangju Veteran Hospital (IRB No. 2021-9-2). Each participant signed the IRB approved informed consent form, and the participants’ rights were protected in accordance with the ethical principles of the Declaration of Helsinki.
Methods
A total of 30 patients were randomized to two groups, with 15 in the intervention group and 15 in the control group. The intervention group underwent AGT for 20 minutes a day, five times a week for 4 weeks. AGT was designed as a progressive resistance training focused on improving dynamic balance control and stability, where the initial overload was set to 30% of the body weight and then increased gradually. All patients started treatment at 30% load, and if they adapted to training for 5 minutes (confirming no adverse events such as discomfort or blood pressure increase), AGT was gradually increased to 80% of the patient’s body weight. If there was an adverse event, the training was terminated. The control group underwent rehabilitation therapy involving conventional gait training with a therapist with more than 5 years of clinical experience. The control group also underwent training 20 minutes a day, five times a week for 4 weeks.
Training device
The antigravity treadmill machine used in this study (Via model; AlterG Inc., Fremont, CA, USA) consists of a treadmill enclosed in a waist-high chamber, an air compressor that controls the internal pressure, and a monitoring screen (Fig. 1). This machine increases the chamber pressure to a level higher than the atmospheric pressure using an air compressor, and the pressure differential induces an axial buoyant force proportional to the cross-sectional area of the patient’s body multiplied by the pressure differential, similar to the “piston effect.” This reduces the weight loading on the patient inside the chamber and enables antigravity gait training [15] (Fig. 2).
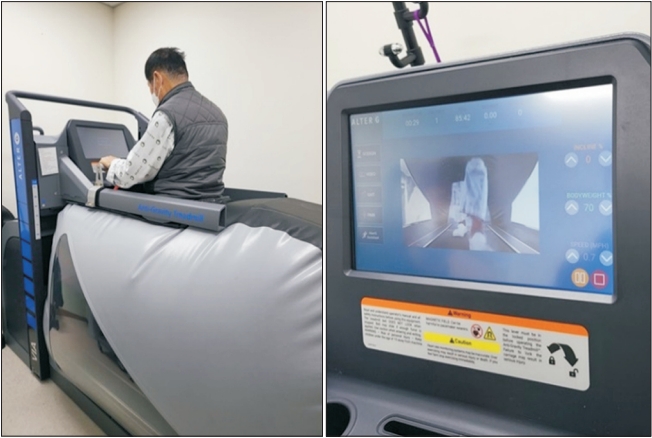
Antigravity treadmill device. The device (Via model; AlterG Inc., Fremont, CA, USA) consists of a treadmill enclosed by a waist-high chamber, an air compressor that controls the internal pressure, and a monitoring screen.
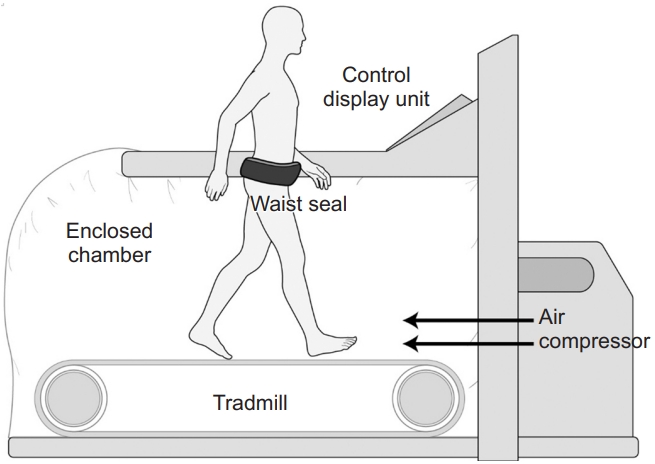
Structure of antigravity treadmill device. The air compressor increases the pressure inside the chamber above the atmospheric pressure, and the resulting pressure differential generates a buoyant force, thereby reducing the patient's weight load inside the chamber.
Evaluation
Fall risk was evaluated using the Tinetti Performance Oriented Mobility Assessment (POMA), and balance and gait function were assessed using BBS, Timed Up and Go test (TUG), and a 10-m walk test (10mWT). These four scales were assessed before the intervention (T0), and at 4 weeks (T1) and 12 weeks (T2) after the intervention by a therapist with more than 5 years of clinical experience who did not participate in rehabilitation therapy. The POMA used to assess fall risk comprises two sections, each assessing balance and gait, respectively. The balance section reflects balance while seated or standing, and the other section reflects dynamic balance during gait. The total possible score is 28, with 12 for POMA gait score and 16 for POMA balance score, and a lower total score indicates greater fall risk [16]. According to Lin et al. [17], the POMA score has superior test-retest reliability, discriminant validity, and predictive validity for assessing fall risk compared to other tests, such as the TUG test, one leg stand, and functional reach test. In addition, the cross-sectional and longitudinal construct validity and reliability to measure the balance ability of the POMA was demonstrated in persons early after stroke [18]. BBS was used to assess balance, which is associated with fall risk. BBS is a clinician-rated scale comprising four domains for static and dynamic balance and mobility, and the total possible score is 56. A score of ≤45 indicates the need for a cane or other walking aids, and a score of 41–44 indicates a low fall risk, a score of 21–40 indicates a high fall risk, and a score of 0–20 indicates a very high fall or injury risk. Maeda et al. [19] reported that fall risk in patients with acute stroke can be classified based on the BBS, and BBS has been widely recognized for its utility (cutoff ≤29; sensitivity 80%; specificity 78%). TUG and 10mWT are tests to reflect the gait speed and dynamic balance [6]. TUG measures the time from the rising of the patient from a chair upon the “start” cue and walking to the 3-m mark up to their return to the chair and sitting down. 10mWT measures the walking speed (m/s) by dividing 6 m by the time (seconds) taken to walk 6 m.
Statistical analysis
All statistical analyses were performed using the R software, version 4.0.1 (R Foundation for Statistical Computing, Vienna, Austria; http://www.R-project.org), and statistical significance was set at p<0.05. Normality was assessed using the Shapiro-Wilk test. Repeated measures analysis of variance (ANOVA) was used if normality was established, while the Wilcox test was used as a nonparametric alternative if normality was not established.
RESULTS
There were no statistically significant differences in general and medical characteristics between the intervention and control groups (Table 1). In the intervention group, temporary dizziness appeared in two patients, which disappeared shortly thereafter and did not interfere with further treatment, and no other adverse events were reported.

Characteristics of participants (clinical features)
Changes in fall risk
The intervention group showed a statistically significant improvement in the total POMA score across time points, with a score of 13.80±5.43, 19.87±5.83, and 21.00±5.95 at T0, T1, and T2, respectively (p<0.05) (Table 2). The POMA gait score also significantly improved, with 3.87±2.56, 8.07±2.81, and 8.73±2.99 at T0, T1, and T2, respectively (p<0.05). The POMA balance score also improved at T1 and T2 compared to T0, however the changes were not statistically significant (p>0.05).

Results in measurements of the participants in the intervention and control groups
The control group showed a statistically significant improvement in the total POMA score across time points, with a score of 14.33±4.08, 17.27±4.82, and 16.87±4.19 at T0, T1, and T2, respectively (p<0.05) (Table 2). Although the POMA gait score and the POMA balance score also improved at T1 and T2 compared to T0, the changes were not statistically significant (p>0.05).
The changes in the total POMA score, POMA gait score and POMA balance score were compared between the two groups at each time point (Table 3). Only the POMA gait score significantly differed (p<0.05) between the two groups in both ΔT1–T0 and ΔT2–T0. While the total POMA score significantly differed (p<0.05) between the two groups in ΔT2–T0, 10mWT results did not significantly differ between the two groups (Fig. 3).

Changes in measurements of the participants in the intervention and control groups
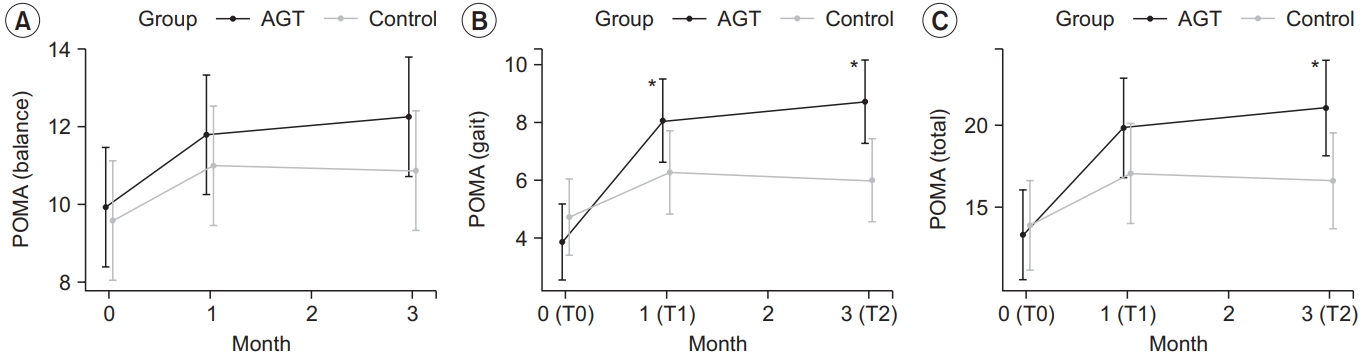
Changes in the outcome measures: (A) POMA (balance), (B) POMA (gait), and (C) POMA (total). POMA (gait) scores in the intervention group at T1 and T2 improved significantly compared to the control group. POMA (total) scores in the intervention group at T2 improved significantly compared to the control group. *p<0.05, between the intervention and control group by repeated measures ANOVA (contrast). AGT, antigravity treadmill gait training; POMA, Tinetti Performance Oriented Mobility Assessment; T0, before the intervention; T1, 4 weeks after training; T2, 12 weeks after training.
Improvement in gait function
The intervention group showed a statistically significant improvement in the BBS score, with a score of 36.13±7.82, 41.87±8.02, and 43.60±7.68 at T0, T1, and T2, respectively (p<0.05) (Table 2). TUG significantly improved, with 30.44±22.44, 25.93±19.63, and 24.71±18.82 at T0, T1, and T2, respectively (p<0.05). 10mWT results also improved significantly, with 0.40±0.14, 0.47±0.16, and 0.51±0.20 at T0, T1, and T2, respectively (p<0.05).
The control group showed a statistically significant improvement in the BBS score, with a score of 35.67±8.29, 38.93±8.71, and 38.53±8.41 at T0, T1, and T2, respectively (p<0.05) (Table 2). TUG increased at T1 and T2 compared to T0, but the changes were not statistically significant (p>0.05). Additionally, 10mWT results significantly improved, with 0.48±0.32, 0.52±0.36, and 0.52±0.38 at T0, T1, and T2, respectively (p<0.05) (Table 2).
The changes in BBS, TUG, and 10mWT were compared between the two groups at each time point (Table 3). Only TUG significantly differed (p<0.05) between the two groups in both ΔT1–T0 and ΔT2–T0. While the BBS significantly differed (p<0.05) between the two groups in ΔT2– T0, 10mWT results did not significantly differ between the two groups (Fig. 4).
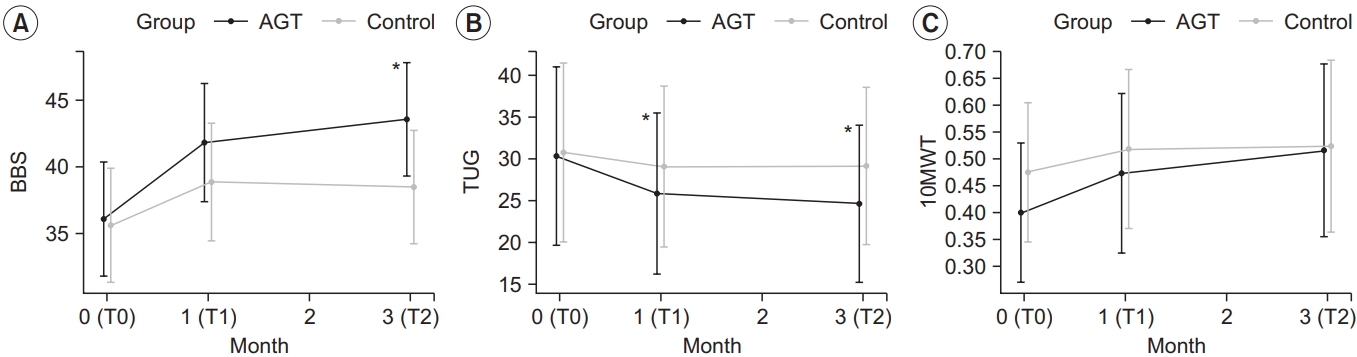
Changes in the outcome measures: (A) BBS, (B) TUG and (C) 10mWT. TUG in the intervention group at T1 and T2 improved significantly compared to the control group. BBS scores in intervention group at T2 improved significantly compared to the control group. *p<0.05, comparison between intervention group and control group by repeatedmeasures ANOVA (contrast). AGT, antigravity treadmill gait training; BBS, Berg Balance Scale; TUG, Timed Up and Go test; 10mWT, 10-m walk test; T0, before the intervention; T1, 4 weeks after training; T2, 12 weeks after training.
DISCUSSION
The results of this study showed that the total POMA score significantly improved at T1 and T2 compared to that at T0 (baseline) in both intervention and control groups. As mentioned in the inclusion criteria, the patients were able to walk for at least 10 minutes with or without assistance, and all showed muscle strength above fair on the Manual Muscle Test (MMT), and there was no change after treatment.
The intervention group showed significant changes in POMA gait score at T1 and T2 compared to baseline but not in POMA balance score. This may be attributable to the fact that AGT reduces body sway during walking because the joint pressure on the lower limbs while walking is reduced during AGT [13], which in turn enhances the lower limb stability on the loaded side and thus improves dynamic balance in the swing phase [11]. Thus, AGT was more effective on the POMA gait score (an assessment of balance during the forward progression of walking) rather than the POMA balance score (an assessment of sitting and static standing balance). Although the change in the POMA balance score is statistically significant, the change itself seems sufficient; therefore, the results can be mainly attributed to the small number of participants.
The control group also showed a significant improvement in the total POMA score after gait training, but the intervention group showed a greater change in 12 weeks after training. Thus, we suspect AGT is useful for stroke patients, who require more than two-fold greater energy and time to control their posture due to larger sway and poorer stability in an upright posture compared to normal individuals [20,21].
The AGT used in this study was probably more helpful in correcting the gait posture because it visualized the patient’s gait patterns on the monitoring screen during the training. Kurz et al. [22] reported that neuroplasticity was improved after AGT in children with cerebral palsy and that it helped enhance muscle tissue and gait speed. Furthermore, AGT improved dynamic balance and postural stability by reducing muscle spasticity and overexcitability in children with cerebral palsy [23,24]. Based on these results, it can be speculated that gait correction through AGT produced more effective outcomes than traditional gait training at the follow-up through feedback and enhanced neuroplasticity. In addition, in comparison with partial body weight-supported and robotic-assisted treadmill exercises, AGT reported more positive effects in cadence, stride length, and stride time parameters in children with spastic cerebral palsy [25].
The BBS score statistically significantly improved at T1 and T2 compared to that at baseline in both groups, but the improvement was more significant in the intervention group at T2. This also confirms that AGT produces more lasting effects than conventional gait training.
In this study, TUG and 10mWT were used to assess gait speed, a significant factor associated with fall risk, and 10mWT results significantly improved at T1 and T2 compared to that at baseline in both groups. There were no significant differences in the changes observed between the two groups. However, TUG significantly improved at T1 and T2 compared to that at baseline in the intervention group.
These results may be pertinent to the different methods used for the two tests. While a patient gets up from a chair and walks 3 m upon the “start” cue during a TUG test, a patient begins in an upright position and walks 10 m forward during a 10mWT. Hesse [26] mentioned that treadmill training with partial body support can enhance gait speed based on symmetrical body weight shift, which has been reflected in a test involving a change in posture and movement upon a start cue.
This study has some limitations. First, the study sample was relatively small, and a follow-up studies with larger samples would be required. Second, the study sample was predominantly male, and subsequent studies to examine the physical discrepancies between sexes would be helpful. Third, the control group was set to conventional gait training and not placebo or without intervention due to ethical considerations. Therefore, this study did not show a markedly greater change in AGT compared to the control group, and the effect appeared to be more significant 2 months after the end of treatment. Finally, the duration of treatment was relatively short (approximately 4 weeks), and a long-term follow-up was not performed. Future studies should examine the longterm effects of treatment by examining longer treatment durations.
In conclusion, this study showed that AGT enhances dynamic balance and gait speed and effectively lowers fall risk in stroke patients. Therefore, AGT can be a beneficial alternative therapy to conventional gait therapy for improving gait function and balance in stroke patients. However, in the future, studies should perform follow-up tests and observations and include more participants to better examine the long-term effects of the treatment.
Notes
No potential conflicts of interest relevant to this article were reported.
Conceptualization: Yoon SR, Ryu SR, Oh KR. Methodology: Yoon SR, Ryu SR, Cho TH. Formal analysis: Lim NN, Im NG, Lee Y. Funding acquisition: Yoon SR, Oh KR. Project administration: Yoon SR, Ryu SR, Oh KR, Cho TH. Visualization: Yoon SR, Ryu SR, Oh KR, Lim NN. Writingoriginal draft: Yoon SR, Ryu SR, Oh KR. Writing-review and editing: Yoon SR, Oh KR. Approval of final manuscript: all authors.