


INTRODUCTION
Diet and exercise are essential for maintaining health in an aging society. The loss of muscle strength and mass in the elderly, known as sarcopenia, is considered an independent risk factor for falls, fragility, disability, and lower quality of life. Handgrip strength (HGS) has been used as an important index of muscle strength to diagnose sarcopenia because low HGS is a clinical marker of poor mobility and low muscle mass. Because it has low cost and is easy to measure and perform at bedside, HGS also has been used widely in previous studies focused on its association with the risk of cardiovascular disease, cancer, and cognitive impairment, as well as sarcopenia.
Several studies have been conducted to identify other factors that contribute to muscle strength. Nutrition is one of the major factors that can be modified. Several studies have reported that nutritional supplementation with proteins, amino acids, vitamin D, calcium, and other antioxidants can improve muscle strength. For example, vitamin D is well known for its antioxidant activity against free radical damage and plays a major role in protein synthesis through vitamin D receptors (VDR) in muscle, which improves muscle strength and physical function [1,2]. Various cross-sectional studies have reported a positive relationship between vitamin D levels and muscle strength. Thus, vitamin D deficiency may be a risk factor for sarcopenia in elderly people [1,2]. Recently, some preclinical and human experimental studies have shown that vitamin E, as an antioxidant, promotes myoblast proliferation and increases muscle mass [3]. A previous study also found that higher tocopherol levels were associated with greater muscle strength measures, such as handgrip and knee strength in elderly women and a lower tendency of fragility in elderly women and men [4].
Recently, vitamin E has attracted public attention as a key nutrient in the defensive role of antiaging [5,6]. Vitamin E, which consists of two subgroups (tocopherol and tocotrienol), has antioxidant and anti-inflammatory properties that result in antiaging effects [3,7]. It is a lipid-soluble vitamin that plays the role of an antioxidant agent that scavenges reactive oxygen species in the skeletal muscle and is vulnerable to oxidative damage because of its high oxygen consumption [5,7]. Vitamin E can reduce muscle damage, enhance recovery from exercise, and prevent muscle atrophy [8]. Therefore, there has been growing interest in the effect of vitamin E on enhancing muscle strength and exercise performance because vitamin E plays a major role in reducing muscle fatigue. Several in vivo and in vitro studies have demonstrated that supplementation with vitamin E could be beneficial for decreasing oxidation [9], suppressing oxidative stress, increasing protein synthesis [10], and reducing lipid peroxidase [6] as an oxidative stress biomarker against free radical assault during exercise [3].
Although there is much evidence suggesting an association between vitamin D and muscle strength, few studies have investigated the association between vitamin E and muscle strength. Therefore, this study was performed to evaluate the association between vitamin E and HGS after adjusting for multiple confounding factors. We used cross-sectional data from the population-based Korea National Health and Nutrition Examination Survey (KNHANES) in Korean adults aged Ōēź19 years.
MATERIALS AND METHODS
Participants
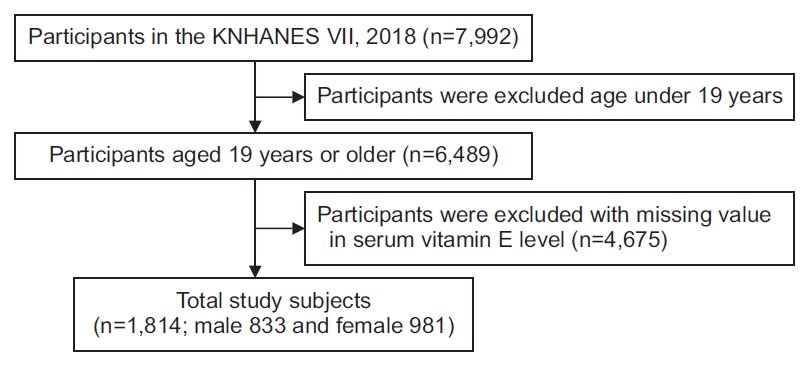
This study was based on data from the Korean subjects of the 7th Korea National Health and Nutrition Examination Survey (KNHANES VII) in 2018. The total number of participants in KNHANES VII was 7,992. This study included patients aged Ōēź19 years (n=6,489). We excluded participants with missing values for serum vitamin E levels (n=4,675). The total number of study subjects was 1,814 (833 men and 981 women) (Fig. 1). The subjects were divided into three groups: young age group (19ŌĆō40 years), middle age group (41ŌĆō64 years), and elderly age group (65ŌĆō80 years). All participants provided written informed consent.
Handgrip strength
In KNHANES VII, the HGS test was used to determine the distribution of muscle strength. HGS was measured using a digital handgrip dynamometer (digital grip strength dynamometer, TKK 5401; Takei, Niigata, Japan). The participants were asked which hand was the dominant hand. This test was repeated three times with both dominant and non-dominant hands alternately, and we selected the maximal HGS among the data.
Vitamin E
Vitamin E was included in the survey from KNHANES VII (2016ŌĆō2018). Vitamin E (mg/L) was detected from the sample by Agilent 1200 (Agilent Technologies Inc., Santa Clara, CA, USA) tools and Chromsystems (Gr├żfelfing, Germany) reagent through high-performance liquid chromatography with flame ionization detector methods.
Assessment of covariates
Every subject aged Ōēź19 years was asked to complete a health questionnaire to obtain information about age, sex, household income, alcohol consumption, smoking status, daily nutrition intake, aerobic physical activity level, and so on. According to drinking experience in the patientŌĆÖs lifetime and drinking frequency for the past year, participants were divided into three groups: non-drinkers who had never consumed alcohol, ex-drinkers who had not consumed alcohol in the past, and current drinkers. Smoking status was classified into three groups based on current smoking status (non-smoker, ex-smoker, and current smoker). Daily energy and nutritional intake were investigated using food frequency questionnaires (FFQs). Aerobic physical activity was defined as ŌĆ£yesŌĆØ for those who had performed medium-intensity exercise for at least 2 hours and 30 minutes per week or high-intensity exercise for least 1 hour and 15 minutes or a combination of medium- and high-intensity exercise (1 minute of high intensity=2 minutes of medium intensity). Body mass index (BMI, kg/m2) was calculated by measuring body weight and height according to standardized procedures for all participants.
Statistical analyses
This study used raw data from KNHANES VII conducted in 2018. We used the integrated weights suggested in the guidelines for analyzing the raw data from the National Health and Nutrition Survey and analyzed it by considering the effect of the complex sample design.
Differences in general characteristics according to age and sex were compared using Student t-test or the chi-square test, as appropriate for the entire sample and age groups (young age, 19ŌĆō39 years; middle age, 40ŌĆō64 years; elderly age, 65ŌĆō80 years). Student t-test was performed to determine the mean┬▒standard error for continuous variables such as age, nutrition intake, HGS, and so on. The chi-square test was performed to determine n (%) for categorical variables such as household income, alcohol consumption, smoking status, presence or absence of depression, aerobic physical activity level, and so on. Multiple linear regression analysis was performed to examine whether there was an independent relationship between HGS and vitamin E in the entire sample and age groups based on sex. We used confounding factors with proven associations with sarcopenia in a previous study. Models 1 (without adjusting for confounding factors), model 2 (adjusted for age and BMI), and model 3 (adjusted for age, BMI, household income, alcohol consumption, smoking status, aerobic physical activity level, daily energy, and nutrition intake [carbohydrate, fat, and protein]) were applied.
All statistical analyses were performed using SPSS version 26.0 (IBM SPSS, Armonk, NY, USA) and statistical significance was set at Ōēż0.05.
RESULTS
The total number of subjects was 1,814: 883 (45.92%) men and 981 (54.08%) women. All subjects were divided into three groups according to age (young age group [19ŌĆō39 years], n=636; middle age group [40ŌĆō64 years], n=872; elderly age group [65ŌĆō80 years], n=306). Demographic characteristics by sex and age group are shown in Table 1. There were significant differences in most of the parameters among the groups, except household income by gender, carbohydrate intake by age, and vitamin E by age and sex. Men had greater HGS than women; the mean HGS of men was 39.17 kg, and that of women was 22.86 kg. The young age group tended to have greater HGS: young age group, 33.06 kg; middle age group, 31.40 kg; and elderly age group, 25.24 kg. The mean serum vitamin E levels were 12.56 and 13.28 mg/L in men and women, respectively. The young age group showed a lower vitamin E level of 11.38 mg/L. The middle and elderly age groups had similar values: 13.80 and 13.86 mg/L, respectively.
We analyzed the relationship between vitamin E and HGS using multiple linear regression according to age and sex. There were three models. Model 1 showed a relationship without correction for any other confounding factors. Model 2 was a minimally adjusted model based on age and BMI. Model 3 was adjusted for age, BMI, household income, alcohol consumption, smoking status, aerobic physical activity level, daily energy, and nutrition intake (carbohydrate, fat, and protein).
Table 2 shows the association between vitamin E and HGS based on age and sex. In all subjects combined men and women, there was no significant association between vitamin E and HGS in all of the models, except model 2 in the elderly age group (p=0.009). In the male group, regardless of confounding factors, the serum vitamin E level had a positive relationship with HGS in all age groups (p=0.028 in model 1; p<0.001 in models 2 and 3) and the young age group (p=0.004, 0.045, and 0.019 in models 1, 2, and 3, respectively). However, in the middle age group, only model 1 showed statistically significant results (p=0.046). Even in the elderly age group, there were no significant results in any of the three models. In the female group, there were no significant results except for model 1 in the young age group (p=0.021).
DISCUSSION
In this study, we analyzed the correlation between vitamin E and HGS in Korean adults aged Ōēź19 years. Only men showed higher levels of HGS with higher vitamin E levels, especially in the young age group. However, there were no significant results in women and all subjects combined (men and women). In particular, in the elderly group, there was no significant correlation even in men.
There have been several studies on the association between vitamin E and muscle strength. Most previous studies were cross-sectional studies conducted in the elderly. A previous study demonstrated positive relationships between ╬▒-tocopherol and muscle strength, including handgrip, hip flexion, and knee extension power, in 669 older women living in the community aged Ōēź70 years [4]. Vitamin E was divided into quartiles, and handgrip, hip, and knee strength were divided into tertiles, without widely accepted cutoff points to define low vitamin E level or muscle weakness in older women. Another study suggested that in both elderly men and women aged Ōēź65 years, highly frail participants represented by self-reported weight loss, low energy, slow gait speed, low physical activity, and low HGS showed low levels of age-and gender-adjusted vitamin E levels [11]. However, the two studies mentioned earlier were unable to explain the continuous correlation between vitamin E and muscle strength because they analyzed categorized consecutive variables without a definite cutoff value. There was also an intervention study that supplemented vitamin E, but this was not a cross-sectional study. Bo et al. [12] analyzed 60 subjects with sarcopenia aged 60ŌĆō85 years who underwent a double-blind, randomized, placebo-controlled trial. They showed that nutritional supplementation consisting of high whey protein and vitamins D and E improves the relative skeletal mass index measured by bioimpedance analysis, HGS, and physical function including gait speed after a 6-month intervention compared with the placebo group. However, they conducted interventions using not only single nutrition but also multiple nutrition, so there was a limitation in analyzing the effect of vitamin E alone on muscle strength.
The human body is composed of two types of muscle fibers according to the contraction speed, and muscle fibers have different metabolic oxidation [13], which may play different roles along with vitamin E [8]. Type I muscle fiber is a slow-twitching red muscle and has a large amount of myoglobin and capillary contents, which contribute greatly to oxidative capacity [13]. Thus, type I muscle fibers tend to use more vitamin E than type II muscle fibers [8]. However, a previous study showed that although type I fibers largely depend on oxidative metabolism, type II fibers generate more free radicals [3,14]. Several studies strongly suggest that the antioxidant and anti-inflammatory properties of vitamin E may reduce damage to type II fibers and relieve type I contractile dysfunction [3,6]. Therefore, the distribution of muscle fibers may be important in determining the effect of vitamin E on muscle.
The distribution of muscle fibers may change depending on sex or age. According to previous studies, aging induces loss of muscle fiber number as well as muscle atrophy, which are the principal causes of sarcopenia [3,14,15]. The effects of aging on muscle fiber loss contributed equally regardless of muscle fiber type [16], but several studies have demonstrated that type II muscle fibers are more affected than type I muscle fibers in the case of muscle atrophy [3,14,15]. Therefore, the distribution of type I muscle fibers was higher than that of type II fibers in the elderly. Some studies have analyzed the distribution and contractile properties, such as cross-sectional area (CSA), maximal isometric force, shortening velocity, and specific force of muscle fibers according to sex [17,18]. Most studies have shown that type II fibers are larger in men, while type I fibers tend to be larger in women [17,19]. CSA was smaller in women than in men; especially, the loss of type II area was more dominant in women [17,20], which means that the proportion of type I fibers might be larger in women than in men. Among the contractile properties, type II fiber had a higher value than type I in both men and women, but there was no evidence of gender-related differences [17].
Since the effect of vitamin E on muscle is based on a defensive mechanism against metabolic catabolism after exercise [3], the intensity and duration of aerobic physical activity might be important for the role of vitamin E. Our results showed that men and the young age group performed aerobic exercise more than women and the older age groups, respectively (Table 1). It seems that the skeletal muscle may be more sensitive to changes in vitamin E levels in younger men with relatively more aerobic exercise.
Our results showed a significant correlation in men, especially at a young age. However, there were no significant results in the elderly, who were expected to be more affected, nor in women.
Previous studies have shown that poor vitamin E status increases the risk of cardiovascular disease, diabetes mellitus, and cancer. HGS was also affected by such diseases, and sarcopenia comorbidity could negatively affect HGS. We did not adjust for such comorbidities, so this might be one of the reasons for the unexpected results. Other dietary antioxidants, such as vitamins C and D and calcium, were not included in the present study and should be addressed in future investigations.
The KNHANES did not include dietary intake data of vitamin E, which is one of the potential limitations of the present study. However, assessing dietary vitamin E intake using FFQs is difficult [21] because the source of oil used in food is often not listed, which means vitamin E status from dietary surveys has measurement error. Furthermore, a previous study using the third National Health and Nutrition Examination Survey of the United States showed that the 24-hour dietary recall was not well correlated with serum concentrations [22]. Since this study was a cross-sectional study without a control group, the expected quantitative relationship might not be obtained. Thus, a randomized controlled study is needed to investigate whether vitamin E supplementation could improve contractile properties in the elderly, especially in patients with sarcopenia.
HGS may not be sufficient to represent total muscle strength; therefore, other body composition should be considered. In addition, considering defensive mechanism against free radial after exercise, it is necessary to analyze relationship between vitamin E and another objective measures, such as biomarkers that indicate oxidative stress and skeletal muscle protein turnover or exercise-induced muscle fatigue.
In conclusion, to the best of our knowledge, this is the first study to suggest a continuous correlation between serum vitamin E levels and HGS in Korean adults, from the young and middle ages to the elderly, that is related to sarcopenia using KNHANES VII in 2018 in Korea. There was no statistically significant correlation between vitamin E and HGS, except for young men with higher serum vitamin E levels showing higher HGS. In particular, contrary to our expectations, the correlation was not significant in the elderly.
We suggest that vitamin E is correlated with HGS as an indicator of sarcopenia; however, further investigations should be considered. We recommend the need for further research to analyze the relationship between vitamin E intake and objective measures such as contractile properties and physical performance. In addition, it is necessary to investigate the role of vitamin E depending on muscle type by age and sex.