Relationships Between Relative Ankle Muscle Ratios, Severity of Symptoms, and Radiologic Parameters in Adolescent Patients With Symptomatic Flexible Flat Feet
Article information

Abstract
Objective
To investigate differences in the relative sizes of the ankle-stabilizing muscles in individuals with versus without flexible flat feet and to determine predictors of symptom severity.
Methods
This cross-sectional study included 30 patients with symptomatic flexible flat feet and 24 normal controls. The following were evaluated: foot posture index, resting calcaneal stance position angle, radiographic findings (calcaneal pitch, Meary’s angle, talocalcaneal angle, talonavicular coverage angle [TNCA]), foot function index (FFI), and cross-sectional areas (CSA) of the tibialis anterior (TA), tibialis posterior (TP), and peroneus longus (PL) upon ultrasonographic examination. To address morphometric differences among participants, individual muscle measurements were normalized to proportions of total muscle CSA. Between-group differences were evaluated with independent t-tests. Correlations between muscle ratios, radiographic parameters, and FFI scores were investigated. Logistic regression analysis was performed to determine which parameters predicted severe symptoms.
Results
The relative size of the TP was significantly greater and those of the TA and PL were significantly smaller in patients with flat feet than in normal controls. Correlations were found among relative muscle CSA ratios, radiographic parameters, and FFI score. Linear regression analysis confirmed that the TNCA and the relative CSA of the PL were independent predictors of symptom severity.
Conclusion
This study found significant differences in the relative CSAs of the ankle muscles in patients with flexible flat feet versus individuals without flat feet; these differences were significantly correlated with anatomic abnormalities. Symptoms were more severe in patients with relatively greater forefoot abduction and relatively smaller PL.
INTRODUCTION
The condition of flexible flat feet can develop in early childhood and usually improves, but may persist in adulthood. The term “flexible” means that the foot is flat in weight-bearing, while the foot arch returns to normal when weight is removed [1]. Flat feet, pes planus, are known to cause pain and fatigue; however, some individuals with flexible flat feet do not experience symptoms, and the condition may improve as they enter adulthood [2-4]. The causes of symptoms in individuals with flexible flat feet are not clearly understood and remain controversial; however, it is known that kinematics of the foot change during walking and depend on foot posture [5]. In addition, using surface electromyography (EMG), ankle muscle activity has been shown to differ between normal individuals and those with pes planus because of adaptation to the changed kinematics; patients with flat feet have higher tibialis posterior (TP) activity and lower peroneus longus (PL) activity at midstance and propulsion and have higher tibialis anterior (TA) activity during the contact period [6,7]. This difference in muscle contraction causes a difference in muscle volume, and two studies [8,9] have used ultrasonography to investigate differences in the ankle muscles of normal individuals versus those of patients with flat feet. In [8], the authors measured muscle and tendon thicknesses and found that the TA tendon and PL muscle were thicker and the Achilles tendon was thinner in individuals with flat feet than those in normal individuals. Similarly, the authors in [9] reported that the cross-sectional areas (CSA) of the peroneal muscles were larger in individuals with flat feet than those in individuals without flat feet.
Ankle muscle imbalances caused by differences in foot posture may be the cause of pain and dysfunction in patients with flat feet. Imbalanced invertor and evertor forces cause ankle instability and ankle injury [10]. However, to our knowledge there have been no studies on the relationship between ankle muscles and pain in patients with flat feet.
Therefore, the purpose of this study was to use ultrasonography to confirm differences between the relative sizes of ankle-stabilizing muscles in normal individuals and those in individuals with flat feet and to investigate correlations between symptom severity and physiological parameters (the relative ratios of muscle CSA and radiographic parameters in patients with flexible flat foot).
MATERIALS AND METHODS
Study design
This cross-sectional study included a total of 54 participants between 10 and 20 years of age. Thirty participants, the patient group, were diagnosed with symptomatic flexible flat feet at the outpatient department of rehabilitation medicine at Chungnam National University Hospital. The diagnostic criteria were as follows: (1) clinically consistent with the definition of flexible flat foot; (2) foot posture index (FPI) >5; (3) resting calcaneal stance position angle (RCSPA) <-4° or >4°) the presence of foot pain (numeric rating scale ≥2) caused by flat feet.
The control group included 24 volunteers. The inclusion criteria were as follows: (1) absence of foot pain and dysfunction; (2) FPI ≥0 and ≤5; and (3) RCSPA ≥-4° and ≤4°. For both groups, individuals with neurological or orthopedic diseases that could cause gait disorder were excluded. Each participant provided informed consent prior to the study. This study was approved by the Institutional Review Board of Chungnam National University Hospital (No. 2020-02-047).
Foot posture assessment
FPI
Participants were asked to stand still with an equal weight load on both sides, and the following six items were evaluated: (1) presence of the talar head upon palpation, (2) curvature above and below lateral malleoli, (3) inversion/eversion of the calcaneus, (4) concavity or bulge in the region of the talonavicular joint, and (5) congruence of the medial longitudinal arch. The six individual scores were then combined to give a composite score between -12 and +12. A total score of 0 to 5 indicated a normal foot; scores exceeding 5 indicated a flat foot.
RCSPA
Patients stood relaxed with feet at the same angle made during the contact phase of gait. The RCSPA, the angle between the calcaneal bisection and a vertical line, was determined between the line of the heel and the surface. If the measured RCSPA value was negative, it indicated the rear foot was valgus. A flatfoot was defined as an RCSPA <-4°.
Radiographic assessment
Standing anterior-posterior view and lateral X-rays were taken to evaluate anatomical abnormalities in patients with flat feet. The normal group did not undergo xrays to avoid costs and potential radiation hazards. The following characteristics and the degree of flat foot were measured on plain films [11,12] (Fig. 1).
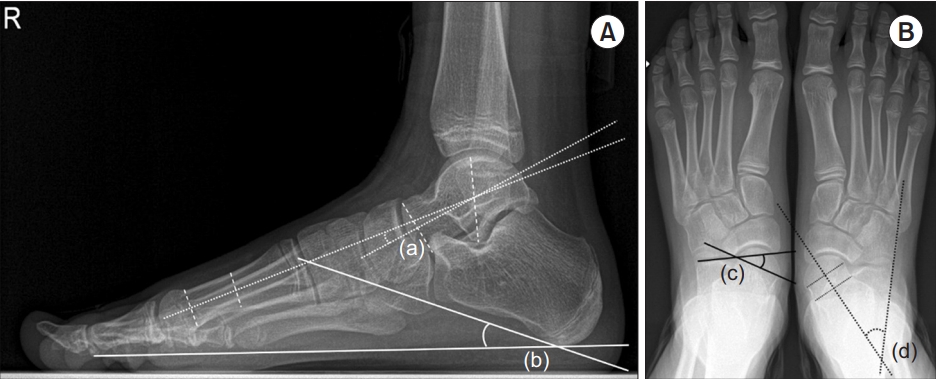
(A, B) Radiographic parameters: (a) Meary’s angle, (b) calcaneal pitch, (c) talonavicular coverage angle, and (d) talocalcaneal angle.
Calcaneal pitch
This was the angle between the calcaneus and the inferior aspect of the foot on the lateral projection X-ray.
Meary’s angle
This was measured as the angle between the line originating from the center of the body of the talus, bisecting the talar neck and head, and the line through the longitudinal axis of first metatarsal. Positive angles indicated the apex of the angle was directed dorsally, while negative values indicated that the apex was directed plantarly.
Talocalcaneal angle (TCA)
This was the angle between lines drawn along the axes of the talus and calcaneus on the anterior-posterior projection.
Talonavicular coverage angle (TNCA)
This was the angle between the articular surface of the talus and the articular surface of the navicular bone on the anterior-posterior projection.
All measurements were performed three times and the median value was used for analysis. An electronic protractor was used to measure angles.
Sonographic assessment
The CSAs of the ankle invertor and evertors were measured with ultrasound. Three trained physiatrists with >4 years of experience performed examinations with an ACUSON S2000 ultrasound unit (Siemens, Mountain View, CA, USA) linear probe with a 9–14 MHz bandwidth. The CSA of each muscle was measured at the muscle midpoint. The locations were based on those of a previous study and were as follows [8]: TA, one-third of the distance from the tibial tuberosity to the medial malleolus; TP, midway between the medial malleolus and the tibial tuberosity; and PL, one-third of the distance from the tibial tuberosity to the lateral malleolus (Fig. 2).
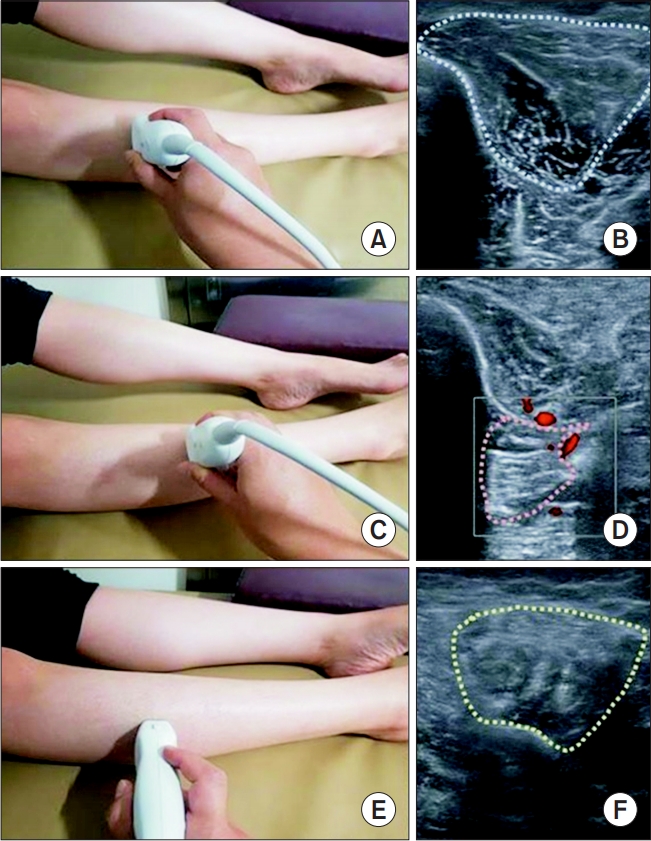
Scanned structures, probe position, and corresponding sample images. (A) TA probe position. (B) CSA of TA. (C) TP probe position. (D) CSA of TP. (E) PL probe position. (F) CSA of PL. TA, tibialis anterior; TP, tibialis posterior; PL, peroneus longus; CSA, cross-sectional area.
To prevent muscle deformation resulting from pressure, a large amount of gel was applied to the probe and muscles were measured with as little force as possible. The area was determined by using a measuring tool set on the ultrasonic device, and the median value of three repeated measurements was taken for each muscle.
Pain and functional assessment
FFI
The foot function index (FFI) was used to evaluate foot pain and disability in the patient group. This self-administered index is designed to evaluate loss of function resulting from foot disease and includes a total of 23 items in the three sub-scales of pain, disability, and activity limitation. Each item is rated on a 10-point scale and is recorded as a percentage of the total score; a higher score indicates more severe functional limitation [13]. A Korean version of the FFI, used in a previous study [14], was also used in this study.
Statistical analysis
To confirm the relationships among TA, TP, and PL muscles and to exclude variables such as height, weight, age, and sex, the CSA of each muscle was evaluated as a proportion of the total muscle CSA.
The TA ratio was defined as the CSA of the TA as a proportion of total muscle CSA, the TP ratio was defined as the CSA of the TP as a proportion of the total muscle CSA, and the PL ratio was defined as the CSA of the PL as a proportion of the total muscle CSA.
Data collected for each foot were considered separately, so data were obtained for 60 feet in the patient group and for 48 feet in the control group. The independent t-test was used to analyze differences in the CSA ratios of the ankle muscles between the control and patient groups.
To confirm the effect of foot anatomical structure on ankle muscle composition in the patient group, correlations between radiographic parameters and the CSA ratios were analyzed. To confirm the effect of differences in foot structure and ankle muscle ratios on symptoms, correlations between FFI and CSA ratios and radiographic parameters were analyzed using Pearson correlation analysis.
Finally, linear regression analysis was performed on parameters that were significant in correlation analysis to confirm which parameters caused symptoms. All statistical analyses were performed with IBM SPSS software version 25.0 (IBM Corporation, Armonk, NY, USA). Statistical significance was set at p<0.05.
RESULTS
Table 1 shows participants’ demographic and anthropometric characteristics and radiographic and ultrasonographic measurements. There were no significant differences between groups in demographic characteristics. The relative proportions of the TA (p=0.04) and PL (p<0.001) were significantly lower and the proportion of the TP (p<0.001) was significantly higher in the patient group than those in the normal group (Table 2).
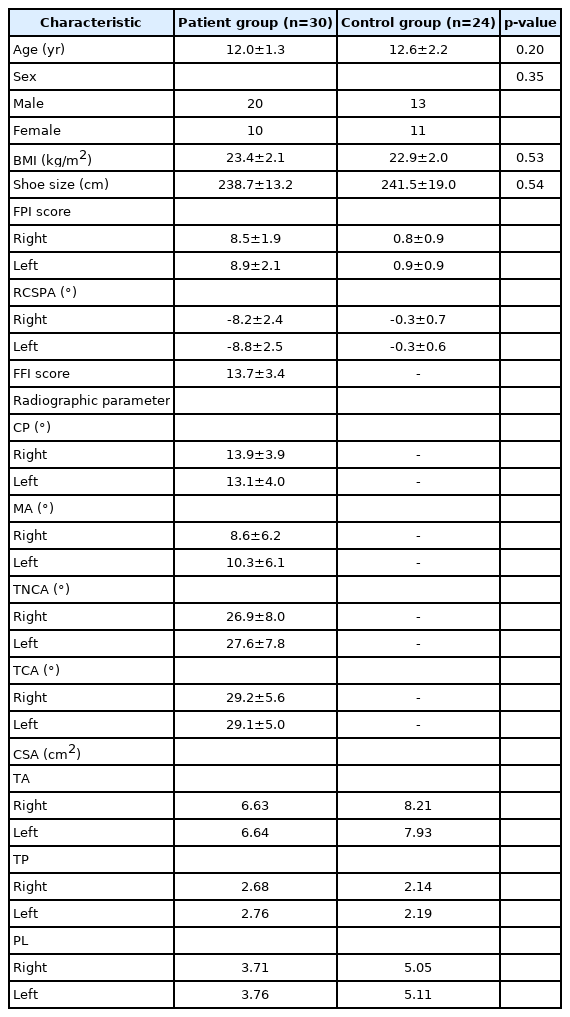
Participants’ anthropometric characteristics, radiographic measurements, and ultrasonographic measurements
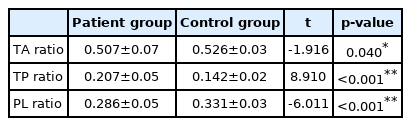
Comparison of ratios of CSA of each ankle muscle to total muscle CSA between control and patient groups
Table 3 shows correlations between the anatomical foot posture with radiographic parameters and the relative proportions of the ankle muscles. TA ratio had a strong negative correlation with calcaneal pitch (r=-0.542), whereas PL ratio had a strong positive correlation with calcaneal pitch (r=0.571), a strong negative correlation with Meary’s angle (r=-0.457), and a positive correlation with TCA (r=0.282).
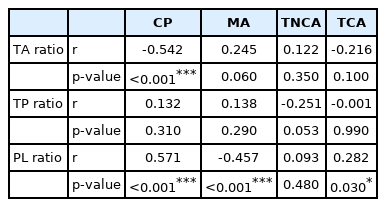
Correlations between relative CSA of ankle muscles and radiographic parameters in patients with flat feet (n=60)
Correlations between the severity of symptoms and parameters were analyzed, and the results are shown in Table 4. FFI value positively correlated with TA ratio (r=0.330) and negatively correlated with PL ratio (r= -0.369). FFI value had a strong positive correlation with TNCA (r=0.508), a negative correlation with calcaneal pitch (r=-0.323), and a positive correlation with Meary’s angle (r=0.394).
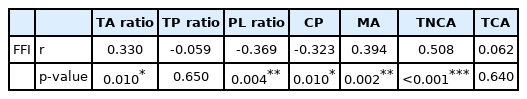
Correlations between severity of symptoms and relative CSA of ankle muscles and radiographic parameters in patients with flat feet (n=60)
To identify a model for predicting the severity of symptoms, linear regression analysis was performed on measurements that correlated with FFI. This analysis confirmed that TNCA best predicted the severity of symptoms (p<0.001). The next most effective predictor of the severity of symptoms was PL ratio (p=0.02) (Table 5).
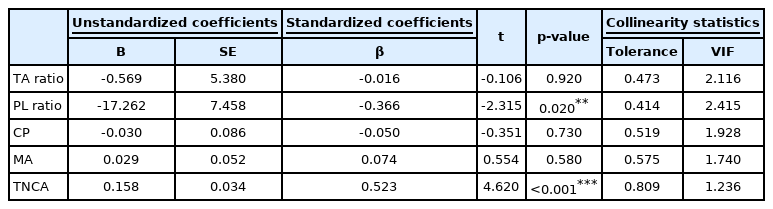
Linear regression analysis of parameters predicting severity of symptoms
DISCUSSION
We found a significant difference between ankle invertor and evertor CSA ratios for normal individuals and for those with flat feet. In addition, as calcaneal pitch decreased, TA ratio increased and PL ratio decreased; PL ratio increased as the Meary’s angle increased. Another important finding was the link between the severity of symptoms and foot posture; the degree of forefoot abduction was strongly correlated with symptoms, and a low PL ratio was an independent predictor of severe symptoms.
In this study, TA ratio and TP ratio were larger and PL ratio was smaller for the patient group than those for the normal group. These results differ from those of [8], in which ultrasound was used to examine the thickness of the TA, TP, PL, and Achilles tendon; in patients with flat feet, the TA and PL were thicker than those in normal individuals. A possible explanation for this difference in results is that there were methodological differences between the studies. In the previous study [8], the thickness of the tendon and muscle was analyzed, whereas in our study, the CSA of the muscle was used. Muscle thickness may change depending on the probe pressure applied during measurement [15]. In addition, we normalized the CSA ratios of the ankle muscles to exclude anthropometric effects, whereas the previous study simply compared muscle thickness. The findings of EMG studies of patients with flat feet are consistent with our results [6,7]. It has also been demonstrated that the area of the PL is smaller among patients with flat feet than among normal participants, although only the PL was evaluated [9].
Weakness of the TP muscle and injury of the tendon are known to cause rigid-type flat foot in adults [16,17]. However, in our study, CSA of the TP in patients with flat feet was larger than that in normal participants. We suspect that this difference can be attributed to differences in the etiology of rigid flat foot versus flexible flat foot. Rigid flat foot is pronation of the foot as a result of a weakened TP [18], whereas flexible flat foot is caused by the high flexibility of tendons and ligaments involved in maintaining the medial longitudinal arch [2]. In people with excessively flexible feet, the ankle invertor muscles are used to maintain foot and leg alignment against the tendency of the feet to evert with weight and from ground reaction forces in the stance phase of walking. The muscles work in the direction of inversion of the foot. It is possible that this repetitive action has the effect of resistance exercise, causing hypertrophy of the ankle invertors, such as the TA and TP. A previous study with findings that support our hypothesis included surface EMG analysis of foot muscle activity during gait in patients with flat feet; EMG activity of the TP and TA was greater and EMG activity of the PL was lower in the stance phase in flat-footed individuals compared with that in normal individuals [7].
In the correlation analysis between the relative ratios of the ankle muscles and radiographic parameters, we found that TA ratio decreased as calcaneal pitch increased, whereas PL ratio increased as calcaneal pitch increased and the Meary’s angle decreased. To our knowledge, no studies have compared radiographic parameters and relative ratios of the ankle muscles. However, a lower calcaneal pitch and a higher Meary’s angle can be assumed to indicate more severe flat foot. We infer from the hypothesis above that the relative size of the TA increases because the ankle invertor has a greater load caused by resisting pronation of the foot.
Flexible flat feet are not painful in most children, and the differences between symptomatic and asymptomatic patients remain unclear [19]. In the correlation analysis of the severity of symptoms, radiographic parameters, and relative ratios of ankle muscles, we found significant correlations between the severity of symptoms and TNCA, calcaneal pitch, Meary’s angle, TA ratio, and PL ratio. In particular, a strong correlation with TNCA, which indicates forefoot abduction, was confirmed. Linear regression analysis was performed with five measurements; our results showed that TNCA and PL ratio were the most effective in predicting the severity of symptoms. This result is consistent with the findings of a study in which kinematic data during walking for patients with flat feet were grouped according to the presence of symptoms; patients in the symptomatic group had more severe forefoot abduction in the stance phase than patients without symptoms [20]. In general, nonsurgical treatment for symptomatic flexible flat feet involves foot orthotics [21] and exercise therapy, such as short-foot exercises [22]. The results of the present study suggest that orthotics to limit forefoot abduction or exercise therapy to strengthen the PL may improve symptoms in patients with flexible flat feet.
There are some limitations to our study. First, the number of participants in the control group was relatively small, and the mean age was higher than that of the patient group. It is possible that differences in the relative ratios of the ankle muscles between the groups resulted from age and foot growth.
Second, there may be an error in confirming the CSA of the TP by ultrasound. We used an anteroposterior approach to confirm the CSA of the TP by ultrasound, because when approaching from the posterior, the distance between the probe and the target muscle is farther because of the thick gastrocnemius in between, and resolution is degraded. However, in the case of the anterior approach, there was a limitation in that part of the TP was covered by the tibia, so it was difficult to measure the exact area.
Third, since it is difficult to determine when the condition developed, onset data could not be collected. Because of its nature, there would be ambiguity concerning whether reported onset was when the patient first complained of symptoms or when the foot abnormality was discovered.
Fourth, most of the patients who participated in this study had symptoms of pain and slight restriction only when walking long distances. Therefore, it is possible that the FFI was not sufficiently sensitive in evaluating the degree of pain and functional impairment caused by flexible flat feet in this group.
Fifth, this study used ultrasound, radiographs, and patient’s medical records. The use of kinematic tools such as gait analysis would allow better comparison of the biomechanics of people with and without flexible flat feet. Because of ultrasound probe, data could not be collected for the medial gastrocnemius or soleus muscle; these muscles may contribute significantly to ankle stabilization.
Future studies using magnetic resonance imaging or computed tomography with 3D reconstruction will allow all leg muscles to be evaluated in patients with flat feet and will provide insight into the dynamic relationships between muscles.
In conclusion, patients with flexible flat feet had a higher proportion of ankle invertors and a lower proportion of ankle evertors than those in individuals without flat feet. These differences significantly correlated with severity (flat foot parameters and symptoms). The finding of differences in the development of ankle muscles with differences in foot posture has diagnostic value in the treatment and evaluation of patients with symptomatic flexible flatfeet. In future studies, it will be interesting to compare the relative ankle muscle ratios before and after treatment in patients who were prescribed exercise or foot orthotics.
Notes
No potential conflict of interest relevant to this article was reported.
Conceptualization: Shin YJ, Bok SK. Methodology: Shin YJ, Bok SK. Formal analysis: Ahn SY. Funding acquisition: Bok SK. Project administration: Bok SK. Visualization: Ahn SY. Writing—original draft: Shin YJ. Writing—review and editing: Bok SK. Approval of final manuscript: all authors.