Changes of Functional Outcomes According to the Degree of Completeness of Spinal Cord Injury
Article information
Abstract
Objective
To evaluate whether an initial complete impairment of spinal cord injury (SCI) contributes to the functional outcome prediction, we analyzed the relationship between the degree of complete impairment according to the American Spinal Injury Association impairment scale (AIS), the posterior tibial nerve somatosensory evoked potential (PTSEP) and the changes of functional indices.
Methods
Sixty subjects with SCI were studied who received rehabilitative management for over 2 months. The degree of completeness on basis of the initial AIS and PTSEP were evaluated at the beginning of rehabilitation. Following treatment, several functional indices, such as walking index for spinal cord injury version II (WISCI II), spinal cord independence measure version III (SCIM III), Berg Balance Scale (BBS), and Modified Barthel Index (MBI), were evaluated until the index score reached a plateau value.
Results
The recovery efficiency of WISCI and BBS revealed a statistically significant difference between complete and incomplete impairments of initial AIS and PTSEP. The SCIM and MBI based analysis did not reveal any significant differences in terms of the degree of AIS and PTSEP completeness.
Conclusion
AIS and PTSEP were highly effective to evaluate the prognosis in post-acute phase SCI patients. BBS and WISCI might be better parameters than other functional indices for activities of daily living to predict the recovery of the walking ability in post-acute SCI.
INTRODUCTION
According to the International Standards for Neurological and Functional Classification of Spinal Cord Injury organized by the American Spinal Injury Association (ASIA) and International Spinal Cord Society in 2000, a range of differences in ambulatory capability and stability is frequently observed for the same degree of impairment and the same injury site. While the ASIA impairment scale (AIS) has been the most common standard to examine the level of injury, its practicality as standard to estimate a prognosis is debatable [1].
Especially, the differentiation of incomplete impairment from complete impairment is very critical since more meaningful recovery is expected in patients with incomplete impairment. In AIS, the definition of complete impairment means the absence of motor and sensory functions that are controlled by the S4-5 segments. Based on AIS, grade A stands for complete spinal cord injury and the somatosensory evoked potential (SEP) study has been used as beneficial tool to determine the degree of complete or incomplete impairments in SCI [2]. However, there are not many reports evaluating the functional prognosis or predicting the walking capability based on the results of the SEP evaluation during the early period after an injury.
According to Marino et al. [3], very limited neurological recovery was reported in patients diagnosed with Frankel grade A (complete impairment) at admission since 88.8% of patients with Frankel grade A remained in a grade A condition at discharge.
Many functional indices, such as spinal cord independence measure (SCIM) [4], walking index for spinal cord injury (WISCI) [5,6], ambulatory motor index [7], and Rivermead mobility index [8], have been developed to evaluate the activities of daily living (ADL) and walking capability in SCI patients.
The WISCI developed by Ditunno et al. [5] in 2000 ranks the condition of a patient in 21 hierarchical levels depending on the type of walking support device, braces and physical assistance of one or more persons used during 10 m walking. Since SCIM developed by Catz et al. [4] in 1997 evaluates the ability of SCI patients to perform ADL, the SCIM does not measure the mobility index only but also measures walking and mobility in comprehensive environment. The evaluation tools of the Berg Balance Scale (BBS) and Modified Barthel Index (MBI) are not specific to SCI and are used as additional functional indices. The BBS developed by Katherine Berg in 1989 was originally developed to predict the risk of fall in elderly. Recently, it has been used as a measure of balance and walking of stroke or SCI patients [9,10,11,12]. Under the author's agreement on translation and reliability evaluation, BBS was introduced in 2006 [13].
In this study, any evoked SEP response was designated as an incomplete impairment in AIS and a non-evoked SEP response as a complete impairment to evaluate the importance of complete or incomplete impairments on the comprehensive functional prognosis of SCI patients in everyday ADL tasks and walking. It was our aim to investigate the applicability of those evaluation tools as a prognostic index of functional recovery. The relationship between maximum functional restoration and functional recovery efficiency was analyzed in terms of AIS and posterior tibial nerve SEP (PTSEP) study at the beginning of rehabilitation.
MATERIALS AND METHODS
Subjects
We reviewed the medical record retrospectively. From 2006 to 2012, sixty SCI subjects (47 male, age 47.0±18.0 years, age range 5-74 years, 31 cervical level injuries, 14 thoracic level and 15 lumbar level injuries) were included with rehabilitative treatment over 2 months after the post-acute phase. Patients diagnosed with concomitant brain injury, cognitive disturbances or lower extremity fractures were not included in this study. The average duration to initiate an active rehabilitative treatment after injury was 1.9±1.5 months.
Measurements
The AIS of each subject was evaluated by physical examination at the beginning of the active rehabilitation after injury. Grade A on AIS was designated as complete impairment and grades B, C, and D were designated as incomplete impairment.
The PTSEP study was performed with Dantec Keypoint EMG/EP system (Dantec, Skovlunde, Denmark). PTSEP study was performed on the subjects at the initial stage of rehabilitation. The stimulation duration lasted 0.1 ms with a stimulation frequency of 1.5 Hz. The stimulus intensity was set as minimal intensity to initiate any twitch of toes. SEP waveforms were averaged 300 times of stimulation and recorded twice for analysis. The P1 latency of PTSEP was defined as elapsed time to first positive wave peaks and the P1-N1 amplitude was defined as the voltage difference between initial positive and next negative peak. For example, a delayed latency over 2 standard deviations from age-average latency, an amplitude drop over 50% compared with controls or the opposite side or a non-evoked potential were diagnosed as abnormal in the data acquired from the PTSEP study.
According to the latency and amplitude analysis, the subjects with at least partially normal waveform or abnormal latency and amplitude compared with the contralateral side were categorized as the evoked group. The subjects with non-evoked potential were categorized as the non-evoked group.
BBS, WISCI version II, SCIM version III, and MBI were evaluated for all subjects from the beginning of active rehabilitation. Also, a two-week interval follow-up evaluation was conducted if subjects were discharged to go home or transferred to another hospital.
The index score difference between initial and plateau was divided by elapsed time to evaluate the recovery efficiency of each functional index. Also the plateau was described as maximal peak point of functional evaluation throughout the rehabilitative treatment period.
The recovery efficiency of each functional index was scored by following equation:
Statistical analysis
SPSS ver. 19 for Windows (IBM, Armonk, NY, USA) was used for statistical analysis. Nonparametric t-test was performed to analyze the functional index score difference between the complete and incomplete impairments group in AIS and was also done to analyze between any evoked and non-evoked groups of PTSEP study. The results were considered to be statistically significant at p<0.05.
RESULTS
Characteristics of population
On the basis of AIS, the number of subjects was 22 diagnosed with grade A, 8 with grade B, 17 with grade C, and 13 with grade D. The complete impairment group consisted of 22 subjects and the incomplete group of 38. Average period from the beginning to plateau or maximum score of functional indices was 3.4±1.7 months.
PTSEP study data analysis
The analysis of PTSEPs was conducted with the following AIS grades (Table 1). In the AIS A group, 3 subjects showed an evoked potential in their lower extremity and 19 subjects did not show an evoked potential. In the AIS B group, 7 subjects showed an evoked potential in their lower extremity and 1 subject did not show an evoked potential. In the AIS C group, all 17 subjects showed an evoked potential in their lower extremity. In the AIS D group, all 13 subjects showed an evoked potential in their lower extremity also. Despite the fact that the great part of the different AIS completeness groups a showed non-evoked PTSEP potential, most of AIS incompleteness groups (B, C, and D) showed an evoked PTSEP potential.
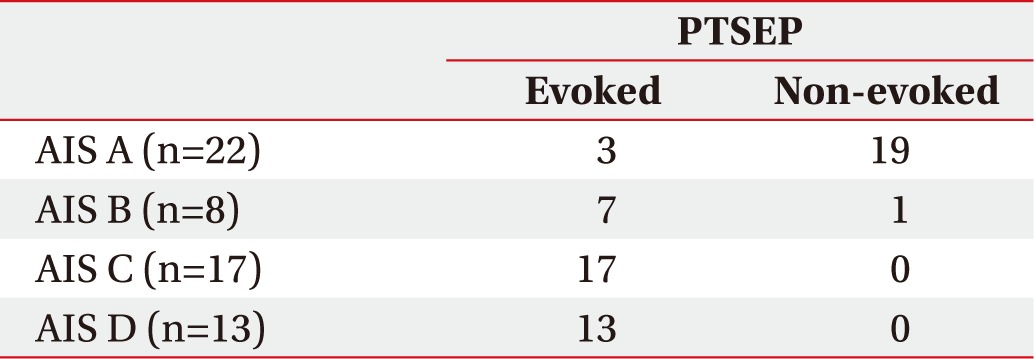
Analysis of PTSEP study data according to the ASIA impairment scale (AIS)
Recovery efficiency of functional index (BBS, WISCI version II, SCIM version III, MBI) comparison in terms of AIS
The scores or levels were collected at the beginning of rehabilitation and at the plateau of each functional index (BBS, WISCI version II, SCIM version III, MBI). The mean time interval between the beginning of rehabilitation and the maximum recovery or between the initial and the highest index score was 4.1 months for the complete impairment group and 3.0 months for the incomplete impairment group. According to the AIS scale, the mean time intervals between the beginning of rehabilitation and maximum recovery score were 4.1 months in AIS A, 3.7 months in AIS B, 2.4 months in AIS C, and 1.2 months in AIS D.
In the BBS analysis, the initial score was 5.4±7.8 for the complete impairment group and 19.7±19.7 for the incomplete impairment group. At discharge, the score for was 7.2±9.0 for the complete impairment group and 29.2±21.6 for the incomplete impairment group. In the WISCI analysis, the initial score was 3.3±6.0 for the complete impairment group and 8.7±8.6 for the incomplete impairment group. At discharge, the score was 5.9±8.2 for the complete impairment group and 10.8±8.8 for the incomplete impairment group. In the MBI analysis, the initial score was 22.3±21.0 for the complete impairment group and 31.7±17.7 for the incomplete impairment group. At discharge, the score was 37.9±23.9 for the complete impairment group and 55.8±23.8 for the incomplete impairment group. In the SCIM analysis, the initial score was 18.0±21.2 for the complete impairment group and 28.0±14.8 for the incomplete impairment group. At discharge, the score was 40.6±19.8 for the complete impairment group and 55.4±21.7 for the incomplete impairment group (Table 2).
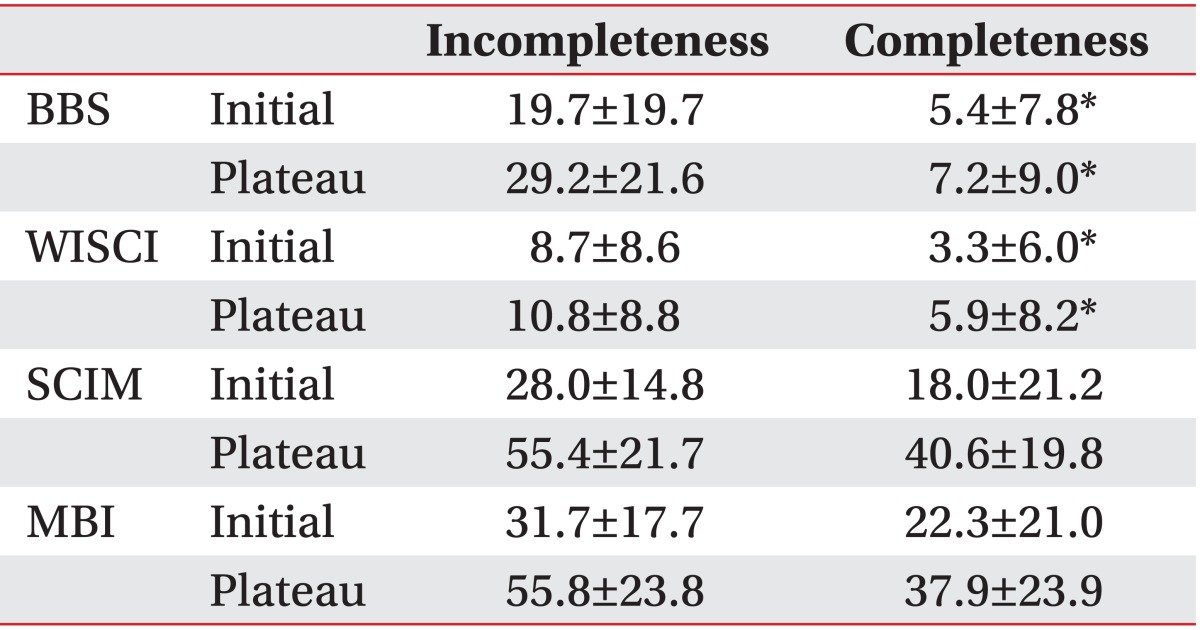
Differences between the completeness and incompleteness groups according to the ASIA impairment scale (AIS)
In terms of recovery efficiency analysis to evaluate the improvement of each functional index, the BBS showed significant differences with 2.0±3.7 and 8.9±9.7, respectively, between the complete and the incomplete impairment groups (p<0.05). Also, the WISCI showed significant differences with 1.4±2.5 and 4.1±4.0, respectively, between the complete and the incomplete impairment groups (p<0.05). However, no significant differences were seen in MBI and SCIM between the complete and the incomplete impairment groups (Table 3).
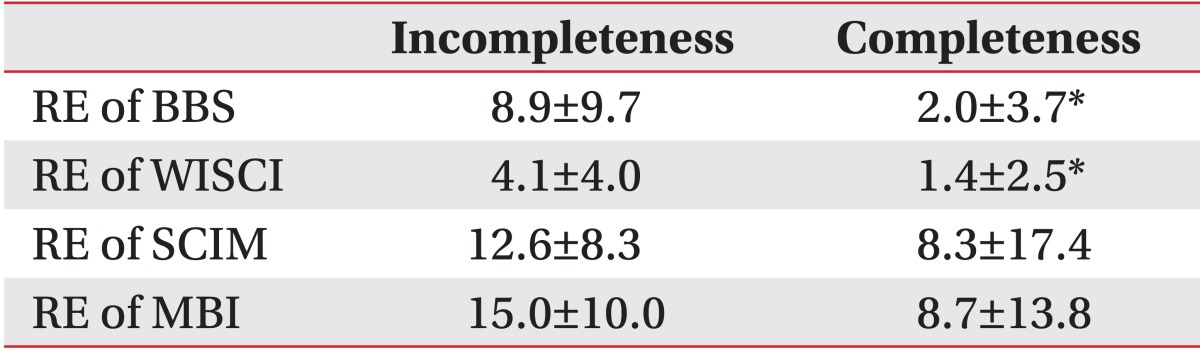
Differences in the recovery efficiency (RE) between the completeness and the incompleteness groups according to the AIS
Recovery efficiency of functional index (BBS, WISCI version II, SCIM version III, MBI) comparison in terms of PTSEP study
The PTSEP test was performed at the beginning of active rehabilitation and all subjects were classified into the non-evoked group or the evoked group. In the early post-injury PTSEP study, 33 subjects showed an evoked-potential in their bilateral lower extremity. Seven subjects showed an evoked-potential in their unilateral lower extremity and 20 subjects did not show an evoked-potential. Recovery efficiency scores of each functional index (BBS, WISCI, SCIM, and MBI) were analyzed at admission and discharge.
At the beginning of rehabilitation, the BBS score of the non-evoked and the evoked groups according to PTSEP was 6.3±8.9 and 19.6±19.8, respectively. The WISCI score was 3.0±5.9 and 8.9±8.5; the MBI score was 25.5±16.5 and 30.0±20.6; and the SCIM score was 19.5±15.8 and 26.8±19.0, respectively. At discharge, the BBS score of the non-evoked and the evoked groups was 9.7±13.0 and 28.5±21.8, respectively. The WISCI score was 4.3±6.8 and 11.6±8.9; the MBI score was 46.3±18.2 and 51.3±28.3; and the SCIM score was 45.5±15.7 and 52.0±24.9, respectively (Table 4).
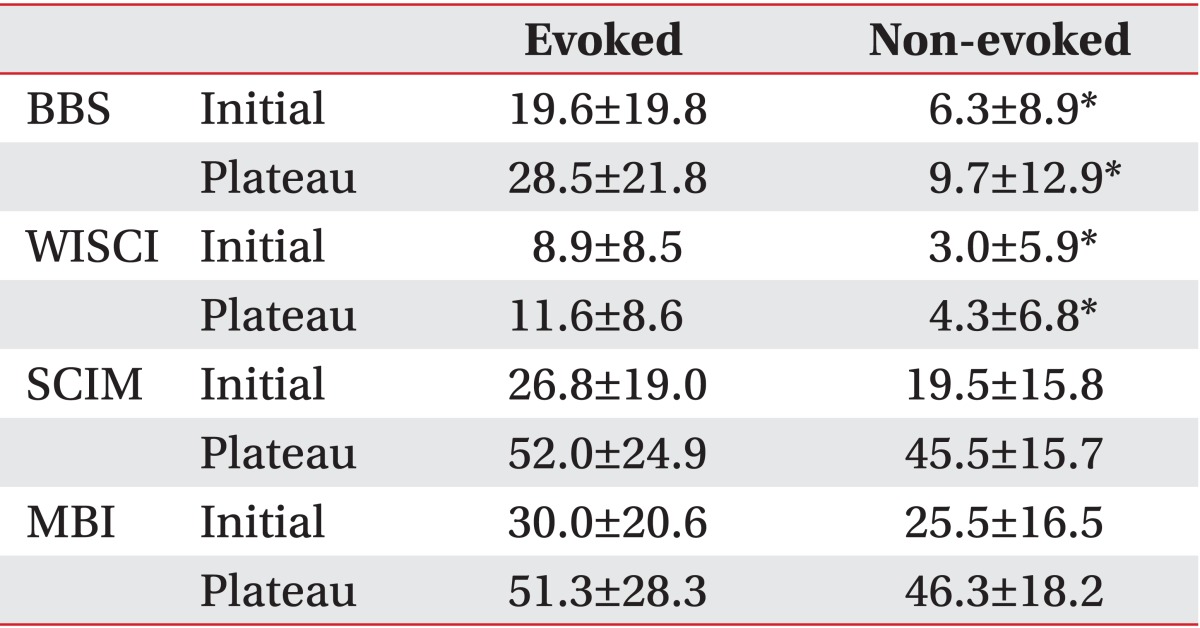
Differences between evoked and non-evoked groups according to the PTSEP study
The recovery efficiency between the non-evoked and the evoked groups was significantly different with 1.8±2.7 and 9.2±9.8 respectively, in BBS and 1.0±1.9 and 4.3±4.0, respectively, in WISCI (p<0.05). But there was no significant difference in SCIM and MBI (Table 5).
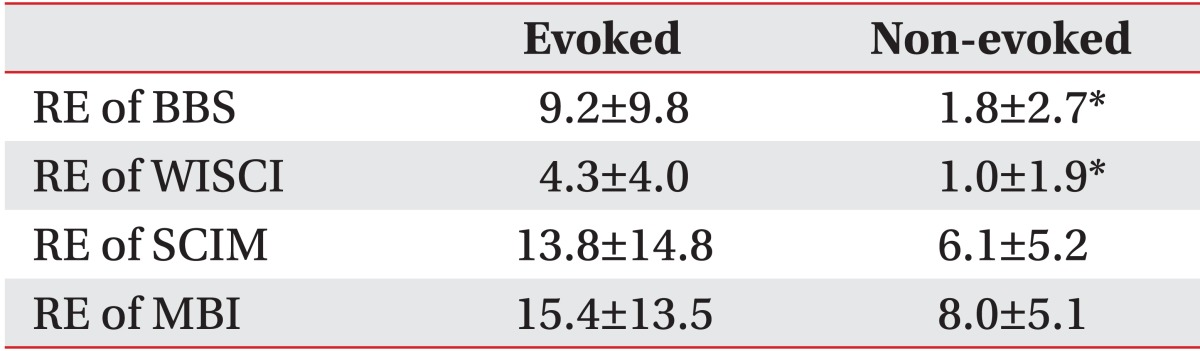
Differences in the recovery efficiency (RE) between the evoked and non-evoked groups according to the PTSEP study
DISCUSSION
The definition of complete impairment has been changed in SCI. Previously it was defined as the absence of voluntary movement or perceivable sensory function below the injured region. However, the definition of complete impairment is now the absence of S4-5 motor and sensory function.
In terms of SCI, most clinicians have perceived a complete impairment as the irrecoverable condition of axon damage below an injured region. For this reason, the SEP study has been a practical tool to evaluate the degree of impairment of the posterior column of the spinal cord by using unique sensory pathways. Moreover, the SEP study has been used as a diagnostic method to track and observe the post SCI recovery state as well as a motor or sensory evaluation [14].
The prognosis in SCI patients is critical to design their future treatment and rehabilitation plan. Especially, making a clinically accurate distinction between complete and incomplete impairments plays an important role not only in describing the condition of patients to their family, but also in designing the treatment plan in terms of patients' community participation. Furthermore, such classification has an impact on the treatment goal setting for ADL by projecting the walking capability of patients. A distinction between complete and incomplete impairments on the basis of AIS has several advantages in eliciting a speedy diagnosis via physical examination, guaranteeing concise and confirmed the agreement among clinicians. However, this distinction method has been reported to lack accurate neurophysiological perspectives and show a weak relativity to be used as data in the determination of prognosis [3].
The SEP study, an electrophysiological method to examine the entire central and peripheral nervous system including the proximal portion of peripheral nerve, spinal cord, brainstem, and cerebral cortex, is a practical tool not only to diagnose peripheral neuropathy, radiculopathy, SCI and brain injury, but also to estimate a prognosis of sensory and motor functions [15]. Since SEP evaluates the somatosensory pathway through the dorsal column, abnormal latency and amplitude can be identified in SCI patients [16].
Louis et al. [17] reported the abnormal sensory areas found throughout the clinical examination of cervical SCI patients were matched to the abnormal regions detected by dermatomal SEP. Also Date et al. [18] reported the SEP study could be used to define the location of neurological injury in acute SCI patients to whom physical examination is impracticable, for example in children and uncooperative patients.
Throughout this study, the negative (non-evoked) response group in PTSEP study at the beginning of rehabilitative treatment showed statistically significant decline of BBS and WISCI score at discharge compared to the positive (evoked) response group. This result suggests PTSEP can serve as not only a valuable tool to divide the complete or incomplete impairments in SCI, but also an index to predict the walking capability [2,19,20].
Differentiation between complete and incomplete impairments in terms of AIS and SEP was applied to compare various functional indices. AIS at discharge showed statistically significant difference only in BBS, but SEP at discharge was found statistically significant different in both BBS and WISCI.
Furthermore, the recovery efficiency estimated from the SEP within the rehabilitation period from initial to plateau showed statistical significance in BBS, WISCI, and MBI. These results provided the clinical applicability of the SEP study in the estimation of the process of rehabilitative treatment.
Although such functional evaluation indices as quadriplegia index of function, functional independence measure, MBI and RMI have been used to assess SCI patients for a long time, originally these indices have not been developed to measure the mobility which is critical to SCI patients. They were used instead to evaluate the cognitive function or comprehensive physical independence [8,21,22].
On the other hand, WISCI and SCIM are SCI patient specific evaluation tools [22]. While WISCI is limited to assess the abilities related to walking, SCIM comprehensively measures the abilities of a SCI patient to perform everyday tasks based on their value for the patient [4,5,6]. The WISCI ranks a patient in a 21-level hierarchical performance scale which incorporates gradations of walking support device, braces and physical assistance of one or more persons, and therefore means a lower scale less capable for walking [5,6]. The clear walking capability difference of each WISCI level cannot be turned into scores for simple comparison. But the WISCI analysis was observed to show a significant difference between complete and incomplete impairments in terms of both AIS and SEP. This result confirmed the applicability of WISCI.
SCIM gets points for all activities in three categorized areas: self-care (score 0 to 20), respiration and sphincter management (score 0 to 40), and mobility (score 0 to 40) also. Mobility is subcategorized as mobility in room and toilet, and mobility indoors and outdoors. The mobility assessment includes the weighted-moving distance and car-transfer motion. SCIM does not just measure walking index but evaluate walking capability and mobility in various environments [4]. The third international version (SCIM III) published in 2006 intended to bring a more detailed analysis in mobility [23]. It also has been reported WISCI appears to be more sensitive walking index than the other functional indices including SCIM, and has strong correlation with AIS and SCIM as well as RMI [21].
However, the SCIM assessment between complete and incomplete impairments in terms of both AIS and SEP did not show significant differences in the recovery efficiency in this study. This result suggests the SCIM measures comprehensive mobility in all aspects of daily activities rather than particular mobility and balance measurement. But further analysis is necessary to confirm such suggestion.
Throughout the functional index assessment in terms of both AIS and SEP during rehabilitation, the BBS showed statically significance in all comparisons between complete and incomplete impairments. Kim et al. [12] reported in 2010 the applicability of BBS as a walking index for SCI patients. Balance is a critical element to improve the sitting stability, sit to stand, standing stability as well as weight shift during standing and walking. Balance is maintained by reflex control of the limb movement created by integrated information from the somatosensory, visual and vestibular system. SCI patients lose their balance control due to the impairment of the spinal cord serving as a conduit for the somatosensory system and a control center of the limb movement. BBS scores consist of 14 subcategories (0-4 points) up to total 56 points [11,12,13,14].
AIS and PTSEP study for post-acute phase SCI patients at the beginning of rehabilitation could be used as basic data to estimate the prognosis of SCI in further studies involving more subjects.
In conclusion, PTSEP as well as AIS were highly effective for the prognostic evaluation in SCI patients in their post-acute phase. Especially, in comparison of the recovery efficiency among functional indices, the complete SCI revealed more significant differences in WISCI and BBS than any other functional indices for ADL evaluation.
Those results indicate that the distinction of complete and incomplete in SCI is more useful to estimate the recovery possibility of walking capability and balance control. Therefore, a PTSEP study at post-acute SCI could be a critical assessment tool to determine the functional prognosis of SCI patients.
ACKNOWLEDGMENTS
This work was supported by a research grant of the Inha University, 2014.
Notes
No potential conflict of interest relevant to this article was reported.