

INTRODUCTION
Cerebral palsy (CP) is a non-progressive neurological illness presenting with multiple impairments, including spasticity, weakness, and impaired motor control. This neurological disorder can cause secondary alterations in the musculoskeletal system, such as decreased muscle strength and tightness or contractures around the joints.
Spasticity is defined as a velocity-dependent resistance to passive stretch and is clinically assessed using the Modified Ashworth Scale (MAS) and the Tardieu scale [1,2]. Spasticity in clinical testing reflects a combination of intrinsic (non-neuronal component) and reflex-mediated (neuronal component) muscle stiffness. Secondary changes in intrinsic muscle property, such as collagen and tendon properties (e.g., loss of sarcomeres and subclinical contractures) result in spastic muscle tone, which in part compensates for paresis [3]. Collagen synthesis of the spastic muscle in CP may be stimulated directly through exposure of the spastic muscle to abnormal mechanical loads, which result from an abnormal neuronal firing pattern [4].
Local injection of botulinum toxin type A (BTA) into spastic muscles results in reversible disruption of acetylcholine release from the muscle's nerve endings [5,6], enabling increased function over time [7]. The use of BTA as an adjunct to other interventions, including physiotherapy and casting, has been recommended for the management of children with spastic CP in order to reduce spasticity, prevent or delay orthopedic surgery and improve function and gait [6,8].
Real-time sonoelastography (RTS) is a recently developed ultrasound-based imaging technique that evaluates tissue elasticity in real-time. RTS is in accordance with the principle that tissue compression produces strain (displacement), which is low in hard tissues and high in soft tissues [9]. RTS demonstrated a difference in intrinsic muscle stiffness between spastic and normal gastrocnemius muscles (GCMs) in children with CP [10]. The increased collagen content in the spastic muscle is indirectly estimated using RTS, since RTS measures intrinsic muscle stiffness. In children with spastic CP, changes in intrinsic muscle stiffness after BTA injection have been documented using RTS [11,12]. Intrinsic muscle stiffness increases with age-related rise of non-reducible collagen content in spastic muscle [13]. A previous study has claimed that as the age of children with spastic CP increases, passive intrinsic muscle stiffness may play a more important role in spasticity than do reflex-mediated activity [14].
We investigated the difference of changes of the ankle plantar flexor spasticity using MAS, intrinsic muscle stiffness using passive range of motion (PROM) and RTS and functional outcome using Gross Motor Function Measure (GMFM), after BTA injection in children with spastic CP, according to age.
MATERIALS AND METHODS
Participants
Sixteen children (mean age, 6.0Вұ2.7 years [range, 2.3-9.5 years]), including 10 with diplegia and 6 with hemiplegia, were admitted to the inpatient clinic of the Department of Rehabilitation Medicine at Daegu Catholic University Medical Center. Group 1 included 7 children (3 boys and 4 girls; age, 3.7Вұ1.1 years; 4 with diplegia and 3 with hemiplegia, 11 legs; mean body weight, 14.2 kg [range, 10-21 kg]; 2 with Gross Motor Function Classification System [GMFCS] level II and 5 with GMFCS level III) under 5 years of age. Group 2 included 9 children (5 boys and 4 girls; age, 9.2Вұ1.7 years; 6 with diplegia and 3 with hemiplegia, 15 legs; mean body weight, 27.5 kg [range, 19-42 kg]; 1 with GMFCS level II and 8 with GMFCS level III) over 5 years of age. The inclusion criteria were as follows: 1) verified diagnosis of CP by a physiatrist specialized in pediatric rehabilitation medicine; 2) independent ambulation with or without gait-assistive devices; 3) spastic gait with equinus of the ankle; and 4) dynamic ankle contracture. Dynamic ankle contracture was confirmed if equinus of the ankle was observed during ambulation, and passive dorsiflexion of the ankle could be accomplished beyond the neutral position with the knee extended. Exclusion criteria were as follows: 1) more than 13 years or less than 2 years of age; 2) previous BTA injection in the GCM or serial casting of the ankle within 6 months before enrolment; 3) fixed ankle contracture; and 4) surgery of the lower limbs in the 12 months prior to inclusion. The Institutional Review Board and Ethics Committee at Daegu Catholic University Medical Center approved the protocol of this study. Because all the children in this study were younger than 18 years of age, informed consent for participation was obtained from the parents of the children.
Intervention
All the children received the same intervention, including rehabilitation treatment and an intramuscular injection of BTA (Meditoxin; Medytox Inc., Seoul, Korea) in each medial and lateral GCM muscle under ultrasound guidance. The BTA dosage was calculated in accordance with the current guidelines accessible at the time of treatment [15]: the dose for hemiplegic and diplegic CP children was 4 U/kg and 6 U/kg, respectively. No adverse effects or complications were observed after the injection. Before the injection, all the children underwent outpatient rehabilitation treatment once a week. After the injection, inpatient rehabilitation treatment, including stretching and strengthening exercises, functional electrical stimulation and progressive gait training, was performed twice daily for four weeks. After the inpatient rehabilitation treatment, the frequency for outpatient rehabilitation treatment for all the children was twice a week for six months.
Clinical measurements
Clinical assessments were performed at baseline (pre-injection) and 1-, 3-, and 6-month post-injections. PROM of ankle dorsiflexion was assessed using a classical two-arm goniometer in the supine position, with the knee fully extended and knee flexed to 90В° by the physiatrist throughout the study. Spasticity of the ankle plantar flexor was measured as the degree of resistance to passive movement, using the MAS, and was rated on a scale of 0 (normal) to 5 (extreme), according to the amount of resistance felt by the physical therapist. The physical therapist also measured the GMFM.
RTS
Ultrasound and RTS of the medial GCM were performed simultaneously using a commercially available ultrasound system with a 5- to 13-MHz multifrequency linear transducer (Antares; Siemens Healthcare, Erlangen, Germany) by a physiatrist (17 years of experience in musculoskeletal ultrasound and 4 years of experience in RTS), at baseline and 1-, 3-, and 6-month post-injections. Children were scanned on the longitudinal plane of the medial GCM, and natural compression was applied with the transducer in accordance with normal respiration. All the children were scanned on an examination table in the prone position with their feet hanging off the edge. Scanning was discontinued whenever reflexive or voluntary contraction of the lower limb muscles was observed. The proximal tendon, musculotendinous junction and muscle portion of the medial GCM were easily recognized from proximal to distal scanning of the leg on ultrasound. Scanning was performed repeatedly at a fixed point on the medial GCM, which was located between two reference points: one point was located at the proximal one-third of a longitudinal line from midway between the medial and lateral malleoli to midway between the medial and lateral epicondyles; and the other point was located at the medial end on a transverse line, perpendicular to the point on the longitudinal line. Using ultrasound guidance, a region of interest (ROI) was selected, which included the medial GCM fascicles with clearly demarcated linear hyperechoic strands that corresponded to fibroadipose septa (perimysium) and normal surrounding tissue.
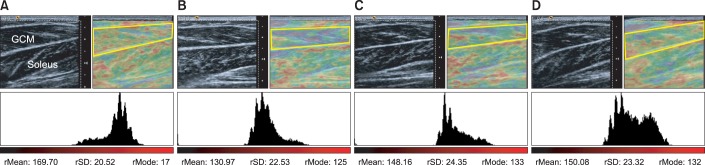
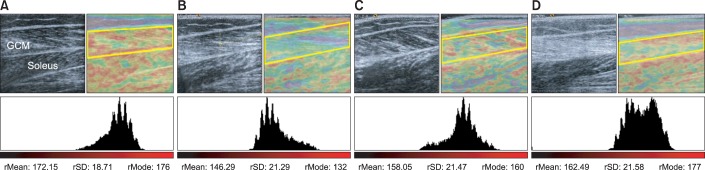
RTS was performed as a color-coded graphic representation of relative stiffness of the structures within the selected ROI, such that purple indicated soft, green, and yellow indicated intermediate stiffness and red indicated stiff. An appropriate degree of natural compression was determined by manual adjustment, such that perimysium appeared predominantly yellow to red on RTS. The color-coded RTS image was depicted on the left side of the screen, while the ultrasound image was displayed on the right side. Our RTS protocol included standardized color encoding, and the same color scale was used for all the children.
The recorded RTS images were replayed in order to select the best representative image, which was selected based on an adequate depiction of tissue structure and consistent reproduction of the scanned images. Further, the color pattern of the recorded images was quantitatively analyzed on a personal computer using Image J software (National Institutes of Health, Bethesda, MD, USA) by another physiatrist. The color histogram represented the number of pixels that have colors in each of the fixed list of color ranges. The median red pixel intensity (RPI) within the ROI was calculated, with a high value derived from a high color intensity. RTS was performed twice, and a representative image was taken in each scan to check the intra-rater reliability of the measurements.
Statistical analysis
Statistical analysis was performed using SPSS ver. 19.0 (IBM Corporation, Armonk, NY, USA), with the level of significance set at <0.05. Fisher exact test was used for the difference of gender, GMFCS level and topographical classification of CP between two groups at baseline. Within-group changes in measured parameters including PROM of ankle dorsiflexion, MAS of ankle plantar flexor, GMFM and RPI were analyzed with a two-factor repeated measures analysis of variance from baseline through 1-, 3-, and 6-month post-injections. Intergroup differences with respect to measured parameters were analyzed using the Mann-Whitney U test. The interclass correlation coefficient was used to examine the intra-rater reliability of repeated RPI measurements.
RESULTS
There were no significant differences in the gender, topographical classification and measured parameters including GMFCS level, PROM of ankle dorsiflexion, MAS of the ankle plantar flexor, GMFM and median RPI of the affected medial GCM between the two groups at baseline.
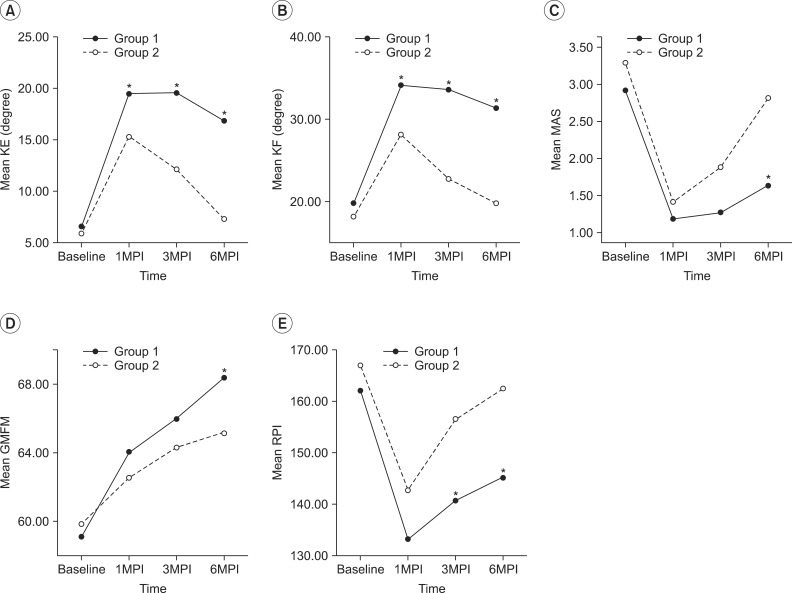
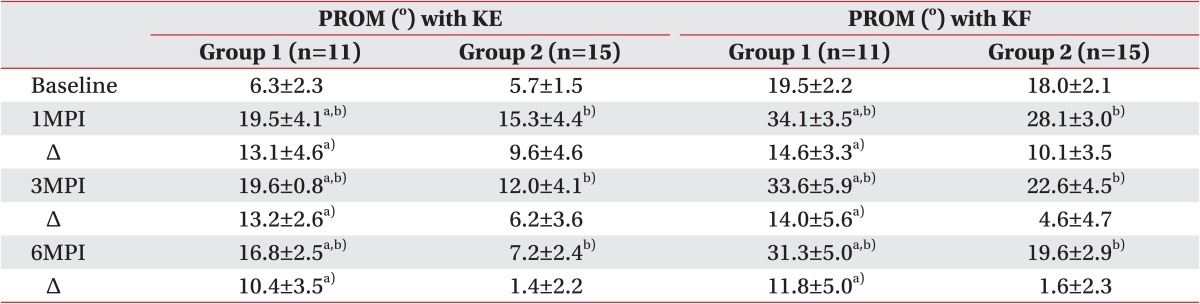
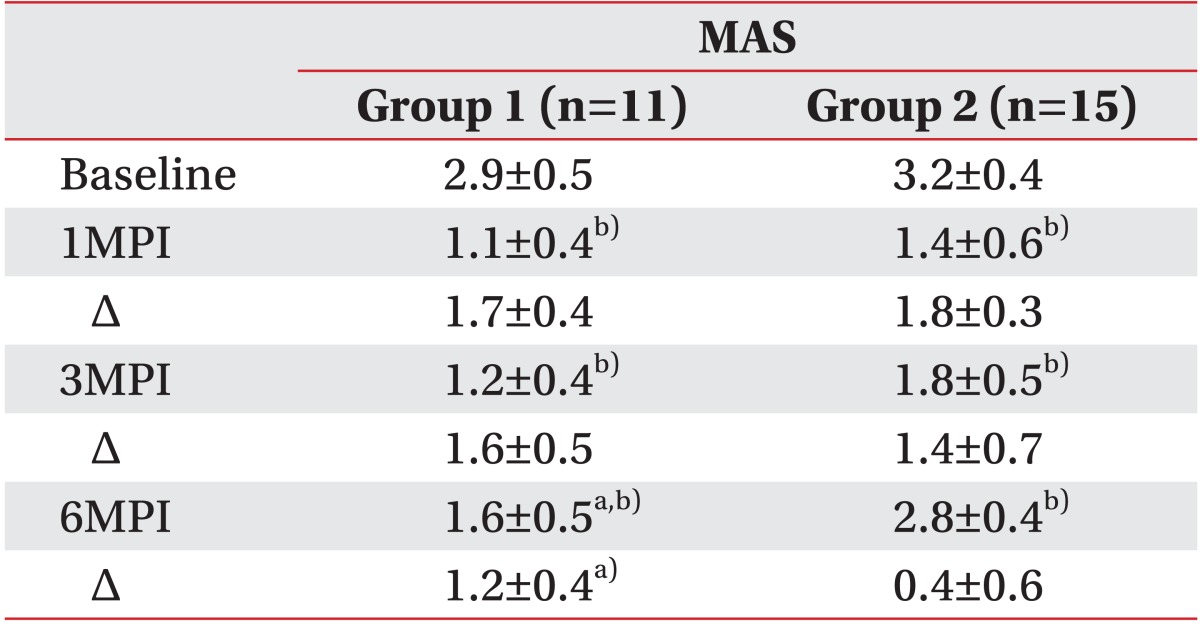
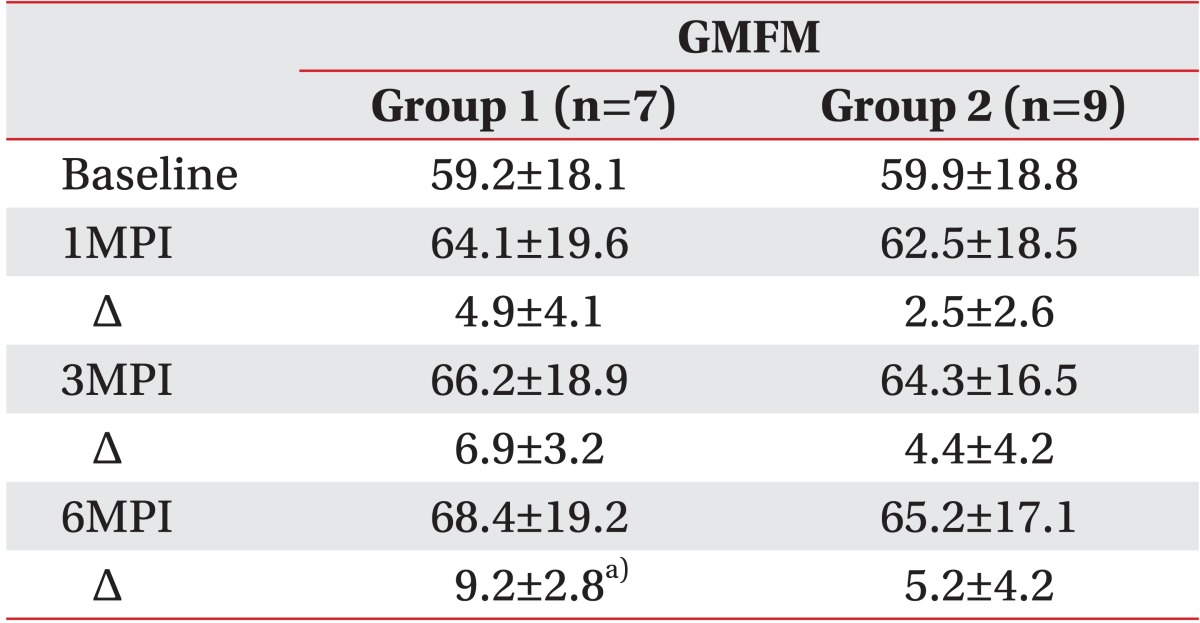
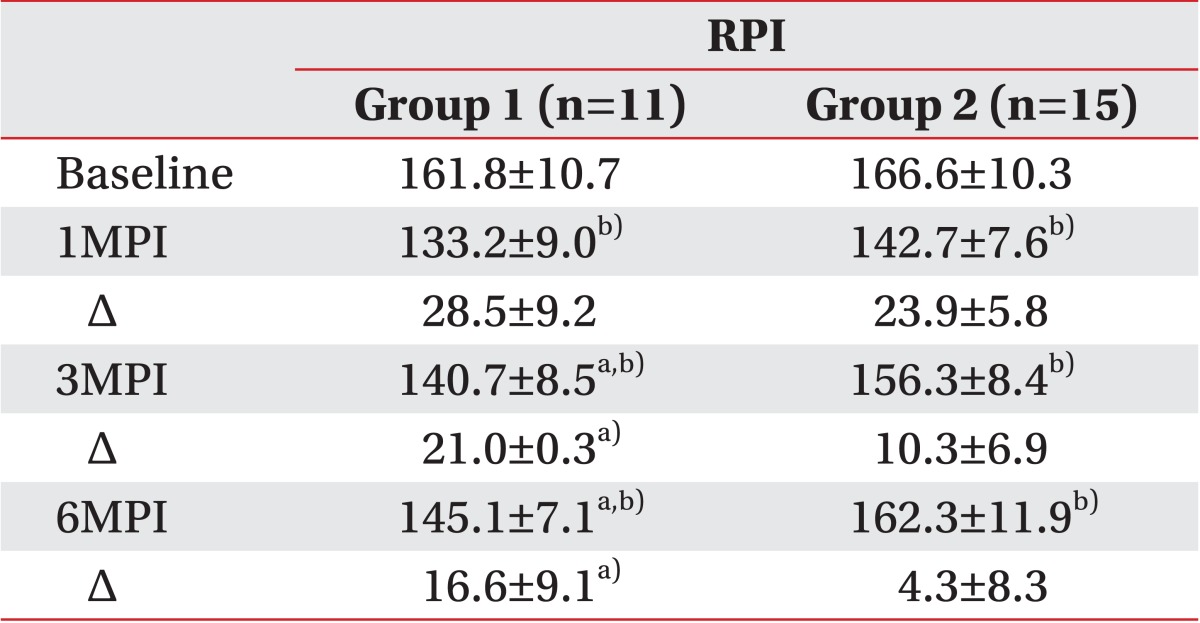
In both groups, the PROM of ankle dorsiflexion with knee extension and flexion significantly increased until 6-month post-injection. However, the change of PROM of ankle dorsiflexion in group 1 was significantly greater than that in group 2, until 6-month post-injection (Table 1; Fig. 1A, B). The mean MAS of the ankle plantar flexor was significantly decreased until 6-month post-injection in both groups (Table 2). The mean change in the MAS of the ankle plantar flexor between baseline and 6-month post-injection in group 1 was greater than that in group 2 (Table 2, Fig. 1C). However, there was no significant difference in the mean change in the MAS of the ankle plantar flexor between baseline and 1- and 3-month post-injections in either group (Table 2). There was no significant difference in the mean GMFM at 1-, 3-, and 6-month post-injections compared with baseline in both groups (Table 3). However, the mean changes in the GMFM between baseline and 6-month post-injection were greater in group 1 than that in group 2 (Table 3, Fig. 1D). The median RPI of the medial GCM was significantly decreased until 6-month post-injection in both groups. However, the mean changes in the median RPI of the medial GCM between baseline and 3- and 6-month post-injections in group 1 were greater than those in group 2 (Table 4; Figs. 1E, 2, 3).
The interclass correlation coefficients of repeated RPI measurements in groups 1 and 2 were 0.901 and 0.911 at baseline, and 0.905 and 0.902 at 1-month, 0.915 and 0.907 at 3-month, and 0.912 and 0.917 at 6-month post-injection, respectively.
DISCUSSION
Our study demonstrated a significant difference in spasticity change in the ankle plantar flexor after BTA injection based on age in children with spastic CP. The mean MAS of the ankle plantar flexor significantly decreased at 1- and 3-month post-injections compared to that at baseline, in both groups. There was no significant difference in the mean change in the MAS of the ankle plantar flexor between baseline and 1- and 3-month post-injections between both groups. However, the mean change in the MAS of the ankle plantar flexor between baseline and 6-month post-injection in children under 5 years of age was significantly greater than that in children over 5 years of age. These findings may be explained as follows. Because both groups received the same dose of BTA according to weight, the similar degrees of MAS reduction at 1- and 3-month post-injections in both groups were caused by the neuronal action of BTA, which is based on interference with the release of acetylcholine in the presynaptic terminals. It is maintained for approximately 90 days, and is dependent on the injection doses [13,16]. In addition to the reflex-induced neuronal component of passive stretch, non-neuronal components also contribute to resistance in passive stretch. Clinically assessed spasticity may rather be caused by non-neuronal changes in the spastic muscle and other tissues than by neuronal changes. These non-neuronal changes happen in both contractile and non-contractile tissues, such as stiffness of muscle fibers, loss of sarcomeres, changes in tendons and collagen tissue, and change in mechanical muscle-fiber properties [17]. In clinical practice, the MAS is probably the most commonly used test for the grading of spasticity and mainly measures the neuronal component of spasticity [18]. Therefore, neural component of spasticity plays an important role in reduction spasticity during 3-month post-injection. The difference of the mean change in the MAS at 6-month post-injection between groups may be related to the non-neuronal component of spasticity, which is caused by intrinsic muscle stiffness. When the block of neuronal component of spasticity by BTA injection wears off after 3-month post-injection [19], non-neuronal component of spasticity may play a major role in assessment of spasticity using MAS. In our study, the median RPI of the medial GCM on RTS significantly decreased in both groups until 6-month post-injection. However, the mean change in the median RPI between baseline and 3- and 6-month post-injections in children under 5 years of age was significantly greater than that for over 5 years of age. This difference may be attributed to alterations in passive muscle properties that are influenced by the age-related increase in non-reducible collagen content in the spastic muscle [13]. Because RTS indirectly assesses the biomechanical component of the spastic muscle, non-reducible collagen content in children over 5 years of age may be much higher than that in children under 5 years of age. Therefore, the muscular components may contribute to the difference of decreased spasticity, as measured by the MAS at 6-months post-injection
In our study, the mean change of PROM of ankle dorsiflexion in children under 5 years of age was significantly greater than that in children over 5 years of age at 1-, 3-, and 6-month post-injections. There is a possible explanation for the greater change of PROM of ankle dorsiflexion after BTA injection in children under 5 years of age. Resistance to passive motion is the sum of the reflex muscle activity and non-neuronal changes. However, non-neuronal changes in spastic muscle mainly contribute to the resistance to joint motion. Restricted joint range of motion due to structural alterations of spastic muscle is influenced by the age-related increase of non-reducible collagen content in spastic muscle. In comparison with a normal muscle cell, a spastic muscle cell has a short resting sarcomere and an increased elastic modulus, implying dramatic remodeling of intra- and extra-cellular structural components, such as titin and collagen [20]. Collagen has an important physiological role in the development of muscle stiffness [21]. In children with spastic CP, non-reducible collagen content in the spastic muscle increases with age, because inactivity due to muscle spasticity leads to muscle weakness, disused muscle atrophy and muscle shortening [13]. Rehabilitation treatment after BTA injection may have a differential effect on the reorganization of collagen bundles in intramuscular connective tissue of the ankle plantar flexor, according to the age of children with spastic CP [22]. Therefore, the change of PROM and RPI due to a decrease of intrinsic muscle stiffness in children under 5 years of age was greater than that in children over 5 years of age, from the early period after intensive rehabilitation treatment for 4 weeks
The mean change in the GMFM between baseline and 6-month post-injection in children under 5 years of age was greater than that in children over 5 years of age. The improvement in gross motor function in both groups was influenced by the natural maturational development of children, combined with rehabilitation treatment and BTA injection. A previous study [23] claimed that in terms of the rate of development, children in GMFCS level III were expected to have reached about 90% of their potential by about age of 3.7 years. Other studies [24,25] showed that the majority of children at GMFCS level III reached their top GMFM at the age of 7-8 years. In our study, eight of the nine children in group 2 were GMFCS level III, and the mean age was approximately 9.2 years. Therefore, a greater improvement in gross motor function was observed in children under 5 years of age. Our results agree with those of an earlier study [15], which has reported that younger children with CP are likely to show greater effects after BTA injection.
The intra-rater reliability of RPI measurement in the medial GCM on RTS was good in our study. These results are in accordance with those obtained by Nordez et al. [26], which showed a good reliability of local muscle stiffness at rest, using transient sonoelastography in vivo.
This study has several limitations. First, it is not advisable to generalize our results in children with spastic CP, because our sample size is small. Further studies with a large sample size and longer follow-up are necessary to establish the validity of our results. Second, double blinding, as well as blinding of the children and examiner, was not feasible because of the nature of the treatment method. Third, we could not evaluate whether inter-rater reliability of RPI measurement. RTS is operator dependent, requires long-term experience and has a technical problem in image reproducibility due to instability of the applied pressure using the free-hand technique [8]. Last, we did not contemplate the reliability of the MAS of the ankle plantar flexor in children with spastic CP. A previous study [27] has claimed that the MAS has an acceptable inter-rater reliability for testing upper limb spasticity, but not for testing lower limb spasticity.
In conclusion, our pilot study demonstrated the different changes in the spasticity of the ankle plantar flexor after BTA injection based on age. Therefore, we suggest that age may be considered when determining BTA injection in children with spastic CP.