The Accuracy of the Swallowing Kinematic Analysis at Various Movement Velocities of the Hyoid and Epiglottis
Article information
Abstract
Objective
To evaluate the accuracy of the swallowing kinematic analysis.
Methods
To evaluate the accuracy at various velocities of movement, we developed an instrumental model of linear and rotational movement, representing the physiologic movement of the hyoid and epiglottis, respectively. A still image of 8 objects was also used for measuring the length of the objects as a basic screening, and 18 movie files of the instrumental model, taken from videofluoroscopy with different velocities. The images and movie files were digitized and analyzed by an experienced examiner, who was blinded to the study.
Results
The Pearson correlation coefficients between the measured and instrumental reference values were over 0.99 (p<0.001) for all of the analyses. Bland-Altman plots showed narrow ranges of the 95% confidence interval of agreement between the measured and reference values as follows: 0.14 to 0.94 mm for distances in a still image, -0.14 to 1.09 mm/s for linear velocities, and -1.02 to 3.81 degree/s for angular velocities.
Conclusion
Our findings demonstrate that the distance and velocity measurements obtained by swallowing kinematic analysis are highly valid in a wide range of movement velocity.
INTRODUCTION
Dysphagia, a difficulty in swallowing food, can be caused by a wide range of problems, including anatomical and physiological derangement in an area from the oral cavity to the esophagus, as well as a neurological impairment [1]. Because an impaired cough response can mask repeated aspiration and display no evident signs or symptoms, dysphagia is seldom diagnosed by clinical history alone [2]. Instead, a detailed assessment using a fluoroscope or an endoscope is required in many cases.
Modified barium swallow (MBS), namely videofluoroscopic swallowing study (VFSS), affords a unique opportunity to observe the movement of the pharyngeal structures and food bolus [1]. The interpretation of MBS is, however, largely based on qualitative or, at best, semi-quantitative judgments by trained experts. Because the pharyngeal swallow occurs in a very short time, in 0.3 to 0.7 seconds [3], video recording is usually required. Although overt abnormalities, such as subglottic aspiration, can hardly be missed in the repeated observation of the recorded video clips, detecting minute differences or small quantitative changes in the swallowing motion is often a challenge, even to an experienced clinician. However, it was reported that the mean differences of distance for the hyoid movement during swallowing between healthy subjects and patients with dysphagia were merely several millimeters [4], bringing into question the sensitivity of MBS to detect small but clinically meaningful changes.
To overcome the limitation due to qualitative nature of MBS, swallowing kinematic analysis has been introduced and is now widely used [3,5-9]. Using a swallowing kinematic analysis as the interpretation method of VFSS enabled us to understand the pathophysiology of dysphagia in more detail [7,10]. It has also been used to confirm the therapeutic effect [11].
As in other biomechanical studies, the process of kinematic analysis is composed of many potentially error-prone steps, such as frame grabbing, digitization, identification of reference points, and anatomic points of interest, transformation of each point into new x- and y-coordinates, and normalization to the standard international units. In addition, the motion of some structure, such as the hyoid bone or epiglottis, are very fast at moments, while the typical rate of image processing of most fluoroscope is only 10 to 30 frames per second. This poses another question; whether the frame rate is high enough to catch up to the fastest motion of the structures. In this regard, validation of the swallowing kinematic analysis is necessary for the clinicians to interpret the results precisely. Although there have been many reports on the intra- and inter-rater reliability of the kinematic analysis on swallowing [6,9,12,13], to our knowledge, there has been no report on the accuracy of swallowing motion analysis. The present study aimed to validate the swallowing kinematic analysis at various movement velocities of the hyoid and epiglottis, using an instrument mimicking the physiological swallowing movement.
MATERIALS AND METHODS
We designed an instrumental model imitates the movement of the epiglottis and hyoid bone during swallowing, which is possible to set a specific velocity of movement with geared alternating current (AC) motor and digital speed controller. After that, the image and movies were obtained from videofluoroscopy at various velocities, similar procedures to VFSS in dysphagia patients. The comparison between measured length and velocity through kinematic analysis and those of reference values, from instrumental setting was done for the validation. The details of each step are shown below.
The process of kinematic analysis
Images and movies were acquired from a mobile fluoroscopy system BV Pulsera (Philips, Amsterdam, Netherlands) and made into digital files using a digital computer frame grabber board Pegasus HD/SD Board (Grass Valley Inc., Honorine, France) and image processing software EDIUS 4.5 (Grass Valley Inc.). All files were recorded in a high resolution (1980×1080 pixels) format. As the actual vertical length of the covered area was about 80 mm, a minimum detectable displacement was around 0.07 mm/pixel (80 mm/1080 pixels). Because image acquisition rate was 30 frames per second, the minimum detectable velocity of a moving object was 2.1 mm/s with a frame by frame analysis. A rater with 2-year research experience of swallowing motion analysis, who was blinded to the study design and purpose, analyzed the movie clips. The points of interest in every frame of the movie clips were analyzed, using motion analysis software Ariel Performance Analysis System (Ariel Dynamics Inc., Trabuco Canyon, CA, USA). All the digitized data were then filtered with a quintic spline algorithm. The whole process is shown in Fig. 1.
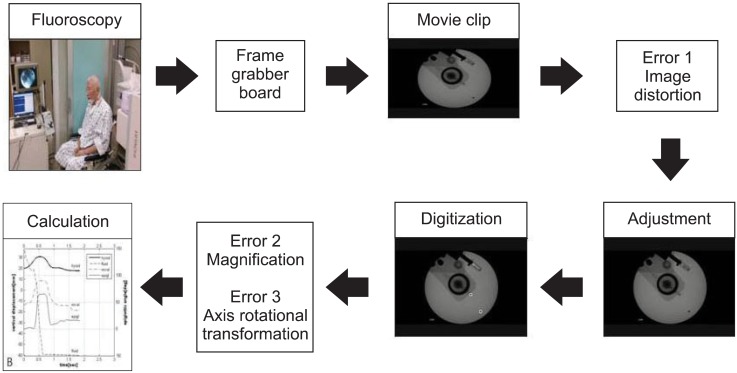
The whole process of the swallowing kinematic analysis.
All the binary data were exported for subsequent analysis. A script was written, using MATLAB R2007a (Math-Works, Natick, MA, USA) for the adjustment of potential errors and calculation. The process of analysis, which was used in the study, was identical to the one used to analyze the images of VFSS in clinical settings.
We identified three potential sources of error in a computer-based image analysis, and corrected them using the MATLAB script. The first one was an image distortion during frame-grabbing, which makes a circular-shaped image into an oval-shaped one (Fig. 1). To correct this image distortion, we calculated the ratio of the long and short axes of the oval-shaped image and multiplied the coordinate data by the inverse number. The second problem is the well-known magnification effect [3]. The size of an object on fluoroscopic image is proportional to the distance from an object and the X-ray detector. To correct this magnification effect, we placed a length determined marker to serve as a ruler. After fluoroscopic recording, we normalized the data using the ratio of the real length and measured the length of a marker. The third potential error of swallowing kinematic analysis is associated with the motion of the head and neck during recording. This problem can be alleviated by using a rotation matrix with anatomically defined coordinates. Although it is unlikely that the instrumental model moves during fluoroscopic recording, a rotational matrix, using the internal coordinates, was also used to confirm the technical integrity of the actual swallowing kinematic analysis.
Instrumental model of the swallowing motion
Considering that the velocity and distance for the swallowing structures are different for every single person, we decided to analyze the accuracy at a range of the length and velocity. For that purpose, we made an instrument mimicking the movement of the epiglottis and hyoid bone during swallowing, using the slider-crank and the belt-pulley mechanisms (Fig. 2A). Both mechanisms are driven simultaneously by rotation of the same motor and imitating the rotational motion of epiglottis movement and the linear motion of the hyoid bone movement, respectively. We selected the hyoid bone and epiglottis not only because these two structures play key roles in swallowing process [6,9,14], but also these structures move fast during swallowing. Round radio-opaque markers of 3 mm diameter were placed on the end-tip of the slider and rotator. Geared AC motor with digital speed controller motor, 6 W, AC 220 V; gear ratio, 1/20; speed controller, SUD60IB-V12 (SPG Co. Ltd., Incheon, Korea) was employed to drive the instrument (Fig. 2B). As the motor worked, the radio-opaque markers on the slider and on the rotator showed sinusoidal linear motion and constant rotational motion. The range of motor speed was control-lable between 0 and 95 revolutions per minute (rpm). The motor speed can be converted into linear velocity of the end-tip of the slider-crank by simple calculation as follows (Fig. 2C):
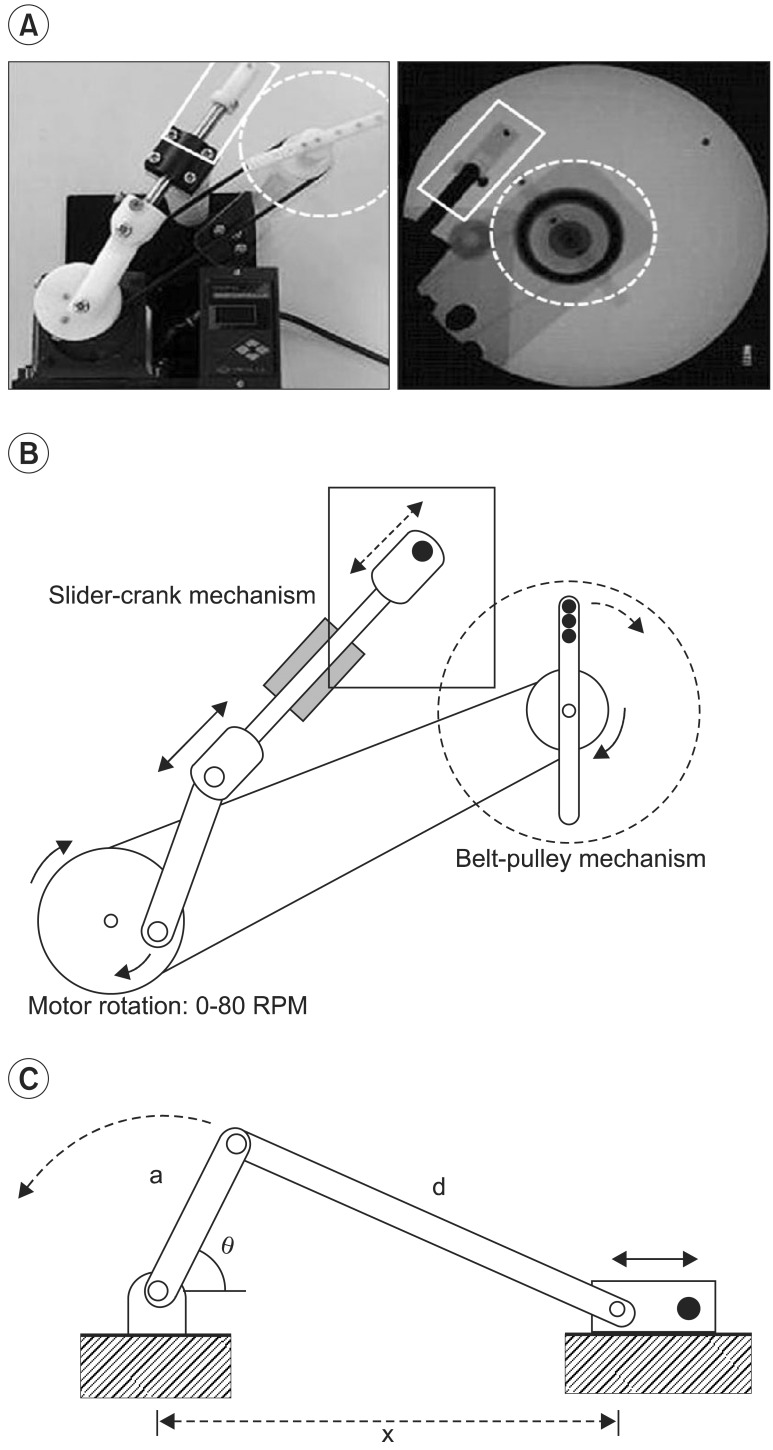
(A) The slider-crank and belt-pulley mechanisms. The model of swallowing, representing movement of the epiglottis and the hyoid bone in swallowing (left) and fluoroscopic image of the model of swallowing (right). (B) The circular movement (dashed circle) and linear movement (square) of the model represent the rotational movement of the epiglottis, and the back-and-forth movement of the hyoid bone, respectively. (C) Calculation of the velocity of the end-tip of slider-crank mechanism.
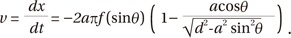
Where v is linear velocity (mm/s) of the end-tip of the slider, x is distance (mm) between the center of the crank and the end-tip of the slider, t is time (second), a is length (mm) of the crank arm, f is frequency (Hz) which means the rotations per second, θ is angle (rad) between the crank and slider, and d is length (mm) of the connecting rod.
From the calculation, the range of linear velocity was from 0 to 76.25 mm/s and the range of angular velocity was from 0 to 585 degree/s. We decided to test this range of linear velocity to cover the reported physiological velocity of the hyoid bone [8]. Unfortunately, there had been no previous report on the angular velocity of the epiglottis.
Evaluation of the accuracy
A "reference" value of the length or velocity was obtained by the standard measurement, i.e., the length measured by a caliper and the velocity set by the speed control panel. The "measured" value was gained by a swallowing kinematic analysis.
Measuring lengths of simple objects, such as coin, key, and clips, were used as basic screening for validation during fluoroscopic recording of eight objects, a still image was retrieved and distances of the longest axes were calculated on each object using the swallowing kinematic analysis (Fig. 3). A measured value of the velocity for the movement model was obtained in the same manner, but each movie clip was covered by at least two cycles of the rotational movements. The maximal linear velocity was averaged for 4 peaks during 2 cycles.
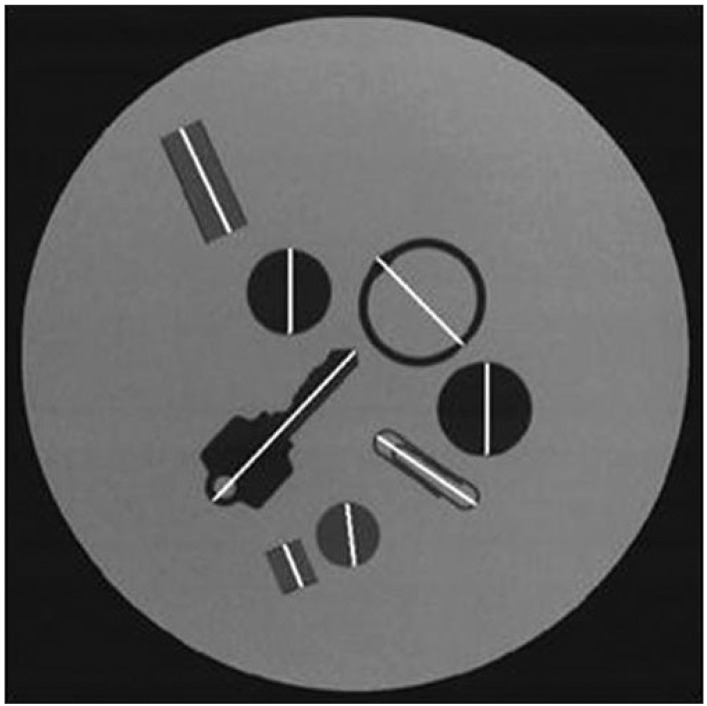
Fluoroscopic images of different kinds of objects. The length of different types of object was measured by swallowing kinematic analysis to assure the validity of method.
Statistical analysis
We evaluated the agreement between "reference" and "measured" values for the lengths of objects and velocities of the model instrument. To evaluate the accuracy, the Bland-Altman analysis was used in addition to the Pearson correlation coefficient, because a high level of correlation by itself does not guarantee that the values agree. Statistical analyses were performed with SPSS ver. 17.0 (SPSS Inc., Chicago, IL, USA).
RESULTS
The length of objects, linear velocity of the hyoid bone and angular velocity of the epiglottis obtained by kinematic analysis are in good agreement with reference values in a wide range of movement velocities.
The reference and measured values of the length of objects were highly correlated (Pearson correlation coefficient, 0.999; p<0.001) (Fig. 4A). Bland-Altman analysis showed the mean difference of the two values as 0.54 mm, while the limit of agreement, which means 95% confidence interval of agreement is 0.14 to 0.94. All (8 out of 8) of the mean differences between the two values of length data were within the limit of agreement, showing good comparability (Fig. 4B).
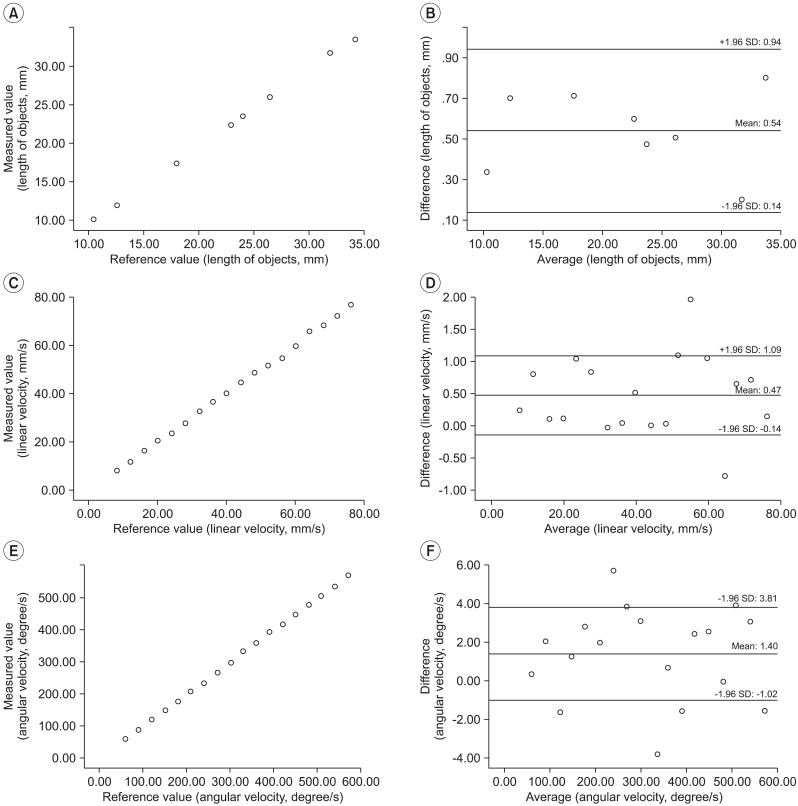
(A) Positive correlation of the reference and the measured values for the length of objects in a scatter diagram. (B) Bland-Altman plot for the length of objects: the graph shows the relation between the mean of the two values (reference and measured value) for the length of objects (the x-axis) and the difference between the two values for the length of objects (the y-axis). (C) Positive correlation of the reference and the measured values for the linear velocities in a scatter diagram. (D) Bland-Altman plot or the linear velocities: the graph shows the relation between the mean of the two values for linear velocity (the x-axis) and the difference between the two values for linear velocity (the y-axis). (E) Positive correlation of the reference and the measured values for the angular velocities in a scatter diagram. (F) Bland-Altman plot for the angular velocities: the graph shows the relation between the mean of the two values for angular velocity (the x-axis) and the difference between the two values for angular velocity (the y-axis). In all Bland-Altman plots, middle among the three horizontal lines represents the mean value of the difference between the reference and measured vales. Upper and lower lines represent two standards deviations of the mean.
The reference and measured values of linear velocities also showed excellent correlation (Pearson correlation coefficient, 0.999; p<0.001) (Fig. 4C). In Bland-Altman analysis, the mean difference was 0.47 mm/s, and the limit of agreement is -0.14 to 1.09 mm/s. Majority (16 out of 18) of the mean difference between the two values of linear velocities was within the limit of agreement. The plot clearly showed a random nature of the spread with zero bias line and confirmed that there was no systemic bias in method agreement (Fig. 4D).
As for the next step, we evaluated the validity of measuring angular velocity of a rotating object, representing the epiglottis movement. The Pearson correlation coefficient was 0.998 (p<0.001) (Fig. 4E), which indicates a high degree of correlation. The mean difference between the reference and measured values of the angular velocity was 1.40 degree/s. The limit of agreement is -1.02 to 3.81 degree/s. The majority (11 out of 18) of the mean difference between the two values of linear velocities were within the limit of agreement (Fig. 4F). The correlation and agreement was consistently high at the tested range of linear and angular velocities. Table 1 summarizes all the results of our experiment.
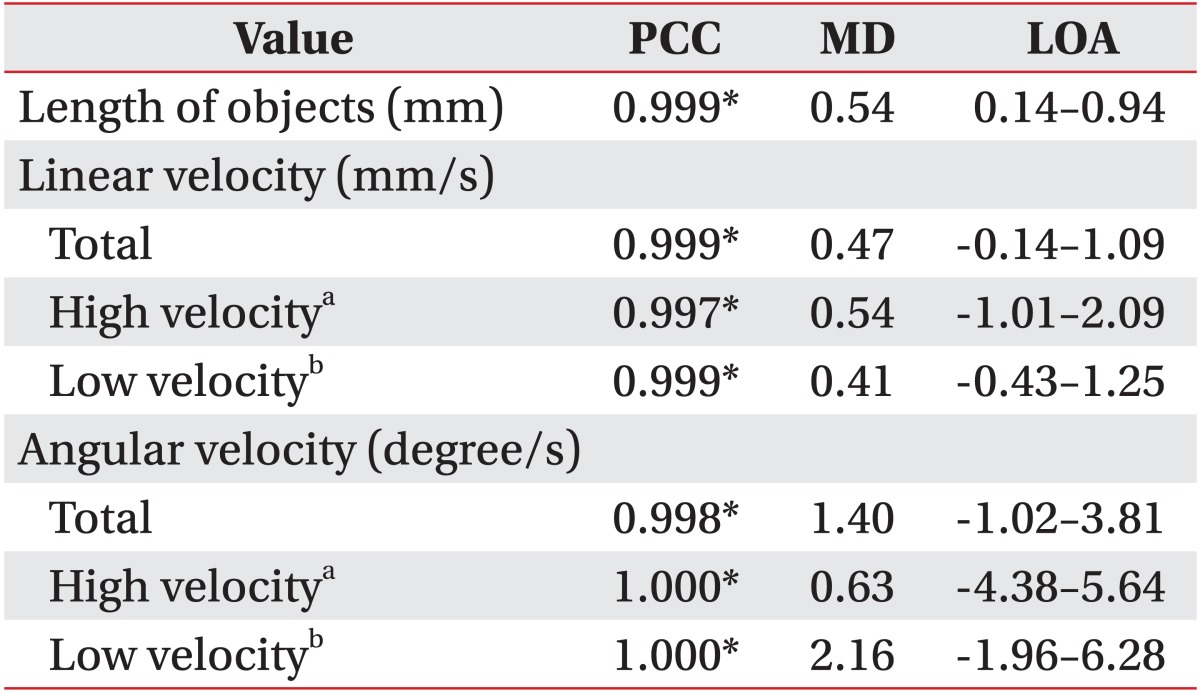
Technical validity of the length of objects, the linear velocity of the hyoid bone and the angular velocity of the epiglottis measured by swallowing Kinematic analysis, respectively: a comparison of the reference with the measured values
DISCUSSION
Both accuracy and reliability are essential prerequisites for a research outcome measure. The results of the present study indicate that the distances and velocities measured by the same technique of swallowing kinematic analysis are accurate at a wide range. This is an important demonstration, especially, in that it is the first report on its validity, namely accuracy. These findings, together with the reliability study by Kendall et al. [15] and Wang et al. [4] corroborate that the swallowing kinematic analysis can safely be employed as the outcome measures in research.
In a clinical situation, the interpretation of MBS is primarily a task that is based on the clinician's judgment. Because of the success of efforts to raise the reliability of the interpretation even when carried out by subjective rating, the level of confidence for the method is generally acceptable. However, there are ambiguous cases that can be difficult to judge, such as cases of subtle penetration or silent aspiration [16], or with a certain degree of impaired movement [15]. Due to such difficulties, efforts have been made to confirm the objective status through a kinematic analysis [7,8,17-21]. Although swallowing kinematic analysis is a laborious process, it was expected to enable a more detailed quantitative analysis. There are various different techniques for kinematic analysis [22,23], and there are some studies which have attempted to evaluate the reliability of kinematic analysis [4,15]. However, as we mentioned above, there was no study for the accuracy of swallowing kinematic analysis.
Typically, images taken from a fluoroscopy pass through a number of steps, such as conversion to a digital movie file, trimming, digitizing the locations of specific anatomical structures, and generating and filtering the binary data files. Because every step of the above mentioned process is potentially error-prone, we made an effort to minimize errors. At first, we corrected image distortion, which occurs during frame-grabbing, then normalized the results into millimeter. Finally, we calculated the coordinates of each point in the newly defined axes. The high correlation and agreement between the reference and measured values proved robustly that all these analysis processes yield accurate results.
Although a high correlation coefficient indicates a strong relationship between the two variables, it does not automatically imply that there is a good agreement. In this regard, additional analysis using a Bland-Altman plot clearly demonstrated the conformity of the measurements.
Another issue is related to the rate of image processing, because a kind of aliasing phenomenon can occur in analyzing a very fast movement with low processing rate. The linear and angular movements of swallowing, a kind of analog signal, were converted to a digital signal at discrete equal time intervals, which is equivalent to "sampling" in the signal processing. According to the Nyquist sampling rule, the frequency of sampling should be at least twice the maximal frequency of the signal to avert the "aliasing phenomenon". The Nyquist frequency of the analyzing tool is 5-15 Hz, because the sampling frequency in the kinematic analysis is usually 10-30 frames per second. Because the angular velocities from 0 to 95 rpm were covered in this study, which is much slower than 5-15 Hz (300-900 rpm), the aliasing phenomenon is less likely to occur, theoretically. Though the angular velocity faster than 100 rpm was not evaluated in this study, the Bland-Altman plot showed quite constant mean differences as the velocity increases up to 95 rpm (Fig. 4F). Unfortunately, physiological angular velocity of the epiglottic retroflexion has not been thoroughly evaluated in the literature.
In summary, the measurement of fast linear and rotational movement by swallowing kinematic analysis shows an excellent level of accuracy at a wide range. However, there is a limitation that the instrumental model is not identical to the real swallowing apparatus. In a swallowing process, although the movement of the hyoid and epiglottis is critical, other structures, such as tongue and vocal fold, have its own roles and it is clinically meaningful. Therefore, we need to develop more precise instrumental model for swallowing to valid whole kinematic analysis of VFSS.
ACKNOWLEDGMENTS
This study was supported by a grant from the Korean Geriatrics Society (2008). The society had no involvement in the study design, data collection, analysis and interpretation, writing of this manuscript, or decision to submit the manuscript for publication.
Notes
No potential conflict of interest relevant to this article was reported.