Proteomic Changes in Rat Gastrocnemius Muscle After Botulinum Toxin A Injection
Article information
Abstract
Objective
To observe the changes in protein expression induced by botulinum toxin A (BoNT-A) injection and to characterize the molecular and cellular action of mechanisms of BoNT-A injection on skeletal muscles using proteomic elements as biomarkers.
Methods
BoNT-A was injected into left gastrocnemius muscles of 12 Sprague-Dawley rats (2 months of age) at a dosage of 5 units/kg body weight. For the controls same volume of normal saline was injected to right gastrocnemius muscle of each rat. Muscle samples were obtained at 4 time points (3 rats per time point): 3, 7, 14, and 56 day post-injection. To reveal the alterations in muscle protein, we performed 2-dimensional electrophoresis (2DE) and compared Botox group and normal saline group at each time point. Altered protein spots in 2DE were identified using matrix-assisted laser desorption/ionization-time-of-flight mass spectrometer (MALDI-TOF MS) proteomics analysis.
Results
Compared with normal saline group, 46 protein spots showed changed protein expression. Twelve protein spots demonstrated increased volume and 34 protein spots demonstrated decreased volume. Among spots of decreased volume, 17 spots showed statistically significant differences. Thirty-eight identified proteins were associated with alterations in energy metabolism, muscle contractile function, transcription, translation, cell proliferation, and cellular stress response.
Conclusion
BoNT-A gives influences on muscle contractile function and energy metabolism directly or indirectly besides neurotoxic effects. Proteomic expression provides better understanding about the effect of BoNT-A on skeletal muscle.
INTRODUCTION
Botulinum toxin A (BoNT-A) has been used to manage various skeletal muscle spasticity associated with central nervous system lesion, as well as other neuromuscular diseases such as torticollis, blepharospasm, and spasmodic dysphonia [1-3]. This potent agent induces muscle paresis or paralysis by entering neurons and disrupting acetylcholine (ACh) release into the neuromuscular junction [4].
In the field of physical medicine and rehabilitation, Das and Park [5] first used BoNT-A for treating spasticity and BoNT-A injection into gastrocnemius muscles is the most commonly performed medical intervention for patients with gait disturbance as a result of cerebral palsy, hemiplegia, or spinal cord injury [6,7]. This form of treatment is successful in alleviating muscle tone abnormalities temporarily; however, for many central nervous system (CNS) disorders, it does not provide a cure. Therefore, BoNT therapy must be readministered periodically. The mechanisms of action of BoNT in the neuron and its effect on ACh release at the neuromuscular junction are generally understood [4]; however, relatively little is known about the effects of therapeutic BoNT injection on the cellular and molecular properties of the target muscle itself.
Recently, proteomic analysis has been considered as a new technology to provide new information about thousands of genes and proteins [8]. Previous work about rat intrinsic laryngeal muscle by Welham et al. [9] has demonstrated increased acute and chronic cellular mitotic activity following BoNT injection, suggesting that BoNT induces a proliferative response in muscle tissue. However, proteomic change in the gastrocnemius muscle, which occurs most commonly as an injection in the field of rehabilitation, has not been researched.
The aim of the present study is to observe the changes in protein expression induced by BoNT-A intramuscular injection. As biomarkers, proteomic elements will characterize the molecular and cellular mechanisms leading to denervation, neuromuscular junction regeneration, and recovery of skeletal muscle function after BoNT-A injection.
MATERIALS AND METHODS
BoNT injection and sample collection
In this study, 12 male, Sprague-Dawley rats of 2-month-old age, weighing 380-420 g were used. Vials of type A botulinum toxin Botox (Allergan Inc., Irvine, KY, USA) were reconstituted with the instillation of 2 mL of normal saline solution in a 100 unit vial (50 units/mL). The toxin was injected into the left gastrocnemius muscles at a dosage of 5 units/kg body weight. An equivalent volume of normal saline was injected into the right gastrocnemius muscles for control data. Muscle samples of both gastrocnemius were obtained at 4 time points (3 rats per time point): 3, 7, 14, and 56 day post-injection.
Histologic sample preparation
Tissue samples were cut into small pieces and rapidly fixed in 2.5% glutaraldehyde solution, then fixed in 1% osmium tetroxide again. After rinsing with phosphate buffer (pH 7.4), samples were dehydrated in a graded series of ethylalcohol, immersed in propylene oxide, and embedded in epoxy resin. The sections were stained with toluidine blue and examined under a light microscope. Thin sections from representative areas were stained with uranyl acetate and lead citrate for electron microscopy. A transmission electron microscope JEM-1200EX (JEOL Ltd., Tokyo, Japan) was used to view thin sections.
Protein sample preparation
Materials used in this study were urea, thiourea, 3-[(3-cholamidopropyl)dimethylammonio]-1-propanesulfonate (CHAPS), dithiothreitol (DTT), benzamidine, Bradford solution, Acrylamide, iodoacetamide, bis-acrylamide, SDS, acetonitrile, trifluoroacetic acid, and α-cyano-4-hydroxycinnamic acid nitrogen, purchased from Sigma-Aldrich Korea. Pharmalyte (pH 3.5-10) was from Amersham Biosciences (Amersham Biosciences, Incheon, Korea) and IPG DryStrips (pH 4-10 NL, 24 cm) were from Genome Inc. (Genome Inc., Pohang, Korea). Modified porcine trypsin (sequencing grade) was from Promega (Promega Corporation, Madison, WI, USA).
Sampled muscle tissue pellets were washed twice with ice-cold PBS (in molecular cloning) and sonicated for 10 seconds by Sonoplus (Bandelin Electronic, Berlin, Germany). They were homogenized directly by motor-driven homogenizer PowerGen125 (Fisher Scientific, Hampton, NH, USA) in sample lysis solution composed with 7 M urea, 2 M thiourea containing 4% (w/v) CHAPS, 1% (w/v) DTT, and 2% (v/v) pharmalyte, and 1 mM benzamidine. Proteins were extracted for one hour at room temperature with vortexing. After centrifugation at 15,000×g for one hour at 15℃, insoluble material was discarded and the soluble fraction was used for two-dimensional (2D) gel electrophoresis. Protein loading was normalized by Bradford assay [10].
Two-dimensional electrophoresis
IPG dry strips were equilibrated for 12-16 hours with 7 M urea, 2 M thiourea containing 2% CHAPS, 1% DTT, 1% pharmalyte, and respectively loaded with 200 µg of sample. Isoelectric focusing (IEF) was performed at 20℃ using a Multiphor II electrophoresis unit (PerkinElmer, Waltham, MA, USA) and EPS 3500XL power supply (Amersham Biosciences) following manufacturer's instruction. For IEF, the voltage was linearly increased from 150 to 3,500 V during 3 hours for sample entry followed by constant 3,500 V with focusing complete after 96 kVh. Prior to the second dimension, strips were incubated for 10 minutes in equilibration buffer (50 mM Tris-Cl, pH 6.8 containing 6 M urea, 2% SDS and 30% glycerol), first with 1% DTT and second with 2.5% iodoacetamide. Equilibrated strips were inserted onto SDS-PAGE gels (20×24 cm, 10%-16%). SDS-PAGE was performed using Hoefer DALT 2D system (Amersham Biosciences) following manufacturer's instruction. 2D gels were run and 20℃ for 1,700 Vh. And then 2D gels were silver stained for image analysis.
Gel image analysis
Quantitative analysis of digitized images was carried out using the PDQuest ver. 7.0 (Bio-Rad, Hercules, CA, USA) software according to the protocols provided by the manufacturer. Quantity of each spot was normalized by total valid spot intensity. Protein spots were selected if they demonstrated significant expression variation that deviated over 1.5-fold in its expression level compared with control or normal samples.
Protein identification by mass spectrometer
For MS fingerprinting, the stained portions of the 2D gels were excised and then digested with trypsin. Isolated protein spots were destained with 100 mM sodium thiosulfate and 30 mM potassium ferricyanide. After washing with 50% acetonitrile (AcN), the gel fragments were dried in a vacuum centrifuge. The dried gel fragments were rehydrated in 20 mL of 25 mM NH4HCO3 containing 0.6 mg of sequencing-grade trypsin (Promega), and incubated overnight at 37℃. The remaining peptides were extracted twice with 30 mL of a 50 mM NH4HCO3:AcN (1:1) mixture. The extracts were evaporated in a vacuum centrifuge for further drying. Aliquots of the peptide-containing samples were applied to a target disk and left to evaporate. Spectra were obtained using a Voyager-DE PRO MALDI-MS (Applied Biosystems, Foster City, CA, USA). Protein databases were searched with MASCOT using monoisotopic peaks. A mass tolerance within 50 ppm was allowed initially, after which recalibration was performed using the list of proteins obtained with a tolerance of 20 ppm.
Statistical analysis
Independent t-test was used to compare differences between normal saline group and BoNT group. A probability value of less than 0.05 was considered statistically significant. Statistical analysis was carried out using the SPSS ver. 13.0 (SPSS Inc., Chicago, IL, USA) program.
RESULTS
Morphology of muscle structures
Under light microscopy, necrosis of myofibers and small vacuoles among muscle fibers were observed from day 3 after BoNT injection. Atrophy of muscle fibers was detected significantly at day 14 and at day 56 diameter and width of muscle fibers in Botox group were significantly decreased compared with control group (Fig. 1). At day 56, Z-lines of muscle fibers were not observable under light microscopy due to severe atrophy. The most characteristic finding in the ultrastructure of neuromuscular junction was vacuole formation (Fig. 2). Electron micrograph at day 56 after injection showed destructed postsynaptic membranes and several vacuoles between muscle fibers or at axon terminals.

Histologic findings of sampled muscles. (A) No diagnostic abnormalities were seen in the control group at day 56. (B) Myofibers are markedly atrophied and several vacuoles in myofibers (arrow) were shown at day 56 after injection of botulinum toxin (H&E, ×400).

Electron microscopy of muscle sample at 56th day after botulinum toxin injection showed several vacuoles in the sarcoplasm (×15,000).
Changes in protein spots
Forty-six protein spots demonstrated different spot volume at least at one time point of experiment compared with protein spots gained after normal saline injection (Fig. 3). Among the 46 protein spots, 12 spots showed increased volume at a certain time point and showed decreased volume at other time points. There were 34 protein spots that showed decreased volume. Examples of increased or decreased spot volume are as shown in Fig. 4. Twelve proteins, which showed increased volume, were also observed to have decreased before or after the increment. The time points of volume changes were various and no protein showed increased or decreased pattern constantly at every time point of the experiment.

Master map of rat gastrocnemius muscle proteins analyzed by 2-dimensional electrophoresis; 46 changed spots are marked with numbers.

Enlarged 2-dimensional electrophoresis images showing over- or under-expression of proteins after botulinum toxin injection. (A) Under-expression of protein spot 3610 on day 3. (B) Over-expression of protein spot 4004 on day 3. CON, control group; BT, botulinum toxin A group.
Protein identification
MALDI-MS and database searching results are summarized in Table 1. Protein species were successfully identified in 38 of the 46 samples.
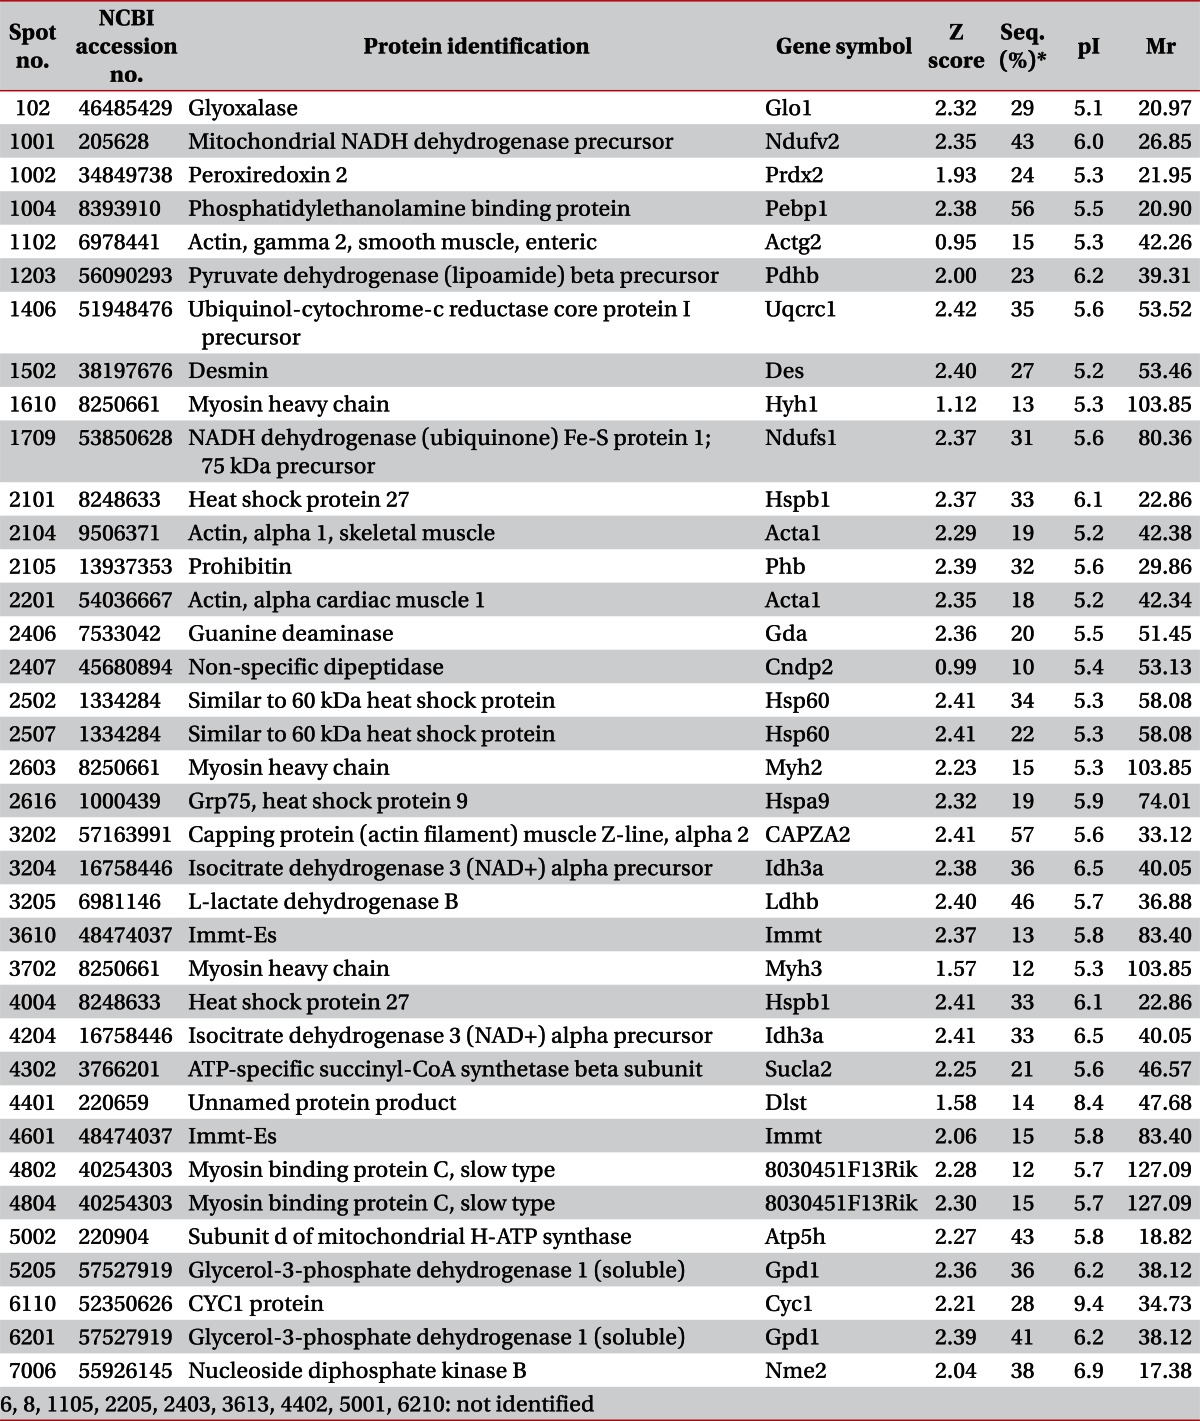
Mass spectrometry data of identified proteins
Statistical significance
Changes in 16 cases were statistically significant. Actual differences of spot volume which have statistically significant values were described in Table 2. An additional 30 protein spots that did not show statistically significant change were listed in Table 3.
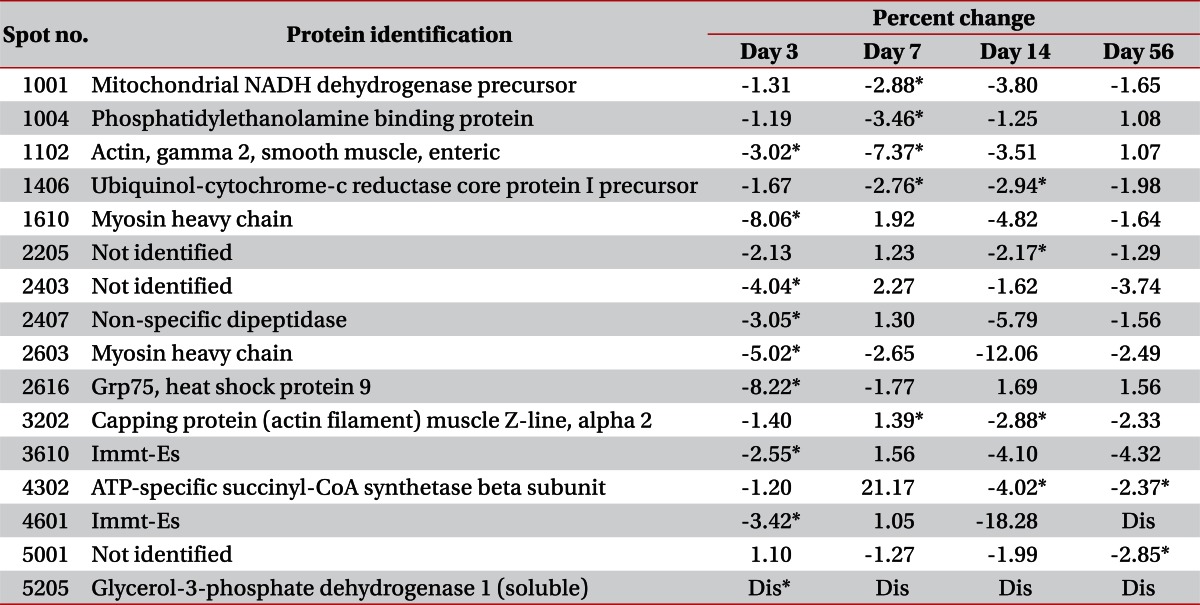
Summary of changes in protein abundance level for 16 protein spots in statistically significant group
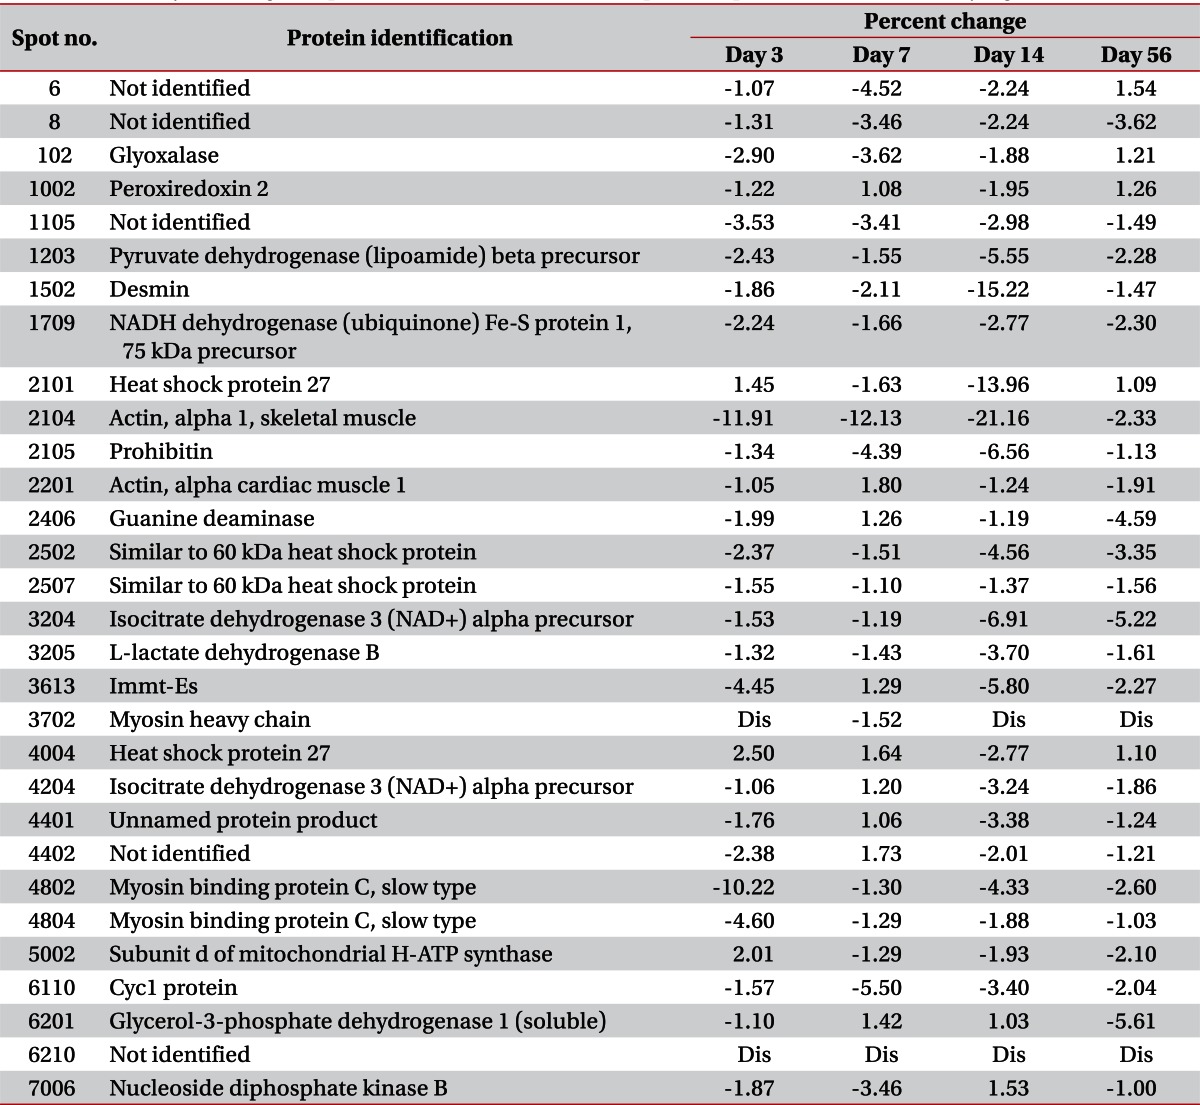
Summary of changes in protein abundance level for 30 protein spots without statistically significance
On day 3, there were no protein spots that showed statistically significant differences. All of the protein spots were observed to be decreased in volume. Among them, 3 protein spots were identified as myofilaments and one protein was related to stress response. One spot was related to amino acid metabolism. Others were not identified as a specific protein or their functions were not researched. On day 7, 4 protein spots showed statistically significant decrement. One was smooth muscle γ2-actin and others were related to energy metabolism. On day 14, 3 protein spots were identified among 4 spots of statistically significant decrement: capping protein muscle Z-line, ubiquinol-cytochrome-c reductase core protein 1 precursor, and ATP-specific succinyl-CoA synthetase. On day 56, only 3 protein spots showed statistically significant decrement, and one of them was identified to have function related to energy metabolism.
DISCUSSION
This study is the first research to examine changes in the rat gastrocnemius muscle proteome following chemodenervation by BoNT injection. In this analysis, we observed quantitative differences in the level of 46 proteins, and 38 proteins protein spots were identified as specific protein species.
To understand the mechanisms of action of BoNT injection many different methods of research had been accomplished. For evaluation of histological change, muscle fibers and neuromuscular junction morphology were observed by light microscopy or electron microscopy [11]. In addition, immunocytochemistry was adapted to prove influences of BoNT on gene expression or molecular changes [12]. Some researchers have noted that electrophysiologic evaluation can measure the effects of BoNT on target muscles [13]. The most easily adaptable method in the clinical field is to measure joint motion or muscle spasticity. This research was focused on gross clinical phenomena or structural changes in neuromuscular junction.
MS-based proteomics, which is increasingly used to acquire the data approaching proteins, has been recently applied to research the effects of BoNT on the molecular level. Proteomics can be used to derive the protein composition of the cell, and to determine the members of proteins complexes, their architecture, and the dynamic of these processes [14]. Among different possible approaches to study proteins, MS-based proteomics is performed without purification of samples and can spread out all protein components included in samples other than a few specific proteins traced. In this manner, entire differences in cellular composition can be revealed, quantitatively as well as qualitatively, under changing conditions.
Thirty-eight proteins identified by MALDIS-MS in this study could be divided into 6 major functional categories by researching the database: contractile function, energy metabolism, cell transcription and translation, cell proliferation, stress response, and miscellaneous.
Proteins related to muscle contractile function were mostly myofilaments: myosin heavy chain, myosin binding protein c, skeletal α-actin, cardiac α-actin, and smooth muscle γ-actin. Myosin heavy chain, identified in 3 spots locations, showed decreased volume at day 3 with statistical significance. Myosin binding protein c was identified in the location of 2 spots, but the decreased volume was not statistically significant. Skeletal muscle α-actin was consistently found with decreased volume at every time point post-injection, but cardiac muscle α-actin showed increased volume at day 3 and decreased volume at days 14 and 56. Previous reports about denervated and aged rat skeletal muscle had the same result of decreased α-actin abundance [15-17]. In contrast, Welham et al. [9] reported increased α-actin abundance in rat thyroarytenoid muscle. Smooth muscle γ2-actin was observed with decreased volume at days 3 and 7; this finding was statistically significance.
Among metabolic enzymes, 2 glycolytic enzymes, glycerol-3-phosphate dehydrogenase 1 and glyoxalase, were identified and revealed downregulation. These proteins are ubiquitous in normal skeletal muscle [18] and their gel presentation suggests the possibility of a targeted degradation process, such as oxidative stress or a BoNT-A-induced muscle trauma [9]. Glycerol-3-phosphate dehydrogenase was reported to be down-regulated in aging rat skeletal muscle [16]. One protein, ubiquinol-cytochrome-c reductase core protein 1 precursor, was related to proteolysis and showed decreased abundance at days 7 and 14; this finding was statistically significant. Three proteins, phosphatidylethanolamine binding protein, mitochondrial NADH dehydrogenase precursor, and ATP-specific succinyl-CoA synthase beta subunit showed statistical significant change after injection. Phosphatidylethanolamine binding protein and mitochondrial NADH dehydrogenase precursor were decreased on day 7, and ATP-specific succinyl-CoA synthase beta subunit was decreased on days 14 and 56. Latter 2 synthase are proteins acting in energy metabolism process and decreased significantly when loss of muscle mass was maximized as a result of atrophy. At that time, a large decrement in muscle power was also observed during clinical evaluation. Unlike other previous studies about proteomics in aging muscle [16] or in denervated muscle [17,19,20], β-enolase was not identified in this study.
Two identified proteins hold functions related to gene transcription and protein translation. Prohibitin, which demonstrated decreased spot abundance at days 3, 7, and 14 following BoNT-A injection, functions to inhibit DNA synthesis and cell proliferation, and also appears to play a role in transcriptional regulation within the cell [21]. In contrast, Welham et al. [9] reported prohibitin was up-regulated at all-time point of post-injection at rat thyroarytenoid muscle. Another protein related to cell transcription was guanine deaminase, which showed under-expression at days 3 and 56. Other research about aging rat skeletal muscle by Piec et al. [16] reported that increased molecular weight in aging muscle.
Desmin is a cytoskeleton protein acting as a negative inhibitor of filament assembly. Although desmin increases with aging process in general [16] in this study, decreased volumes were observed on days 7 and 14. This difference reflects that in case of atrophy induced by BoNT-A injection proliferation process occurs simultaneously to compensate the muscle loss, contrasting with aged muscle atrophy.
Three proteins identified in this study indicate the presence of a cellular stress response following BoNT-A injection. Peroxiredoxin-2, antioxidant enzyme that functions to catalyze peroxides [22], demonstrated reduced spot aboundance at 14 day post-injection. This result is identical to previous study to rat thyroarytenoid muscle [9]. Heat shock protein 27 was identified in 2 protein spots. Like previous study to rat thyroarytenoid muscle [9], heat shock protein showed increased expression at days 3 and 7, and then decreased at day 14. Heat shock protein was also reported to be up-regulated in aging rat skeletal muscle [16]. Another protein related to stress response was isocitrate dehydrogenase 3 (NAD+) alpha precursor, which is known to play an antioxidant role under oxidative stress through NADPH regeneration. This protein was observed in decreased volume at days 14 and 56. All proteins related with stress response identified in this study showed similar pattern of changes, increased at day 7 and decreased at day 14, which can be interpreted that stress response reaches at top around day 7 after injection and then declines.
Protein spot 2616 was identified as Grp75 and showed decreased abundance at day 3 with statistical significance. Immt-Es was identified from protein spot 3610 and the volume was decreased at days 3 and 14. Unnamed protein products were also identified from spots 2502 and 2507.
As mentioned previously, key mechanism of BoNT is disrupting ACh release into neuromuscular junction. In this study, proteomic changes after BoNT-A injection were revealed but those changes may not be a definite result of BoNT-A because denervation itself can cause the alteration in muscular structure. Also, as verified in histologic findings, BoNT-A injection increased the ratio of connective tissue to muscle fibers. Increased connective tissue volume could give influence to proteomic expression. So it is more appropriate to conclude that proteomic changes in this study can reflect the molecular change both directly or indirectly induced by BoNT-A injection.
In conclusion, the proteomic changes observed in this study reflect a series of coordinated functional processes involving alterations in muscle contractile function, energy metabolism, cell transcription and translation, cell proliferation, and stress response. These findings reinforce that proteomic expression provides better understanding about the direct or indirect influences of BoNT-A on skeletal muscles.
Proteomics research is progressing rapidly and contributing greatly to crucial biological findings in a variety of areas. Further research is needed to extend proteome mapping and individual protein species identification for not only BoNT injection, but for other antispasmodic agents such as alcohol or phenol to reveal the differences among them.
ACKNOWLEDGMENTS
This work was supported by Grant from Inje University, 2008.
Notes
No potential conflict of interest relevant to this article was reported.