Corticospinal Tract and Pontocerebellar Fiber of Central Pontine Myelinolysis
Article information
Abstract
Central pontine myelinolysis is a rare neurologic disorder that is defined by demyelination of longitudinally descending tracts and transversly crossing fibers in the basis pontis. Frequently observed clinical manifestations of this disorder include sudden weakness, dysphagia, loss of consciouness and locked-in syndrome. However, there have been a few studies that reported a benign course of this disease, which include cerebellar signs, such as ataxia, intention tremor, and dysarthria. Here we report on a 53-year-old male with a history of liver cirrhosis who showed the cerebellar type of central pontine myelinolysis. The patient was diagnosed with central pontine myelinolysis based on clinical presentations and magnetic resonance imaging findings after a liver transplantation. Conventional magenetic resonance imaging (MRI) revealed the preservation of the corticospinal tract and abnormal pontocerebellar fibers. However, these findings were not sufficient to define the pathophysiology of our patient. Electrophysiologic analysis and diffusion tensor imaging (DTI) were performed to investigate cerebellar signs in this case. Delayed central motor conduction time (CMCT) to the tibialis anterior muscle with transcranial magnetic stimulation (TMS) was observed, which indicated demyelination of the corticospinal tract. Also, diffusion tensor imaging showed abnormal pontocerebellar fibers, which might have been caused by cerebellar dysfunction in our patient. A combination of TMS and DTI was also used to determine the pathophysiology of this disease.
INTRODUCTION
Central pontine myelinolysis can occur during liver transplantation due to a rapid correction of chronic hyponatremia caused by renal insufficiency accompanied by liver cirrhosis. It is one of the most serious central nervous system complications following liver transplantation. This complication results in movement disorders such as loss of consciousness, quadriplegia, dysarthria and dysphagia.1 This disorder can be confirmed based on identification of hyperintensity in the central pontine area by conventional MRI. However, the prognosis of central pontine myelinolysis is not proportional to the early symptoms or to the severity of the radiologic findings, and the prognosis varies.2
In this study, we observed a lesion in the pontocerebellar fiber through diffusion tensor imaging in patients that had mainly cerebellar symptoms, such as cerebellar ataxia, hypotonia and dysarthria. After a long-term follow up post central pontine myelinolysis after liver transplantation and through a transcranial magnetic stimulation study, we reported that central motor conduction time in the corticospinal tract was delayed.
CASE REPORT
The patient in our case was a 53-year-old man who was diagnosed with liver cirrhosis due to hepatitis B. After liver transplantation on July 15, 2007, central pontine myelinolysis was diagnosed on the basis of clinical presentation and magnetic resonance imaging. He visited our clinic to evaluate a gait disturbance in April, 2010. When central pontine myelinolysis occurred in 2005, he went into a coma and was quadriplegia. After recovering from these symptoms, he developed a gait disturbance and displayed a tremor in both hands.
Upon physical examination in April 2010, the upper and lower extremities strength was determined to be 4/5. The results of the nine-hole peg test to assess hand coordination was 108/58 sec (27/25 sec, normative data mean) for the left-/right- sided hand. He had a tendency to fall with or without his eye open in the Rhomberg test. In the cerebellar function tests, such as finger to finger, finger to nose and heel to shin test, he showed dysmetria and went past the target or walked at a non-regular speed, bilaterally. His speech was slurred and dysarthric. His gait was remarkably irregular in terms of his stance and he displayed poor balance, which was indicative of cerebellar ataxia.
Transcranial magnetic stimulation
A transcranial magnetic stimulation was performed using a Magstim 200 stimulator (Magstm, Wales, UK) equipped with a 65 mm figure-eight coil, Medtronic Keypoint® electromyography unit (Medtronic Inc., Skovlunde, Denmark), at a digitization rate of 10 kHz, high-pass filter at 100 Hz, and low-pass filter at 5 kHz. The motor evoked potentials of the first dorsal interosseous muscles of both hands and the tibialis anterior muscles of both legs were recorded simultaneously. TMS mapping over the hand area of each cortex was obtained along a 2 by 2-cm grid at rest. The coil handle pointed backwards and 45° away from the midline.
For each detected MEP, the following parameters were determined; the optimal point defined as the scalp position at which a reproducible muscle response was elicited with the lowest stimulation intensity and the motor threshold at rest (defined as the minimum stimulation intensity that produced at least five MEPs exceeding 50 µV in 10 trials). The stimulation intensity was set at the 110% of the motor threshold.3 Each site was stimulated 4 times, from which the shortest latency and the average peak to peak amplitudes were recorded.
A 60 mm circular stimulating coil was centered over the C7 spinous process level for cervical motor root stimulation and the L5-spinous process level for lumbar motor root stimulation, which was used to obtain the shortest latency and the average peak to peak amplitudes of MEPs. The central motor conduction time is defined as the latency difference between the motor evoked potentials from the first dorsal interosseous and tibialis anterior muscles induced by stimulation of the motor cortex and those evoked by spinal (motor root) stimulation (Fig. 1).

The recordings are the right TA (A) and left TA (B) motor evoked potential responses to the TMS of the motor cortex and those to the TMS of the lumbar motor roots. Each trace consists of four superimposed traces. Longer latencies of bilateral motor evoked potentials in TMS to motor cortex are observed. TMS: Transcranial magnetic stimulation, TA: Tibialis anterior muscle.
The onset latency and CMCT on the first dorsal interosseous muscles of both hands after transcranial magnetic stimulation of the cerebral cortex were in the normal range. However, the onset latency on tibialis anterior after transcranial magnetic stimulation of the cerebral cortex was 40.8/42.1 ms and the CMCT on the tibialis anterior was 27.3/29 ms for the left-/right- sided peaks. The TMS showed delayed latency in the patient when compared to normal subjects (Table 1).
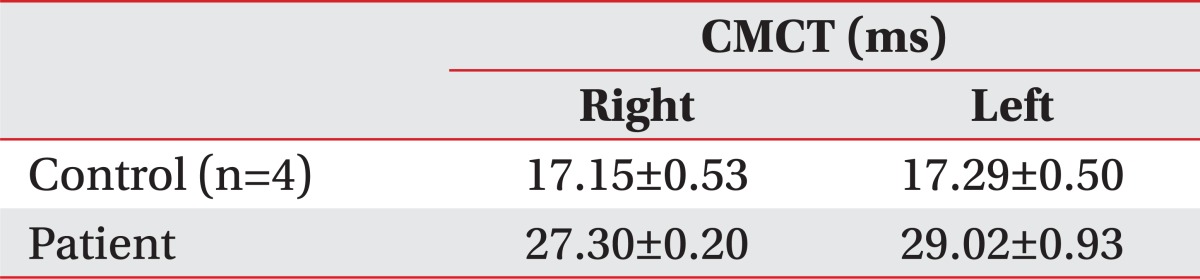
CMCT to the Tibialis Anterior Muscle
Conventional magnetic resonance imaging
At the time of admission to our hospital when the patient was in a coma and was quadriplegia in August 2005, T2-weighted MR images of the brain showed a bilateral symmetrical hyperintense lesion with a spared corticospinal tract at the midbrain and pons. These findings suggested that the central pontine myelinolysis occurred in the midbrain and pons. After 5 years, T2-weighted MR images of the brain showed an oval cavitary lesion at the center of the basis pontis and bilateral symmetrical linear lesions that indicated pontocerebellar fibers (Fig. 2).
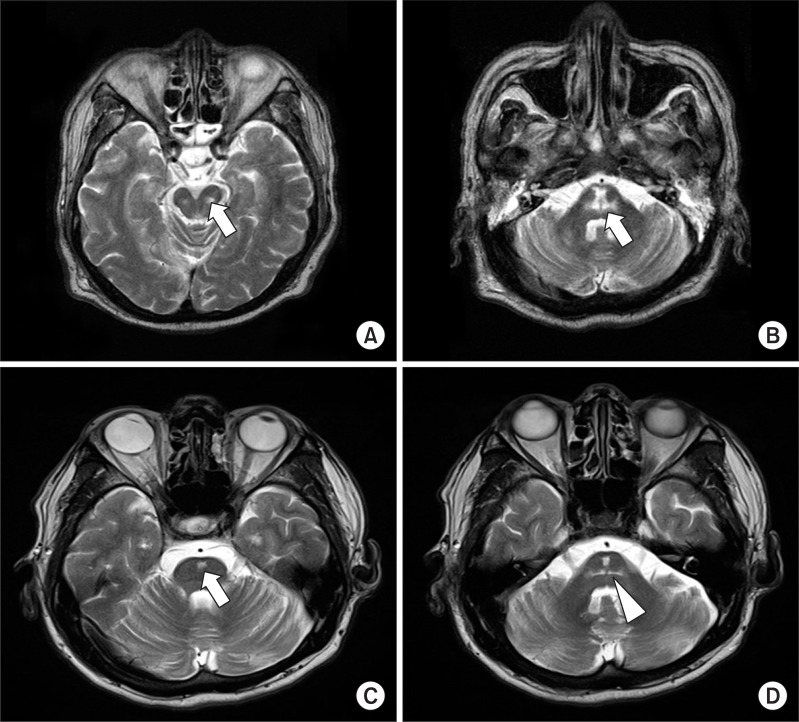
The image of axial fast spin echo T2 -weighted images show a bilateral symmetrical hyperintense lesion (arrow on A, B) with a spared corticospinal tract at the midbrain (A) and pons (B) at onset. After 5 years, an oval cavitary lesion (arrow on C) at the center of the basis pontis was observed. The pons is mildly atrophic, and there are bilateral symmetrical linear lesions (arrowhead on D) that indicate pontocerebellar fibers.
Diffusion tensor imaging
Diffusion tensor images were obtained with a head coil on a 3.0T Siemens Verio scanner (Siemens, Erlangen, Germany) using a single-shot echo planar imaging sequence with two diffusion sensitizing gradients. To reduce the scan time, a Generalized Autocalibrating Partially Parallel Acquisition (GRAPPA) technique, which is a component of the parallel imaging technique, was used. In addition, this technique can produce a higher image quality because it reduces image distortion caused by the echo-planar imaging sequence. To correct for potential image distortion, an automated image registration program was employed. The imaging parameters used were: echo time=105 ms, repetition time=7,000 ms, field of view=200 mm2, matrix size=128×128, number of excitation=2, and b-value=1,000 s/mm2. We acquired 46 contiguous slices parallel to the anterior commissure-posterior commissure line at a slice thickness of 3.0 mm with no gap in 30 different diffusion directions. To evaluate the pontocerebellar fibers, the fractional anisotropy and apparent diffusion coefficient of the bilateral middle cerebellar peduncle (MCP) were measured, and regions of interest were identified on the basis of a previously published fiber tract-based atlas of human white matter anatomy.4 The section level for MCP delineation was chosen at one section posterior to the corticospinal tract in the coronal section, and the MCP was tracked through 2 regions of interest at the left and right of the lateral pontine tegmentum, which was clearly identified on the color map.
The corticospinal tract was preserved based on the blue color in the DTI color maps at a low pons level (Fig. 3). However, the pontocerebellar fiber was found to be abnormal in the DTI based on the decreased fractional anisotropy and increased apparent diffusion coefficient values in the middle cerebellar peduncle when compared to normal subjects, which was indicative of reflected degenerative axonal and/or myelin loss of the pontocerebellar fiber (Table 2, Fig. 3).5
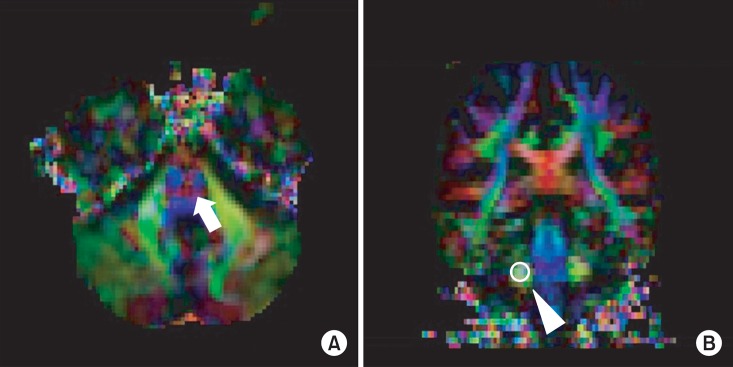
To evaluate the pontocerebellar fiber (arrow on A) in the Diffusion tensor images, Fractional anisotropy and the Apparent diffusion coefficient was measured in a region of interest located on the Middle cerebellar peduncle in the coronal section (arrowhead on B).
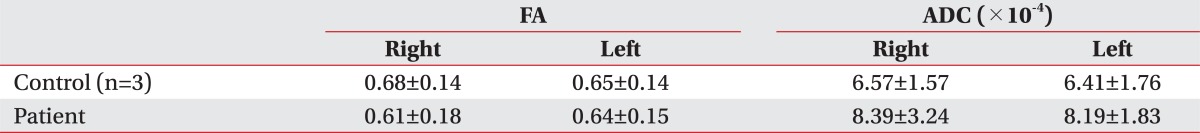
FA and ADC Values of the Middle Cerebellar Peducle of the Patient and Control Subjects
DISCUSSION
In this study, prolongation of the central motor conduction time in the transcranial magnetic stimulation and abnormalities in the pontocerebellar fibers were identified through diffusion tensor imaging in a patient with central pontine myelinolysis that displayed cerebellar symptoms.
In a previous study, a transcranial magnetic stimulation was performed on a patient with central pontine myelinolysis; however no abnormalities in the electrophysiologic analysis were observed.6
The prolongation of central motor conduction time might be caused by the conduction block resulting from demyelination of the corticospinal tract in the electrophysiologic analysis. Central pontine myelinolysis is a symmetric, noninflammatory demyelination on the myelin fibers within the central basis pontis. Microscopic examination identified severe demyelination and loss of oligodendrocytes with relative sparing of axon cylinders and neurons of the pontine nuclei.2 These findings suggest that a conduction block may be the reason for the prolonged central motor conduction time observed in our patient. However, this prolonged central motor conduction time may be correlated with a delayed conduction velocity of the corticospinal tract, which could be caused by remyelination due to the prolonged periods. In addition, we cannot rule out the possibility of neuroplasticity of the corticofugal fibers in the pons, which continue the pedunculopontine nucleus, one of the most important nuclei in locomotion. However, we could not identify the reason for the delay in the central motor conduction time. To explain this phenomenon, electrophysiologic analysis would likely be required at the onset of the disease.
The range of the central motor conduction time in the upper limbs was found to be normal, whereas the delayed central motor conduction time in the lower limbs was found to be abnormal. This might be due to a different topographical arrangement between the upper and lower extremities of the corticospinal tract.7 There have been a few reports on patients with cerebellar symptoms,8,9 and the pathophysiology causing the cerebellar symptoms were not identified. Our patient initially displayed a central pontine myelinolysis combined with a definite extrapontine myelinolysis and no lesions in the cerebellum were observed in the conventional magnetic resonance imaging. Five years after onset of the disease, the cerebellar symptoms of our patient included gait disturbance, eye movement disorder, dysarthria and dysmetria. Cerebellar symptoms in the central pontine myelinolysis had developed and myelinolysis resulted from the cerebellar lesion. Sometimes, even though there may be no definite identifiable lesions in the cerebellar hemispheres, cerebellar symptoms can be caused by the myelinolysis of the pontocerebellar fibers, which pass the basis points to the middle cerebellar peduncle. Because prolonged periods occurred in our case, we also considered the possibilities of Wallerian degeneration of the pontocerebellar tract secondary to central pontine myelinolysis.10
Conventional magnetic resonance imaging revealed a relatively preserved corticospinal tract and the pontocerebellar fibers displayed an abnormal signal intensity. The preservation of the corticospinal tract and the abnormalities of the pontocerebellar fibers were clearly identified in the diffusion tensor imaging based on the decreased fractional anisotropy and increased apparent diffusion coefficient values of the middle cerebellar peduncle, which resulted from degenerative axonal and/or myelin loss of pontocerebellar fibers. In previous studies,8,9 it was assumed that the lesion of the pontocerebellar fibers and the cerebellar signs could be clarified based on diffusion tensor imaging. Thus, identification of abnormalities in pontocerebellar fibers may prove very useful in diagnosing the cerebellar symptoms of other diseases.
In this study, the delayed central motor conduction time (CMCT) to the tibialis anterior was identified with transcranial magnetic stimulation (TMS) and abnormal pontocerebellar fibers were identified using diffusion tensor imaging (DTI) in a patient with central pontine myelinolysis. Based on these findings, we suggest that the combined use of TMS to evaluate neurophysiologic integrity of the corticospinal tract and DTI to visualize subcortical white matter tracts will help one to clarify the pathophysiologic mechanism of the disease and to localize the brain lesion more precisely, which causes the clinical symptoms.