

INTRODUCTION
Although the number of ultra-marathon participants with distances >200 km is continuously increasing, an insufficient amount of research has been reported on the effects of long distance running on cartilage structures and bone metabolism.1 Long distance marathons may have negative effects on cartilage, bone function, and structures and may induce cellular changes such as increased cytokines.2-8 Cartilage oligomeric matrix protein (COMP) is a biochemical marker that is known to indicate cartilage damage.2 Eckstein et al.9 reported that increased exercise loads may lead to patellar cartilage deformation with a greater influence from running than cycling, walking, or squatting since it loads greater pressure on the cartilage.
MacDougall et al.10 reported that track and field athletes may have lower bone mineral contents than non-athletes. Repeated endurance exercise training may negatively influence bone mineral density in athletes. Matsumoto et al.11 reported that the track and field athletes had comparatively lower bone mineral density than other athletes in a study of changes in bone mineral density and metabolism markers. It was also suggested that specific exercise characteristics such as type and intensity may have a greater or differentiated influence on bone changes. It was suggested that a running distance ‚ȧ80-100 km per week may have a positive influence on bone metabolism. On the other hand, running a greater distance than the threshold may negatively influence bone metabolism.12,13
Receptor activator for nuclear factor 66 kB ligand (RANKL), a cytokine for osteoclast differentiation and activation, and osteoprotegerin (OPG), a soluble receptor, were discovered in previous studies.14 Kerschan-Schindle et al.15 reported a significant increase in OPG expression 3 days after a 246-km long term marathon compared to pre-race measures.
Osteocalcin (OC), which is involved in bone calcification, is a marker that reflects the late differentiation stage of osteoblasts.16 Frank et al.17 reported that OC significantly decreased in 4 weeks followed by recovery to pre-exercise concentrations after 8 weeks of exercise intervention using pre-exercise, 4 week, and 8 week OC measurements. In addition, calcium decreased in 4 weeks and then stabilized at the pre-exercise concentration. In contrast, phosphate continuously increased with time.
Studies on bone metabolism were limited to prerace, post-race, and recovery measurements of bone metabolism markers. This particular study observed the changes in biochemical markers at every checkpoint of the 308-km ultra-marathon. Moreover, the degree of cartilage damage was also measured to observe the possible correlations with the distance covered by the runners. The results of this study will be used to recommend an appropriate amount of exercise for ultra-marathoners by analyzing physical limits, bone turnover status, and the degree of cartilage damage.
MATERIALS AND METHODS
Methods
Subjects and exercise protocol
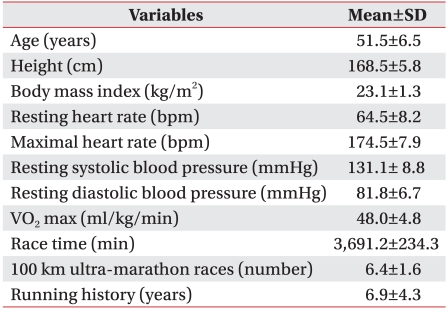
The subjects of the study were male volunteers who participated in a transcontinental ultra-marathon in Korea. The marathon participation criterion was previous completion of one or more ultra-marathon competitions. The purpose and procedure of the study were explained to a total of 160 runners, 60 of whom enrolled. Questionnaires to gather information such as physical characteristics, exercise history, and personal information were completed by the participants after they signed written consent forms. Of the 60 enrollees, 40 were excluded from the study for not completing the race. The remaining 20 participants were selected as the study subjects (Table 1). The maximum arrival time allowed for the 100 km, 200 km, and 308 km checkpoints were 16, 39, and 64 hours, respectively. Of the 40 excluded subjects, 24, 10, and 6 runners dropped out or were eliminated at 0-100 km, 100-200 km, and 200-308 km, respectively. The starting point of the 308-km marathon was the Changhoori wharf of Ganghwa county, which is located on the west coast, while the end point was Kyungpodae Beach, which is located on the east coast of the Korean peninsula. The race began at 10 PM with an ambient temperature of 16.3‚ĄÉ. The minimum and maximum ambient temperatures were 13‚ĄÉ and 31.9‚ĄÉ, the average wind speed was 1.8 m/s, and the relative humidity was 51.9%. Drinking water was provided at all checkpoints in an effort to prevent hemoconcentration. Korean food composed of adequate carbohydrate and protein was provided at 200 km, 250 km, and 308 km. Additional water and nutrients needed by the runners were self-provided during the race.
Blood collection
Blood was collected before the race and at the 100-km, 200-km, and 308-km checkpoints to observe the changes in bone metabolism during the race. Blood was collected from the antecubital vein according to the standard protocol of the Clinical and Laboratory Standard Institute. Blood was first collected, placed in a BD Vacutainer¬ģ Serum Separator 109 tube (Dickinson and Company, Franklin Lakes, USA), and centrifuged for 10 minutes at 3,400 rpm for serum extraction. Calcium and phosphate were immediate analyzed. The remaining samples were stored in a deep freezer at -70‚ĄÉ and later analyzed for COMP, OPG, and OC.
Blood analysis
COMP, a bone metabolism marker, was analyzed using the enzyme linked immunosorbent assay (ELISA) method with a Biovendor R&D kit. OPG and OC were analyzed using the enzyme immunoassay (EIA) method with a Microvue kit (QUIDEL Co., San Diego, USA). Calcium, a biochemical marker for bone metabolism, was analyzed using the OCPC (o-cresolphthalein complexone) method with a Denka Seiken kit (Denka Seiken Co., Tokyo, Japan). Phosphate was analyzed using the phosphomolybdate method with a Raychem kit (Hemagen Diagnostics Inc., San Diego, USA). Biochemical analysis was done using a TBA-200FR Auto analyzer (Toshiba, Tokyo, Japan). All measures were repeated twice by the same analyzer to verify accuracy.
Statistics
All descriptive statistics (mean, SD) obtained from this study were calculated using SPSS/PC 15.0 statistical package for Windows. Repeated analysis of variance measures were applied to observe the changes in hematological variables at the pre-race, 100-km, 200-km, and 308-km checkpoints. The Bonferroni method was applied for post hoc analysis for the results with significant changes. The statistical significance level was set at p<0.05.
RESULTS
Changes in COMP for each checkpoint
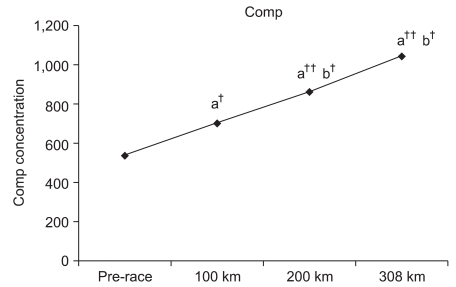
Compared to the pre-race values, COMP at the 100-km, 200-km, and 308-km checkpoints increased by 130.7% (p<0.05), 160.4% (p<0.001), and 194.1% (p<0.001), respectively. Furthermore, COMP values at 200 km and 308 km were significantly increased by 122.7% (p<0.05) and 148.4% (p<0.05) compared to the COMP value at 100 km, respectively. However, a 121.0% increase was observed at 308 km compared to 200 km without significance (Fig. 1).
Changes in OPG for each checkpoint
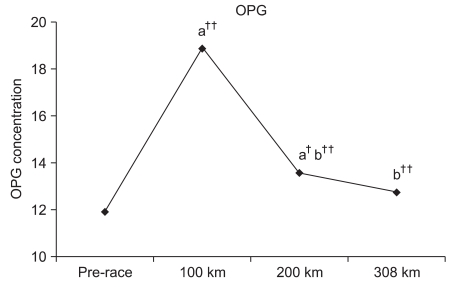
OPG significantly increased by 158.57% (p<0.001) and 114.1% (p<0.01) at 100 km and 200 km compared to the pre-race OPG. However, a significant change was not observed at 308 km with a 106.9% increase. Significant reductions were observed at 200 km and 308 km by 72.0% (p<0.001) and 67.4% (p<0.001) compared to 100 km. An insignificant reduction of 93.7% was observed at 308 km compared to 200 km (Fig. 2).
Changes in OC at each checkpoint
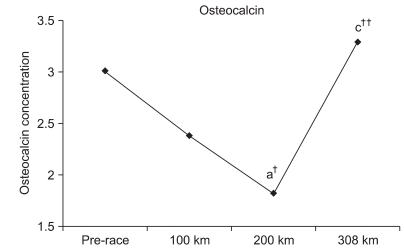
Although OC insignificantly decreased at 100 km by 79.1%, it significantly decreased at 200 km by 60.3% (p<0.05). An insignificant increase of 109.3% was observed at 308 km. Furthermore, an insignificant reduction of 76.2% was observed at 200 km compared to 100 km. An insignificant increase of 138.1% was observed at 308 km compared to 100 km. Finally, a significant increase of 181.3% (p<0.001) was observed at 308 km compared to 200 km (Fig. 3).
Changes in calcium level for each checkpoint
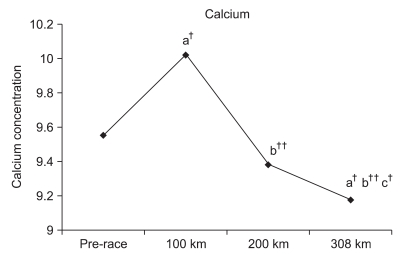
Although the calcium level significantly increased by 104.9 % (p<0.01) at 100 km, the level insignificantly decreased by 98.1% at 200 km. However, the calcium level significantly decreased by 96.0% (p<0.01) at 308 km. Significant reductions of 93.5% (p<0.001) at 200 km and of 91.5% (p<0.001) at 308 km were observed compared to 100 km. A significant reduction of 97.9% (p<0.05) was also observed at 308 km compared to 200 km (Fig. 4).
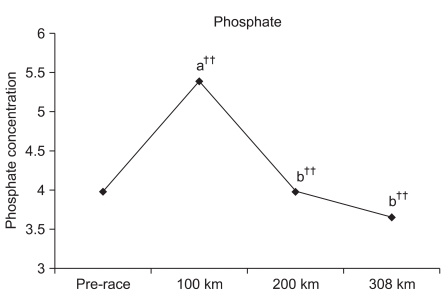
Changes in phosphate level for each checkpoint
Although the phosphate level significantly increased by 135.4% (p<0.001) at 100 km, comparatively no change of 100.0% was observed at 200 km and an insignificant reduction by 92.0 % was observed at 308 km. Significant reductions of 73.8% (p<0.001) and 67.9% (p<0.001) were observed at 200 km and 308 km, respectively, compared to 100 km, respectively. An insignificant reduction of 92.0% was observed at 308 km compared to 200 km (Fig. 5).
DISCUSSION
The number of marathoners is ever-increasing despite extensive research on the risk of cartilage damage in marathon runners.18 COMP is one of the protein components within cartilage that gets released into the system upon cartilage damage for increased activity in the blood. Increased blood COMP levels have been reported in most patients with degenerative or rheumatoid arthritis. Since COMP activity can be measured to predict cartilage damage and arthritis, it has been used as a predictive factor in the diagnosis of the current cartilage state as well as the degree of degeneration and progression.19-21 Neidhart et al.4 reported that COMP levels were increased for at least for 3 weeks in individuals after running events compared to sedentary individuals. They also reported that COMP levels significantly increased upon completion of the marathon. Mundermann et al.3 reported that increases in COMP were observed 30 minutes after walking exercise. Moreover, Kersting et al.2 reported a correlation between COMP concentration and cartilage loss after 1 hour of running. In a study of a 200-km ultra-marathon, Kim et al.1 reported increased COMP concentrations by 1.3-fold at 100 km and 3.0-fold at 200 km. A similar increase of 130.7% at 100 km was also observed in this study. In addition, increases in COMP were observed at 200 km and 300 km by 160.4% and 194.1%, respectively. Such results indicate the possibility of cartilage damage with increased COMP concentration.
Circulating OPG is an important regulating factor in bone metabolism and a decoy receptor of RANKL, a key regulating factor of osteoclast differentiation. OPG is known to block RANKL by stimulating receptor activators of NF-őļB (RANK) located on the surface of osteoclasts.22 Total OPG was measured by including RANKL-bound OPG and free OPG in this study. An increase in total OPG indicated an increase in RANKL-bound OPG. If free OPG levels are adequate, OPG will bind with RANKL without increasing free RANKL levels.15 In addition, excessively increased RANKL may decrease active osteoclasts followed by a reduction in bone loss.15 Kerschan-Schindl et al.15 reported a significant increase in OPG expression upon completion of 246-km long distance running with a reduction tendency 3 days after the race compared to the pre-race OPG. Blood OPG levels were also measured at each checkpoint in this study. OPG significantly increased at 100 km and 200 km without significant changes at 308 km. OPG levels at each checkpoint increased until 100 km and significantly reduced thereafter. Although blood RANKL was not measured for osteoclast activation, Kerschan-Schindl et al.15 reported increased RANKL levels upon completion until 3 days after the race. Based on such results, we estimated that the regulating function of OGP on osteoclasts increased until 100 km, followed by a tendency to decrease toward the 308-km checkpoint. However, an overall increase in OPG compared to pre-race OGP indicated stable maintenance of OPG until the end of the race. Although the discrepancy in results between the two studies is difficult to explain, it has been estimated based on the results that certain critical thresholds in exercise duration and distance exist that either negatively or positively affect bone metabolism according to the distance run.15 Studies have measured such critical running points as being 80-100 km.12,13 However, no other studies have divided the race distance by the checkpoints for specific measurements in threshold distance as in this study.
OC is a non-collagen protein that formed by vitamin K within osteoblasts. It is important for bone metabolism turnover as a biochemical marker of osteogenesis. It is involved in bone mass and quality by combining with calcium for bone formation.23 Research involving marathons and changes in OC measured blood OC before and immediately, 3, 6, and 24 hours after the race for recovery from a 21-km half marathon. Significant increases in OC were observed immediately after the race with a reduction to pre-race level 3 hours into recovery.24 In addition, average 20% and 10% reductions of OC were respectively observed in men and women immediately after the race, with the lowest OC levels observed 1 day after the race.25 In ultra-marathon studies measuring the changes in bone metabolism turnover markers, bone-forming markers such as OC, bone-alkaline phosphatase (b-ALP), type I procollagen C-propeptide (PICP), and calcium concentrations significantly increased. In addition, the carboxyterminal cross-linked telopeptide of type 1 collagen (ICTP), a bone resorption marker, was shown to significantly increase immediately after a 245-km marathon. Changes in OC, b-ALP, PICP, and calcium concentrations have been reported to be related to increase parathyroid hormone (PTH) and cortisol levels.26
OC was also significantly reduced immediately after a 246-km ultra-marathon compared to the pre-race measurement. However, OC significantly increased or recovered to the pre-race concentration 3 days after the race.15 Although a significant change was not observed at 100 km, a reduction tendency was observed. In addition, OC was significantly reduced at 200 km compared to the pre-race values. Significantly increased OC levels at 308 km compared with 200 km recovered to the initial OC concentration.
Frost referred to the phenomenon of mechanical impairment as the mechanostat theory since the exercise loads determine bone metabolism promotion or inhibition. In other words, bone metabolism is not affected by exercise until it reaches certain mechanical load thresholds.27,28 Therefore, although a certain amount of weight-bearing exercise improves bone density, excessive weight-bearing suppresses increases in bone density. Furthermore, MacDougall et al.10 reported that the amount of salt concentration in professional long distance runners is lower than in non-athletes. Moreover, it was further revealed that weight-bearing exercise as the major endurance strengthening exercise can reversely affect bone formation and density.
Other studies on bone metabolism markers reported that exercise loads activated bone metabolism and increased bone metabolism markers. On the other hand, Franck et al.17 reported that weight-bearing exercise training done 2-3 times a week in young subjects led to a significant reduction in OC within 4 weeks, followed by recovery to the previous level in 8 weeks. It was suggested that such adaptation to exercise was due to an increase in PTH release and a decrease in OC production.
In addition, Matsumoto et al.11 reported lower levels of bone metabolism markers in male long distance runners. The possibility of increased bone response to exercise type and intensity over exercise frequency was also highlighted by the authors. Based on numerous studies such as the ones mentioned above, it was estimated that various OC thresholds exist according to the different distance covered by the runners. Bone formation was transiently suppressed by cortisol and PTH. Since studies have shown that RANKL, a marker of osteoclast activities, was continuously increased immediately and 3 days after the race,15 it was estimated that both bone formation and resorption rates increased for higher bone metabolism turnover and increased OC instead of recovering to the pre-race state from 100 km to 308 km.
Bourrin et al.29 reported that a forced increase in exercise load leads to significantly reduced blood calcium and phosphate concentrations. The calcium concentration was significantly decreased compared to the pre-race value. Although statistically insignificant, a decreased tendency of the phosphate concentration was observed. It was suspected that such reductions in calcium and phosphate concentrations during the marathon were caused by an excessive loss of physical strength or an increased exercise load. Such physiological changes along with increased bone metabolism turnover may alter the use of calcium and phosphate as energy sources.
Calcium and phosphate concentrations were measured at each checkpoint unlike the previous ultra-marathon race studies. Significant increases were observed at 100 km compared to the pre-race value. Franck et al.17 indicated an increase in PTH and a decrease in OC concentration during the adaptation stage of the exercise. Therefore, it was estimated that increased PTH and osteoclast activation may have increased calcium resorption through the bones or kidneys at 100 km.
In summary, the possibility of cartilage damage progressively increased for all successive checkpoints. A temporary disassociation phenomenon of bone formation suppression and bone resorption promotion was observed until 200 km. Calcium and phosphate concentrations also increased with OC reduction until the initial 100 km. Increases in PTH and osteoclast activation have been suggested as being the major factors for such changes based on reported studies. It was further estimated that PTH and cortisol may have led to reduced OC and calcium concentrations. It was also suspected that accelerated bone formation and resorption for increased bone metabolism turnover may have recovered OC concentration to the pre-race state from 200 km until the end of the race. The osteoclast regulating ability of OPG was shown to increase until 100 km. Although it may seem to decrease until the end, a certain stable concentration level was continuously maintained with a significant reduction seen at 200 km. Although the regulating ability of osteoclasts by OPG may require further study for clarification, the OPG regulation ability can be explained by different thresholds according to increased exercise loads.
There are several study limitations that must be pointed out for future studies. One of the limitations would be the lack of bone resorption factor, one of the bone metabolism-related factors. To compensate for an absent factor, the results from other studies were referred. Although water was continuously supplied to prevent the influence of increased blood concentration on the studied markers, the possible effect of blood concentration was not verified. A lack of test results on influencing factors such as RANKL, PTH, and cortisol may also be a study limitation. Finally, although the main focus of the study was the changes in bone metabolism markers before, during, and immediately after the race, the changes in these markers at different recovery times should be included in future studies to further clarify the changes in bone metabolism markers.
CONCLUSION
We demonstrated that the possibility of cartilage damage increased as the running distance increased during a 308-km ultra-marathon. The effects on bone metabolism were observed by increased calcium and phosphate as well as decreased OC concentrations at 100 km. Based on the results of various studies including ours, we estimated that PTH may have decreased the OC concentration. Reductions in both OC and calcium concentrations after the 100-km checkpoint were credited to the effects of cortisol and PTH. Increased bone metabolism turnover at 200 km or later has been suggested to recover OC concentration to the pre-race state. The regulating ability of OPG on osteoclast tended to increase until 100 km but decreased thereafter. Despite the reduction in concentration, OPG was significantly increased compared to the pre-race value. Hence, the regulating ability of OPG was partially maintained. Significant reductions at 200 km and thereafter have been explained by reaching the threshold caused by increased exercise loads.