The Effect of Rheological Properties of Foods on Bolus Characteristics After Mastication
Article information
Abstract
Objective
To evaluate the effects of physical properties of foods on the changes of viscosity and mass as well as the particle size distribution after mastication.
Method
Twenty subjects with no masticatory disorders were recruited. Six grams of four solid foods of different textures (banana, tofu, cooked-rice, cookie) were provided, and the viscosity and mass after 10, 20, and 30 cycles of mastication and just before swallowing were measured. The physical properties of foods, such as hardness, cohesiveness, and adhesiveness, were measured with a texture analyzer. Wet sieving and laser diffraction were used to determine the distribution of food particle size.
Results
When we measured the physical characteristics of foods, the cookie was the hardest food, and the banana exhibited marked adhesiveness. Tofu and cooked-rice exhibited a highly cohesive nature. As the number of mastication cycles increased, the masses of all foods were significantly increased (p<0.05), and the viscosity was significantly decreased in the case of banana, tofu, and cooked-rice (p<0.05). The mass and viscosity of all foods were significantly different between the foods after mastication (p<0.05). Analyzing the distribution of the particle size, that of the bolus was different between foods. However, the curves representing the particle size distribution for each food were superimposable for most subjects.
Conclusion
The viscosity and particle size distribution of the bolus were different between solid foods that have different physical properties. Based on this result, the mastication process and food bolus formation were affected by the physical properties of the food.
INTRODUCTION
When considering the physiological aspects, mastication plays a role in changing solid foods into a food bolus that is easier to swallow. Mastication forms a cohesive and lubricated bolus mixed with secreted saliva and liquid food ingredients after being broken into small particles.1-3 This mastication process is controlled by the central pattern generator (CPG) located in the brainstem as well as other phases of swallowing.4 Using numerous sensory information from the oral cavity, the CPG constantly assesses the state of bolus, and judge as to whether the state is safe for swallowing; it then decides whether or not to initiate swallowing.5,6 This means that a certain threshold that triggers swallowing would exist. Various studies have been performed on this swallowing threshold. As a result, it is thought to be related with particle size distribution, cohesiveness, and surface lubrication of the bolus.1,7-15 Also, it is considered that the unique natures of foods, particularly the physical properties, act as stimuli and sensory inputs to the CPG during mastication and other phases of swallowing. Hence, the physical properties of foods affect the mastication process and food degradation, and they are related to food bolus formation, physical properties of bolus, and the act of triggering the swallowing reflex.1,4-10 Thus, many studies have been conducted with different types of solid foods in order to measure the various physical properties of bolus, such as the distribution of particle size, cohesiveness of the bolus, etc., as sensory inputs in the initiation of swallowing; yet, the viscosity has rarely been measured.
Therefore, this study attempts to verify the characteristics of the bolus after mastication through measuring the viscosity and mass changes of the bolus as well as the particle size distribution. Furthermore, it aims to investigate the relations between the bolus characteristics with the rheological properties of solid foods.
MATERIALS AND METHODS
Measurement of physical properties of foods
Banana (Cavendish species), firm tofu, cookie (shortbread fingers) (Walkers Shortbread Ltd., Aberlour, UK), and cooked-rice (CJ Hetbahn) (CJ Cheiljedang Corp., Seoul, Korea) were chosen for this study; all have different individual physical properties of food. Each food was prepared in 6 g with the same cuboid shape. Using a texture analyzer, TA. XTPlus® (Stable Micro Systems Ltd., Surrey, UK) (Fig. 1), we measured the food's adhesiveness, cohesiveness, hardness together with the springiness, chewiness, and gumminess as the secondary variables. The tests were completed in 3 trials of 4 different foods.
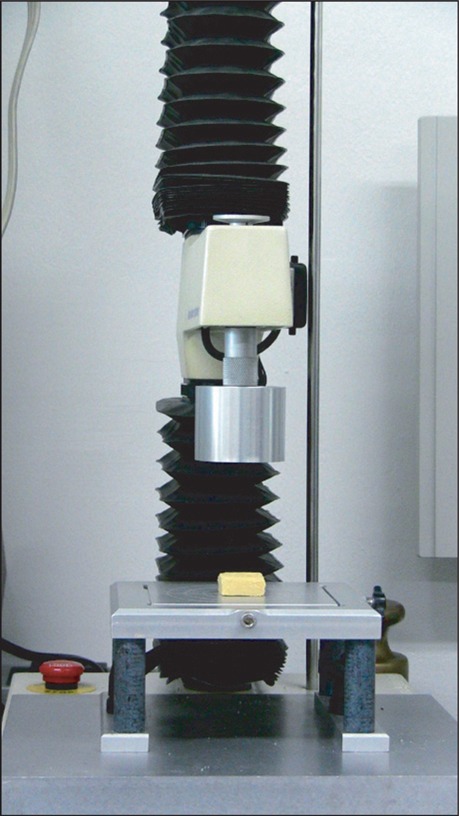
Measurement of physical properties of foods using a texture analyzer, TA. XTPlus® (Stable Micro Systems Ltd., Surrey, UK).
Measurement of food mass and viscosity after mastication
Twenty healthy young adults (8 males, 12 females; median age, 29.4±3.3 years; range, 25.3-36 years) participated in this study. The protocol for this study was approved by the Chung-Ang University Hospital Institutional Review Board. All participants were fully informed of the study and provided their written consent for their participation. Eligibility for participation was based on the participant's medical and dental screenings. The inclusion criteria were those with healthy and complete dentition, no diseases related to mastication, such as malocclusion, and no dental treatments for the past three months.2,16
Each participant completed 8 trials of 4 different foods: 1) 6 g banana (Cavendish species), purchased "just ripe" as needed from a local super market, 2) 6 g firm tofu, 3) 6 g hard cookie (Shortbread fingers) (Walkers Shortbread Ltd., Aberlour, UK), and 4) cooked-rice (CJ Hetbahn) (CJ Cheiljedang Corp., Seoul, Korea). Each of the food items was placed on a plastic teaspoon. The participants were then instructed to take the spoon and self-feed when ready.
Among the eight trials of each food samples, two trials were used for measuring the mass and viscosity after ten cycles of mastication, two trials were used after 20 cycles of mastication, two trials were used after 30 cycles, and the last two trials were measured for mass and viscosity just before swallowing. Before starting this experiment, the subjects were informed of the experimental goals and were asked to masticate normally. Also, 30 minutes prior to the experiments, 300 ml of water was provided to the subjects in order to prevent dehydration and for them to drink as needed during the experiment.
The mass of food as well as that of the bolus was measured using an analytical scale AR2140 (OHAUS Corp., Pine Brook, USA), and the viscosity of the bolus was measured by viscometer SV-10/100® (A&D Co., Tokyo, Japan) (Fig. 2). The measurable range of the viscometer was from 0.3 cP to 12,000 cP.
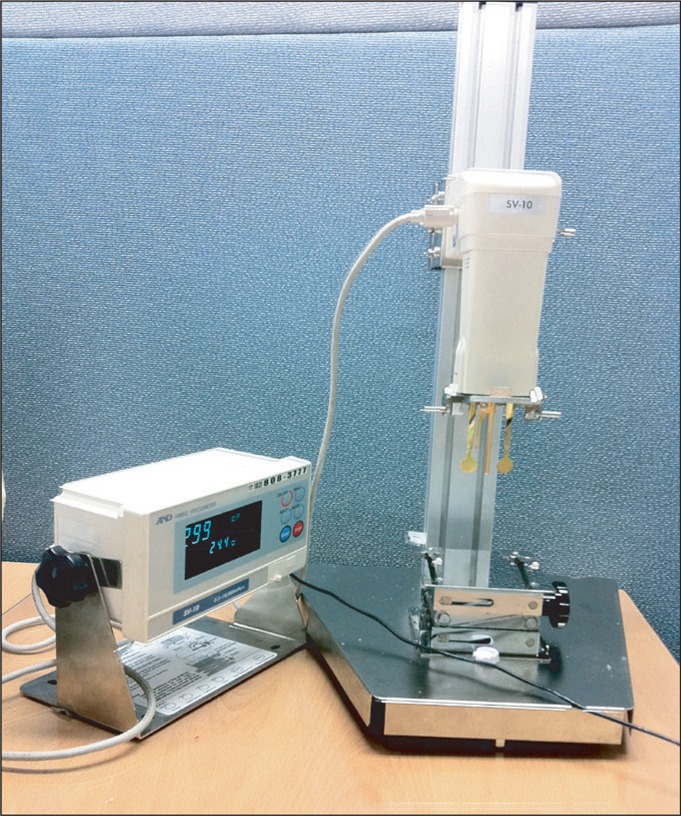
The viscosity of each bolus was measured with a viscometer SV-10/100® (A&D Co., Tokyo, Japan).
Particle size distribution of food boluses after mastication
Two trials of each food, which was collected just before swallowing, were used for analyzing the particle size distribution. Subjects were requested to spit out the food bolus just before swallowing under subjectively by themselves after mastication. The remaining food particles were collected by rinsing the mouth with water and adding them to the spitted bolus. Wet sieving was performed in order to evaluate the distribution of particle size with the gathered samples using the standard sieves of 4 mm, 2 mm, and 1.4 mm apertures. For each of the gathered samples in each sieve, the particle numbers were calculated. Particle size distributions of the sample, after passing through a 1.4 mm standard sieve, were measured using laser diffraction analysis S3500® (Microtrac Inc., Largo, USA) (Fig. 3).
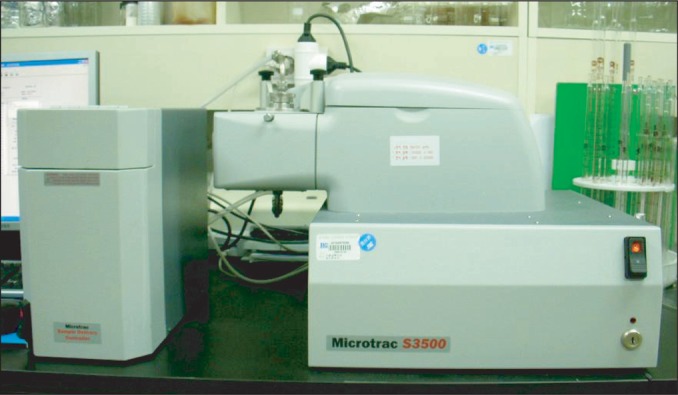
Laser diffraction S3500® (Microtrac Inc., Largo, USA) was used to analyze distributions of particle size in the food boluses.
Statistical analyses
Statistical processing was conducted with PASW 18.0 for Windows. The Mann-Whitney test was used to compare the measured physical properties of each food. In order to compare the mass and viscosity changes for each food after mastication, the study used a one-way ANOVA. The general linear model was performed to analyze the mass and viscosity changes according to the number of mastication cycles. Chi-square with Bonferroni correction was performed in order to compare the particle size distribution categorized according to the sieve aperture between different food types. The result was considered significant if it had a p-value less than 0.05.
RESULTS
Measurement of the physical properties of foods
The results of measuring the physical properties of each food (Table 1) demonstrated that the cookie was the highest in hardness with 21,496.75±3,124.09 g, followed by banana, tofu, and cooked-rice, in that order. Statistically, the hardness of cookie was significantly different from that of the other foods (p<0.05). The greatest cohesiveness was found in tofu with a measurement of 0.65±0.01, followed by banana, cooked-rice, and cookie (p<0.05). In the adhesiveness test, banana was the highest with a value of -199.22±37.62 N, followed by tofu, cooked-rice, and cookie (p<0.05). Tofu was the highest with 0.91±0.32 cm in the springiness test, followed by cooked-rice, banana, and cookie. There were significant differences between foods (p<0.05). The gumminess of tofu and cooked-rice were measured as 108.84±15.55 g and 100.26±47.08 g, and they were significantly different from that of the banana or cookie (p<0.05). The chewiness of cookie was the highest with a value of 1,609.14±966.38 g*cm, followed by banana, tofu, and cooked-rice (p<0.05).

Physical Properties of Foods
Measurement of food mass and viscosity after mastication
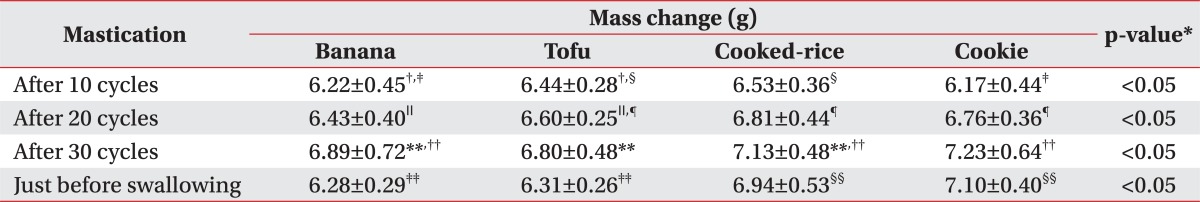
The results of mass changes among foods after mastication showed significant differences (Table 2) (p<0.05). The mass of the bolus after mastication increased with the increment of the number of mastication cycles (Table 3, Fig. 4). In addition, the mass increase was found in all foods, according to the number of mastication cycles (p<0.05); there were also significant differences between the food types (p<0.05).
The Effect of Mastication on Bolus Mass

Mass Changes of the Food According to Number of Mastication Cycles
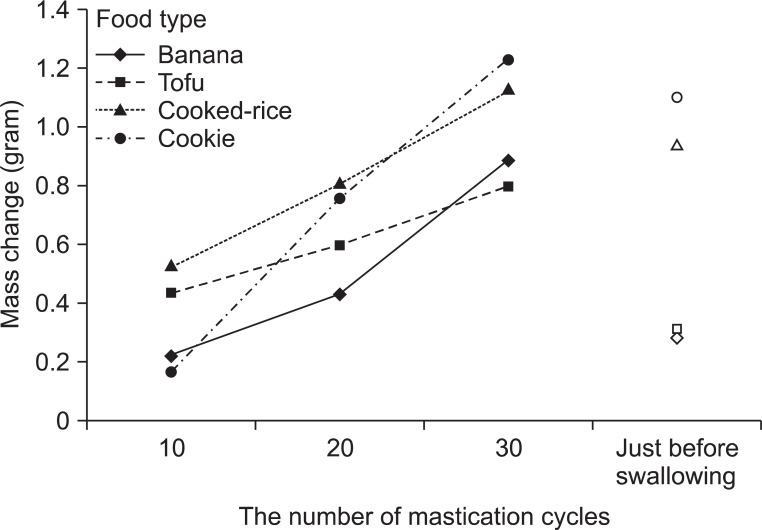
The mass change of the food according to the number of mastication cycles.
Although this study measured the viscosity of foods after mastication, all of the samples of cookie and cooked-rice after ten cycles of mastication, along with 12 samples of tofu, could not be measured because they exceeded 12,000 cP, which is the upper limit of the measurable range of the instrument. Measurements were also impossible for all cookie samples after 20 cycles mastication; six of the cooked-rice samples, three samples of tofu, and 12 samples of cookies after 30 cycles of mastication could not be measured because of the high viscosity. Additionally, viscosity measurements were impossible to perform in 13 samples of tofu and in eight samples of cookies just before swallowing for the same reason as above. All of these data were treated as missing values.
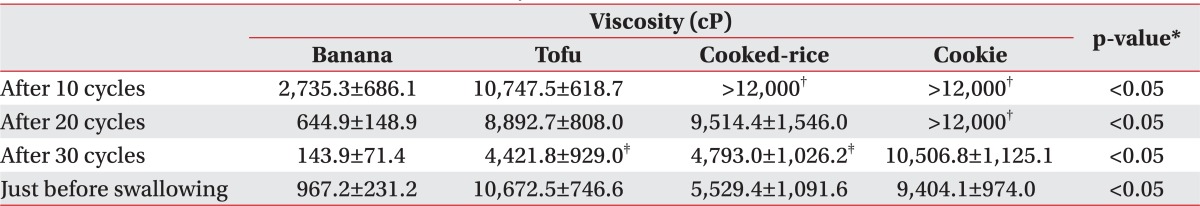
The results of viscosity measurement after ten cycles of mastication displayed significant differences between foods, such as the banana, which was measured as 2,735.3±686.1 cP, and tofu, which was measured as 10,747.5±618.7 cP (Table 4) (p<0.05). The results of viscosity measurements after 20 cycles of mastication also showed significant differences. That of the banana was measured as 644.9±148.9 cP, that of tofu was 8,892.7±808.0 cP, and that of cooked-rice was 9,514.4±1,546.0 cP (p<0.05). After 30 cycles of mastication, the viscosity of banana changed to 143.9±71.4 cP, that of tofu changed to 4,421.8±929.0 cP, that of cooked-rice became 4,793.0±1,026.2 cP, and that of cookie was measured as 10,506.8±1,125.1 cP. There were significant differences between each food (p<0.05), except between the tofu and cooked-rice after masticating 30 cycles (p>0.05). In addition, comparing the viscosities just before swallowing, the banana was measured as 9,404.1±974.0 cP, tofu as 10,672.5±746.6 cP, cooked-rice as 5,529.4±1,091.6 cP, and cookie as 967.2±231.2 cP; significant differences were found among all foods (p<0.05).
The Effect of Mastication on Bolus Viscosity
The results of measuring the viscosity changes according to the number of mastication cycles demonstrated that viscosity decreased as the number of cycles increased in the case of banana, tofu, and cooked-rice (Fig. 5).
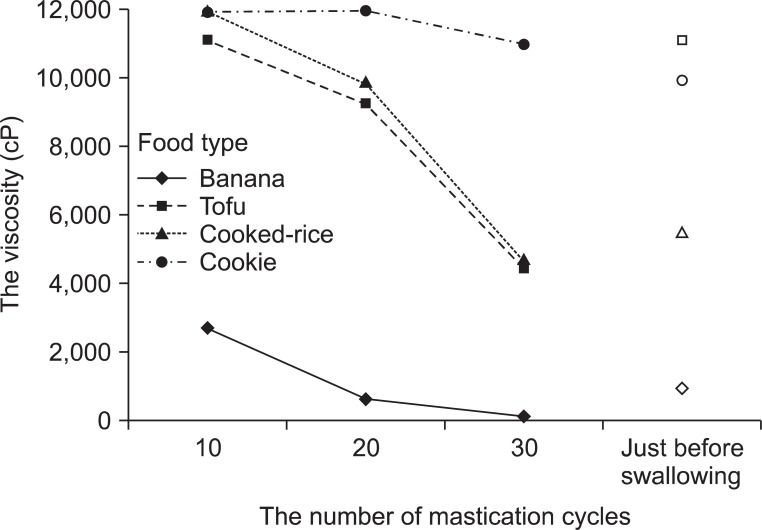
The viscosity change of the food according to the number of mastication cycles. We were unable to measure the viscosities of cooked-rice and cookie after ten cycles mastication and cookie after 20 cycles mastication because they exceeded 12,000 cP, the upper limit of the measurable range of instrument.
Particle size distribution of food boluses after mastication
The results of comparing particle distribution by wet sieving of the food bolus just before swallowing demonstrated that the numbers of particles larger than 1.4 mm was 600.00±18.33 in cooked rice, 489.00±30.64 in tofu, 228.67±23.16 in banana, and 113.67±23.71 in cookie (Table 5, Fig. 6). There were significant differences in the distribution of particles between the foods (p<0.05).

Distribution of Particle Size Measured by Wet Sieving

Distribution of particle size measured by wet sieving.
The distribution curve of the particle size using laser diffraction showed two peaks for all foods. For banana, a particle size of 352.0 µm was the most common while 767.7 µm was the second most common. For tofu, a particle size of 913.0 µm was the most common and 322.8 µm was the next common size. For cooked-rice, a particle size of 837.2 µm was the most common, whereas 322.8 µm was the second most common. For cookie, a particle size of 176.0 µm was the most common and 23.99 mm was the second most common (Fig. 7).
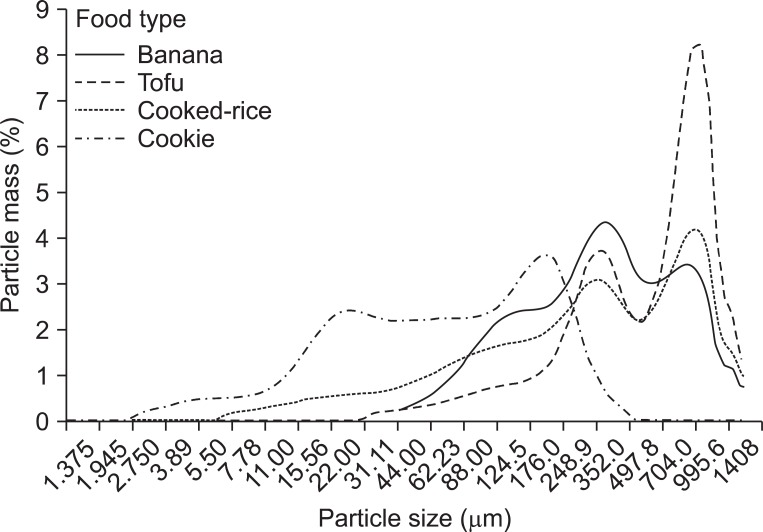
Distribution of particle size for four different foods measured by laser diffraction.
DISCUSSION
When measuring the physical properties of foods, sensory evaluations that assess the food's characteristics through senses, such as sight, smell, taste, and physical property analysis, using the texture analyzer or rheologic machines, are usually used. Through the rheologic analysis, properties of food materials, such as hardness, adhesiveness, cohesiveness, springiness, gumminess, and chewiness, can be determined.17 Hardness is defined as the force necessary to attain a given deformation and adhesiveness is expressed as the work required to pull food away from a surface. Cohesiveness is the strength of internal bonds making up the body of the product, which can be calculated as the ratio of positive force during the second to that of the first compression cycle. Springiness is defined as the bouncing back property of foods through consecutive bites. Gumminess is the energy required to break up a semi-solid food for swallowing, which can be calculated by multiplying the hardness by the cohesiveness. Chewiness is the energy required to chew a solid food for swallowing and this can be calculated by multiplying the gumminess by the springiness. The characteristics of food material can be understood through this rheological research, which is currently being used in various ways, particularly in the processing and storage of foods in the food industry. In addition, it is potentially applicable to food processing for the elderly and dysphagia patients as well as in the understanding of the swallowing physiology. The viscosity is also one of the physical properties. It is well known that thickening the food viscosity decreases aspiration into the airway in patients with oropharyngeal dysphagia, whereas increasing the viscosity is an important strategy in dysphagia management.18 This study conducted a rheological analysis using texture analysis machines for objective and reproducible results of 4 specific food materials, which have their own typical physical properties. From the results of this study, banana was high in adhesiveness compared to other foods, tofu was high in cohesiveness and springiness, and cookie was high in hardness. In the cohesiveness and springiness attributes, tofu and cooked-rice showed similar measuring values as each other, although there were significant differences; however, the values were significantly different from other foods. In addition, no statistical differences were observed between tofu and cooked-rice in adhesiveness, hardness, chewiness, or gumminess. This means that these two foods have similar rheological natures.
In the experiment measuring mass changes of food bolus according to the mastication number, the mass increased as the number of cycles increased in all types of foods, and this was thought to be from the addition of secreted saliva in the mouth during the mastication process. Regardless of the number of mastication cycles, there were differences in mass changes among the various food types; this could be due to the differences in salivation according to the different physical characteristics of foods as well as taste. However, this study was not able to confirm direct relevance with salivation and the physical properties of foods. The results of comparing mass changes just before swallowing indicated significant differences in mass increase in the cooked-rice and cookie compared to those of banana and tofu. A larger number of mastication cycles were required for the cooked-rice and cookie than for the banana and tofu; this was also thought to be associated with differences in salivation. This result is similar to previous studies16,19 demonstrating that more mastication is required for swallowing hard foods. However, further research as to the effect of taste or water content of food is necessary to understand why more mastication cycles occurred with cooked-rice despite the fact that several physical properties, including hardness, were similar to those of tofu. Also, the study found differences in individual mass changes attributed to partial loss in the process of mastication, as well as masticatory variations of the subjects. Food bolus formation continues to take place in the mouth after taking foods into the mouth and during mastication. Some parts of the food bolus were stuck inside of the mouth during the collection after mastication. In order to reduce losses in the collection process, the remaining food particles should be collected by rinsing the mouth with water and adding them to the spitted bolus. However, this study did not use this technique because the added water amount and contamination of the saliva irrelevant with bolus would affect the mass and the lack of drying and counting method for this process. The loss of some part of the bolus mass could be considered a limitation of the experiment, which measured mass changes of foods after mastication.
Viscosity is a physical unit indicating the thickness of a fluid and is defined as the inner resistance to the movement of the fluid. It is also expressed as a ratio of shear stress and shear rate. Isaac Newton stated in his definition of viscosity that values measured according to the shear rate were consistent within a material. Materials having these characteristics are called Newtonian fluids, and water, ethanol, and mercury correspond to it. Fluids that do not adhere to Newton's law are called non-Newtonian fluids, and viscosity values can change variously according to the shear rate. The measured values in non-Newtonian fluids at regular shear rates are referred to as relative viscosities. There are various viscometers that can measure viscosity. Vibratory viscometers can measure the relative viscosity of non-Newtonian fluids as well as the fluids containing bubbles and those with a small sample quantity.20 Therefore, this study used a vibratory viscometer in order to measure and compare food bolus viscosities after mastication. The upper limit of the viscometer used in this study was 12,000 cP, and we were unable to measure the viscosities of cooked-rice and cookie after mastication because they exceeded the viscosity limit. The temperature of the food, pressure, and time from the food preparation are other factors affecting viscosity. However, because this study was conducted in order to analyze the state of food bolus on the assumption of just before swallowing, the effects of these factors on the change in viscosity were not considered.
In this study, the results of measuring food bolus viscosity according to the mastication number demonstrated that viscosity decreased in all foods as the number of mastication cycles increased. Banana displayed the lowest viscosity, and cookie was the highest, with similar values observed for tofu and cooked-rice. Considering that the physical properties were relatively similar between tofu and cooked-rice, the physical properties were thought to affect the measured viscosity. During the mastication processes, liquid components and secreted saliva are mixed to form a food bolus, and more liquid components of the food itself are extracted as the mastication cycles increased. This way, the viscosity of a food bolus is decreased by the increases in saliva secretion. The measured viscosity was affected by the food's physical properties, however, other factors may affect viscosity as well as saliva secretion. For example, the viscosity of the bolus of cookie was the highest despite the fact that its mass change was not smaller compared to other foods. This indicates that various properties of foods should be considered, including the food's water content, absorption ability, and structure.16,21 However, the statistical analysis of viscosity changes was limited because of the missing values of high viscosity foods, such as cooked-rice and cookie, in which the viscosity of these could not be measured in many cases, as aforementioned. This was thought to be a limitation of this study.
It was already known that the masticatory parameters, such as the number of cycles, the duration of the sequence, mandibular movements, the cycle patterns, or the EMG activity vary widely between individuals. Nevertheless, previous studies reported that some physical bolus properties, such as the particle size distribution or shape, show relative similarity in the same food type.1,2 In addition, the bolus characteristics of the stage of swallowing is one of the most important factors to triggering the swallowing reflex. For this reason, many studies analyzing the bolus characteristics used the bolus of just before swallowing. In this study, the viscosity of the food bolus just before swallowing displayed significant differences between each food. When comparing the tofu with cooked-rice, the viscosity just before swallowing displayed large differences, while there were similar values in viscosity after 20 and 30 cycles of mastication. Considering this result, it would seem that other factors would be involved as a sensory input related to trigger swallowing. Tofu required fewer mastication cycles and showed higher viscosity than cooked-rice. Tofu's physical properties, such as the soft and smooth surfaces, allowed for a quick preparation of the food bolus for swallowing with fewer mastication cycles. This is correlated with the results of other research, in that the degree of the smoothness of the food bolus is related to the swallowing initiation.8,10
As one of the methods of investigating the physical properties of the food bolus during swallowing, this study carried out an analysis on particle size after mastication. This type of analysis has been previously carried out using techniques, such as wet sieving, laser diffraction, and image analysis. However, these methodological differences are known to not affect the results.1,16 This study classified large particles greater than 1.4 mm using wet sieving and laser diffraction for particles smaller than 1.4 mm. Previous studies have shown that harder foods need more mastication cycles for forming a safe food bolus, and the more mastication cycles make the particles to become smaller.1,2,16 This study showed that the greatest number of mastication cycles required for the cookie, the hardest foods, and most of the particles of the cookie were smaller than those of the others, similar to the previous studies. In spite of the personal differences, such as masticatory habits and masticatory systems of the various subjects, previous studies demonstrated that particle size distributions just before swallowing exhibited similar figures across individuals in the same food type,1,2,10 and this study showed similar results. For tofu and cooked-rice, similar particle size distributions were displayed. Similar physical properties of these two foods were the primary consideration.
CONCLUSION
This study was conducted to confirm that properties of food affect bolus formation and mastication. It was found that food bolus mass increased and viscosity decreased as the number of mastication cycles increased. Furthermore, mass and viscosity changes after mastication showed differences according to the food types, which have different physical properties. These differences in the physical properties of the food are also thought to affect the particle size distribution after mastication. Although this study could not confirm direct correlations between the specific physical properties of the food and the state of food bolus, it was able to verify that various physical properties of food influence the mastication process and food bolus formation.