

INTRODUCTION
Carpal tunnel syndrome (CTS) is the most common entrapment peripheral neuropathy, which can be diagnosed by history taking, physical examinations and electrodiagnosis. Electrodiagnosis is most valuable in the diagnosis of CTS and the evaluation of its severity,1 but is considered to be a bit invasive. On the other hand, high-resolution ultrasonography provides a simple, noninvasive means of visualizing peripheral nerves and the surrounding anatomic structures. In particular, it has been known to be useful in the evaluation of entrapment neuropathies such as CTS, and its use has increased.2-5
In the case of CTS patients, local swelling of the median nerve is observed proximal to the carpal tunnel.6 In this regard, many researchers have presented the cross sectional area of the median nerve, measured at the distal wrist (CSA-W), as an index for the ultrasonographic diagnosis of CTS.2,3,7 However, the values of the CSA-W have varied among reports, being 7-9.5 mm2 in the normal and 9-15 mm2 in patients with CTS.7,8 This variability might be due to a technical problem in the ultrasonographic measurement and the differences between populations studied. The cross sectional area (CSA) of a nerve may increase in proportion to body weight9,10 and also could be affected by certain diseases such as demyelinating hereditary motor sensory neuropathy, in which the CSA of the whole nerve increases.11 Therefore, the CSA-W could result in false positive diagnosis of CTS.12
A recent study reported that the CSA of normal median nerve was the same at the wrist and in the forearm.13 Based on this finding, a ratio between the median nerve area at the wrist and that in the forearm (WFR) is suggested as an alternative diagnostic index.14
It is crucial to classify the severities and neurophysiologic types of CTS, in treatment planning and follow-up. Many researchers have classified CTS severities with clinical patterns and electrophysiological findings.15-20 Recently, it was suggested that the CSA-W can be a useful index for ultrasonography-based classification of CTS severity.21 However, CSA-W have been measured only recently. The WFR is expected to be more helpful to classify CTS severities.
In this study, we compared WFR and CSA-W according to the electrophysiologic severity in patients with CTS and in healthy controls to evaluate whether WFR is useful in diagnosing and grading the severity of CTS.
MATERIALS AND METHODS
Subjects
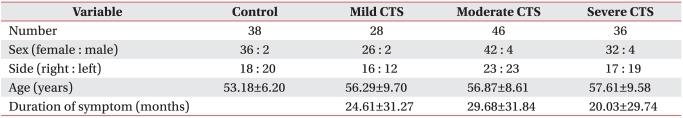
This study was conducted on a group of patients having the clinical symptoms of CTS such as hand tingling, pain, burning sensation, dysesthesia, grip weakness and thenar atrophy in their 110 hands and meeting electrodiagnostic criteria, as well as on a control group composed of healthy people with their 38 hands. Patients with systemic peripheral neuropathies such as diabetic neuropathy, neuropathies other than CTS or radiculopathy were excluded. The study group was composed of 100 female hands and 10 male hands, and the control group was composed of 36 female hands and two male hands. The patients in the case group were classified into three subgroups as to CTS severity graded by electrodiagnosis (i.e., mild, moderate and severe groups; 28 hands, 46 hands and 36 hands, respectively) (Table 1). The average age of the case group was 53.18. The ages of subgroups averaged 56.29, 56.87 and 57.61 years, respectively. The subgroups did not show significant differences in age, sex ratio and the ratio of left hands to right hands (left-right ratio) (Table 1).
This study was conducted with the approval of the relevant institutional review board and the consent of patients.
Methods
Electrodiagnosis
Electrodiagnosis was performed by using a Counter Point MK2 machine (Dantek, Copenhagen, Denmark). The temperature of each hand was maintained at Ōēź32Ōäā. The median motor response was recorded over the abductor pollicis brevis muscle with median nerve stimulation 8 cm proximal to the active recording electrode. The onset latency and baseline to peak amplitude were measured. The median sensory response was recorded antidromically with a bar electrode over the third digit and median nerve stimulation given at two points, 7 cm proximal to the recording electrode in the palm and 14 cm proximally at the wrist. To test the 5 cm transcarpal segment, the median nerve was stimulated at two points: the distal wrist crease and 5 cm distal to the distal wrist crease in the palm. The onset and peak latencies and baseline to peak amplitude were measured and the onset latency difference of 5 cm transcarpal segment was calculated. Needle electromyography (EMG) was performed on the abductor pollicis brevis muscle. CTS severity was classified according to Steven's classification and in accordance with the criteria of the electrodiagnosis laboratory at Korea University Anam hospital (Table 2).19,22,23
Ultrasonography
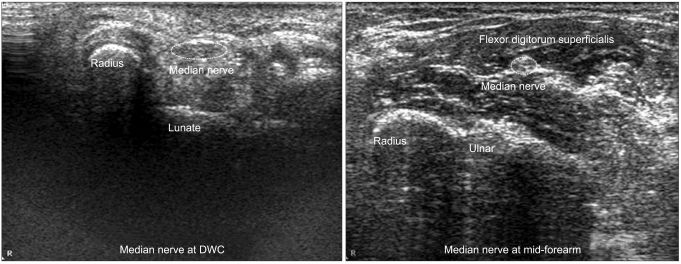
Ultrasonography was performed by use of M2540A Envisor Diagnostic Ultrasound Imaging System (Philips, Bothell, USA). The transducer was always kept perpendicular to the median nerve to avert anisotropy. No additional force was applied other than the weight of the probe and the wrist was kept in the neutral position to avoid causing any artificial nerve deformity. The median nerve was imaged in an axial plane at the distal wrist crease and 12 cm proximal in the forearm (Fig. 1). CSA measurements were performed at the inner border of the thin hyperechoic epineural rim by the continuous tracing technique and the average values were calculated after serially measuring three times. WFR was calculated with the values of CSA measured at the distal wrist crease and 12 cm proximal in the forearm (Fig. 2).
Statistical analyses
Statistical analyses were performed by using SPSS, version 18.0 (SPSS, Cary, USA). Data are reported as mean┬▒standard deviations. The Kruskal-Wallis test was used to evaluate differences in the ages, symptom durations and ultrasonographic values between the groups. The Mann-Whitney U test with Bonferroni correction was used as post-hoc test to analyze differences in the ultrasonographic values according to the electrodiagnostic severity grades. The chi-square test was used to assess the other basic characteristics of each groups. The Spearman correlation analysis was performed to examine the correlation between ultrasonographic values and electrodiagnostic severities. The statistical significance was set at p<0.05. Bonferroni correction was made for six comparisons; thus, the p-value for significance was <0.05/6=0.0083. Receiver operating characteristic (ROC) curves were used to detect optimal possible cut-off values of the ultrasonographic data according to electrodiagnostic severities, and specificity and sensitivity were obtained.
RESULTS
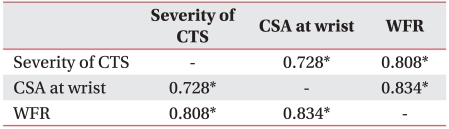
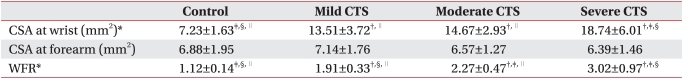
On the correlation analysis between ultrasonographic values and electrodiagnostic severities, significant correlations were observed in the CSA-W (r=0.728) as well as in the WFR (r=0.808). WFR showed a higher correlation (Table 3). The CSA-W had the value of 7.23 mm2, 13.51 mm2, 14.61 mm2 and 18.74 mm2 in the control group, mild group, moderate group and severe group, respectively, showing significant differences. CSA of the median nerve, measured at 12 cm proximal to the wrist crease, was 6.88 mm2, 7.14 mm2, 6.57 mm2 and 6.39 mm2 in the control group, mild group, moderate group and severe group, respectively, showing no significant differences. The wrist-forearm ratio was 1.12, 1.91, 2.27 and 3.02 in the four groups (same respective order) and showed significant differences (Table 4).
Post-hoc analysis using Mann-Whitney U test with Bonferroni correction showed that in relation to the CSA-W, there were significant differences between the control group and the mild group, and between the moderate group and the severe group. However, there was no significant difference between the mild group and the moderate group. With WFR, there were significant differences between the control group and the mild group, between the mild group and the moderate group and between the moderate group and the severe group (Table 4).
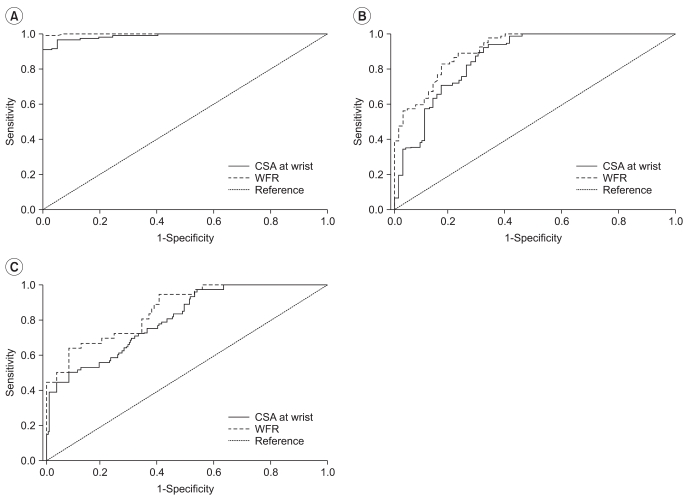
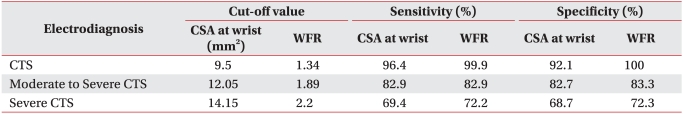
The ultrasonographic cut-off values for the diagnosis of CTS were obtained by use of the ROC curve. Likewise, the cut-off values, suitable for the diagnosis of moderate to severe and severe CTS, were obtained in the same way (Fig. 3). The areas under the ROC curve of the CSA-W in diagnosis of CTS, moderate to severe CTS and severe CTS were 0.988, 0.862 and 0.804, respectively (p<0.05). In the case of WFR, the values were 0.999, 0.912 and 0.859, respectively (p<0.05); thus, the areas under the ROC curve showed higher values in the latter. The cut-off value of the CSA-W, obtained by the ROC curve, indicated 9.5 mm2, 12.05 mm2 and 14.15 mm2 in diagnosis of CTS, moderate to severe CTS and severe CTS, respectively. Meanwhile, the cut-off value of the WFR indicated 1.34, 1.89 and 2.2, respectively. The sensitivity and specificity of the cut-off value was superior in the WFR (Table 5).
DISCUSSION
CTS is usually diagnosed by clinical evaluation and electrodiagnosis, and the therapeutic plan is decided on its severity. In this regard, various scales have been developed. In recent times, ultrasonography emerged as a promising diagnostic tool for entrapment neuropathies, particularly CTS. In the case of CTS, local swelling of the median nerve is observed at the proximal carpal tunnel on ultrasonography, and CSA-W is useful to diagnose CTS and is highly correlated with clinical symptoms.24,25 However, the CSA-W may vary depending upon the measurer or depending upon whether the epineurium is included in the measurement. Several studies reported that body weight correlates with CSA-W.9,10 In this connection, it has been suggested that WFR could be a new index for the diagnosis of CTS.14
Grading the severity of CTS is important in treatment planning and in follow-up. Some researchers have studied the correlation of ultrasonographic findings and CTS severities. Lee et al.26 reported that the swelling of the median nerve at the proximal carpal tunnel was related to the results of nerve conduction study. Bayrak et al.27 reported that the motor unit number estimation of the abductor pollicis brevis muscle was negatively correlated with CSA of the median nerve at the proximal and middle segment of carpal tunnel. Padua et al.28 reported that a positive correlation exists between CSA-W and the neurophysiological severity of CTS. In this connection, El Miedany et al. analyzed the correlation between electrodiagnostic severity and the CSA-W and suggested cut-off points that discriminate between different grades of CTS severity as 10.0-13.0 mm2 for mild patients, 13.0-15.0 mm2 for moderate patients and >15.0 mm2 for severe patients.21 However, the false positive rate is more likely to increase if CTS is diagnosed only by the CSA-W.
In this study, we compared electrodiagnostic CTS severities and ultrasonographic values. CSA-W increased according to CTS severity. However, mild CTS and moderate CTS did not show significant differences in CSA-W. WFR was more highly related to CTS severity than CSA-W, and significant differences were observed between all groups. The sensitivity and specificity, obtained by the ROC curve, were superior in WFR.
In common with this study, some previous studies reported increased CSA-W according to CTS severity.21,26-28 However, Asians are different from Westerners in CSA-W12,29 and also the values may vary depending upon the measurer. Moreover, there has been controversy about the correlation between body weight and CSA-W.9,10 WFR may be advantageous to grade severity of CTS, inasmuch as it is possible to reduce the differences amongst researchers14 and to correct the differences caused by somatotype or race.
Due to the absence of somatotype information, this study could not analyze the correlation between body weight or height and CSA-W. Moreover, patients' clinical symptoms could not be reflected in the classification of CTS severities. In addition, the control group and the patient groups were composed of comparatively small numbers. Furthermore, the results were obtained on the basis of nonparametric statistics because data could not meet the normality. As a result, in the CSA-W and WFR determinations, the standard deviation increased in proportion to the CTS severity, and, thus, sensitivity and specificity became relatively lower. Alternatively, it might have been because electrophysiological severities were not consistent with anatomical findings. Large-scale studies are required.
CONCLUSION
In addition to clinical symptoms and electrodiagnosis, ultrasonography may be complementary to the diagnosis of CTS and the classification of its severities. In this study, CSA-W increased in proportion to the severity of CTS. However, WFR displayed statistical significance in relation to the assessment of each severity. Moreover, the cut-off value of each severity showed higher sensitivity and specificity. Altogether, WFR is amore accurate index than CSA-W.