The Correlation between Modified Ashworth Scale and Biceps T-reflex and Inter-rater and Intra-rater Reliability of Biceps T-reflex
Article information
Abstract
Objective
To establish a correlation between the modified Ashworth scale (MAS) and amplitude and latency of T-reflex and to demonstrate inter-rater and intra-rater reliability of the T-reflex of the biceps muscle for assessing spasticity after stroke.
Method
A total of 21 patients with hemiplegia and spasticity after ischemic stroke were enrolled for this study. The spasticity of biceps muscle was evaluated by an occupational therapist using the MAS. The mean value of manual muscle test of biceps muscles was 2.3±0.79. Latency and amplitude of T-reflex were recorded from biceps muscles by two physicians. The onset latency and peak to peak amplitude of the mean of 5 big T-reflex were measured. The examinations were carried out by two physicians at the same time to evaluate the inter-rater reliability. Further, one of the physicians performed the examination again after one week to evaluate the intra-rater reliability. The correlations between MAS and T-reflex, and the intra- and inter-rater reliability of biceps T-reflex were established by calculating the Spearman correlation coefficients and the intra-class correlation coefficients (ICCs).
Results
Amplitude of the biceps T-reflex increased with increasing level of MAS (rs=0.464 and 0.573, respectively, p<0.01). ICCs of latency and amplitude of biceps T-reflex were 0.914 and 0.822. The Spearman correlation coefficients of latency and amplitude of biceps T-reflex were 0.937 and 0.635, respectively (p<0.01).
Conclusion
Biceps T-reflex demonstrates a good quantitative measurement and correlation tool with MAS for spasticity, and also shows acceptable inter- and intra-rater reliability, which can be used for patients with spasticity after stroke.
INTRODUCTION
Spasticity is one of the major clinical manifestations shown in the upper motor neuron diseases, such as stoke and spinal cord injury. It is a motor abnormality that often causes serious functional loss in the process of or after treatment and recovery.1-3 In this regard, the significance of proper adjustment and treatment is being emphasized for rehabilitation for patients with upper motor neuron diseases. In order to conduct proper adjustment and treatment, objective and quantitative evaluation is necessary.2
At present, the rating scales (e.g. modified Ashworth scale (MAS)), deep tendon reflex (DTR), H-reflex and pendulum test are used for quantitative evaluation for spasticity.4,5 Among them, the rating scales, such as MAS, are being used as a major method for the evaluation of spasticity, but subjective and less reliable.6,7 Further, they cannot quickly respond to changes in spasticity due to a big gap between grades. DTR is also subjective and hard to make quantitative evaluation.7,8
T-reflex, an electrophysiologic test using an electric reflex hammer, is to have objective evaluation results from DTR, which allows quantitative evaluation for extension reflex, a reflex of a single synapse of neuron. It extends fusimotor to vitalize alphamotor nerve along the Ia afferent nerve through neuromuscle and spinal segment to contract extrafusal fibers of the same muscle. T-reflex is used for the evaluation for neuromuscular diseases and peripheral neuropathy, and also for quantitative evaluation for spasticity.9-13
The objectives of this study were to establish the correlation between MAS and amplitude and latency of T-reflex, and to demonstrate the inter-rater and intra-rater reliability of the T-reflex of the biceps muscle for assessing the spasticity after stroke.
MATERIALS AND METHODS
Among the stroke patients in the department of rehabilitation medicine at a university hospital in Gyeongnam, during the period January to June 2011, 21 patients, who presented spasticity on the elbow flexor within 2 months after stroke onset, participated. An appropriate informed verbal consent was obtained from all patients as per the recommendations of the Yangsan Pusan National University Hospital Research Ethics Review Board, without IRB approval. Subjects were included if they had (a) sustained an ischemic stroke; (b) spasticity in the elbow flexors and (c) no contracture in the elbow joint. Participant didn't take anti-spasticity medication. Nerve conduction studies and electromyography were performed to all participants to confirm the absence of peripheral polyneuropathy and neuromuscular disease. All participants received similar amounts of rehabilitation therapy.
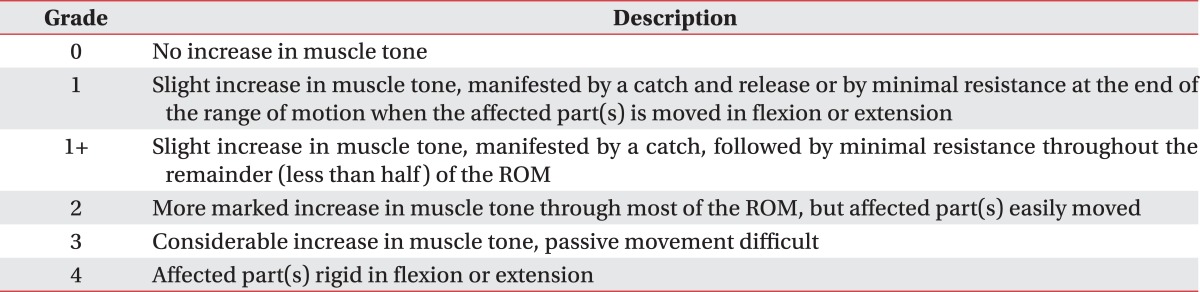
The evaluation for muscular strength and spasticity of the elbow flexor was done by an identical occupational therapist with more than 10 years of experience in handling patients with hemiplegia. Muscular strength is assessed by the manual muscle test with the grade from 0 to 5 (normal muscular strength) of 6 levels in total (Table 1). In addition, the level of spasticity is evaluated by using MAS (Table 2). Using this scale to evaluate the elbow flexor spasticity in patients with stroke, Bohannon et al. reported an inter-evaluator agreement of 86.7% with no more than one grade difference between the evaluators (s=0.85, p<0.001).7 Another study also found the reliability of the MAS to be very good, especially at the elbow (kappa was 0.84 for interrater and 0.83 for intra-rater comparisons).14 Three stretches were performed at a velocity of approximately 80-100°/s, and the highest MAS score was recorded. The evaluation for spasticity was performed two times per a week to confirm that there was no change in the spasticity.
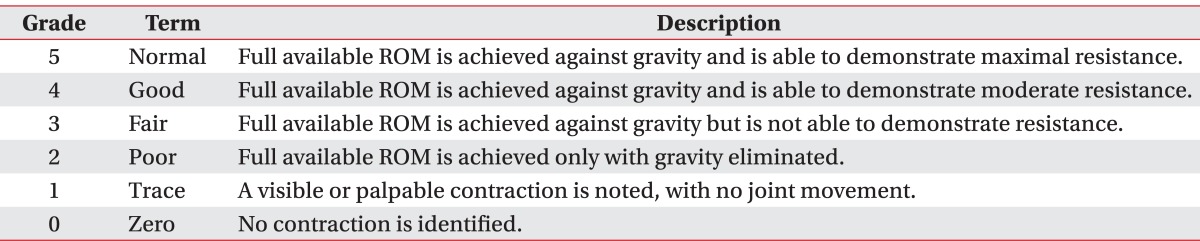
Manual Muscle Testing
To evaluate the T-reflex of biceps brachii muscle, electromyogram Dantec Keypoint (Medtronic Functional Diagnostics, Skovlunde, Denmark) was used. The conditions were: 10 msec/division in speed, 0.2-2 mV/division in sensitivity and 10 Hz-10 kHz in the frequency range. The tendon area was mildly hit by an electric reflex hammer to arouse T-reflex and the result was recorded by using a silver surface electrode. At the time of examination, the examinee was relaxed in a supine position with the elbow flexion at 60 degrees, and the forearm pronation at 20 degrees. To maintain the same strength of hitting, the examiner made a hit by the force of gravity alone from the position with elbow flexion at 180 to 90 degrees, and at the shoulder abduction at 0 degrees. At the middle of the biceps muscle, an activated electrode was attached, and 5cm below of an activated electrode was attached an indifferent electrode to estimate (Fig. 1). The latency is from the baseline to the first biased point, and the amplitude is peak-to-peak.
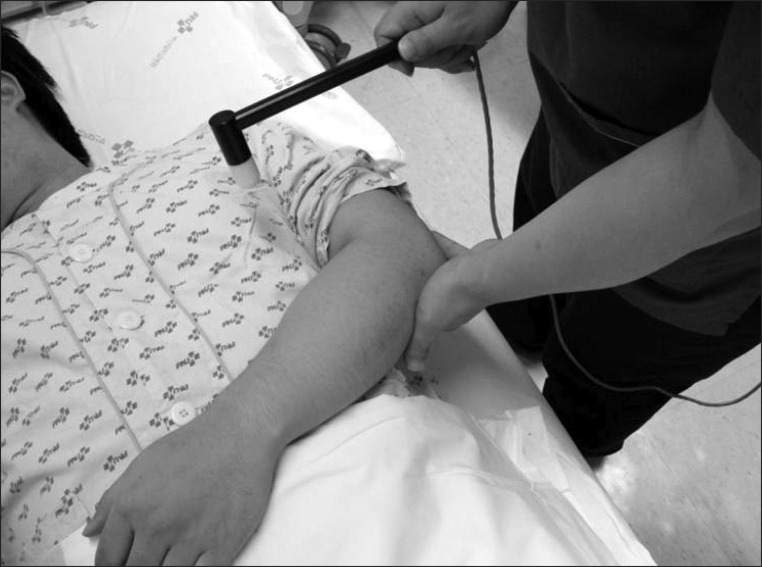
Biceps T-reflex tests were performed using a hand operated electric reflex hammer in the relaxed supine position on the affected side.
To verify the confidence, each of the two rehabilitation medicine clinicians hit simultaneously, and chose the complex evoked potential of the average value of 5 big amplitudes. In addition, to verify the confidence, one rehabilitation medicine clinician conducted the same test per a week for the same patients and compared the results. For statistic analysis, SPSS version 18.0 for Windows program was used. The intra- and inter-rater reliability of biceps T-reflex and correlations between MAS and T-reflex were established by calculating the intra-class correlation coefficients (ICCs) and Spearman correlation coefficients. The correlation between the spasticity level of the elbow flexor and the latency and amplitude of the biceps T-reflex was analyzed by the Spearman correlation coefficients. MAS is an ordinal variable, thus, the values of MAS were changed as follows; Grade 1-1, Grade 1+ -2, Grade 2-3, Grade 3-4 and Grade 4-5. The significance level was p<0.05.
RESULTS
General characteristics of subject patients
The number of subjects was 21, and they have suffered ischemic stroke for less than 2 months. The male subjects were 14, and the female subjects were 8, in addition, the average age was 58.0±13.9. The duration after the onset of disease was 32.2±7.3 days, and the patients with right hemiplegia were 6 and left hemiplegia were 15. All patients' major hand was the right hand. The average muscle strength of the elbow flexor was 2.3±0.79, and the level 1 of spasticity was found in 6 patients, 1+ was 9, 2 was 4, 3 was 2 and 4 was 0 (Table 3).
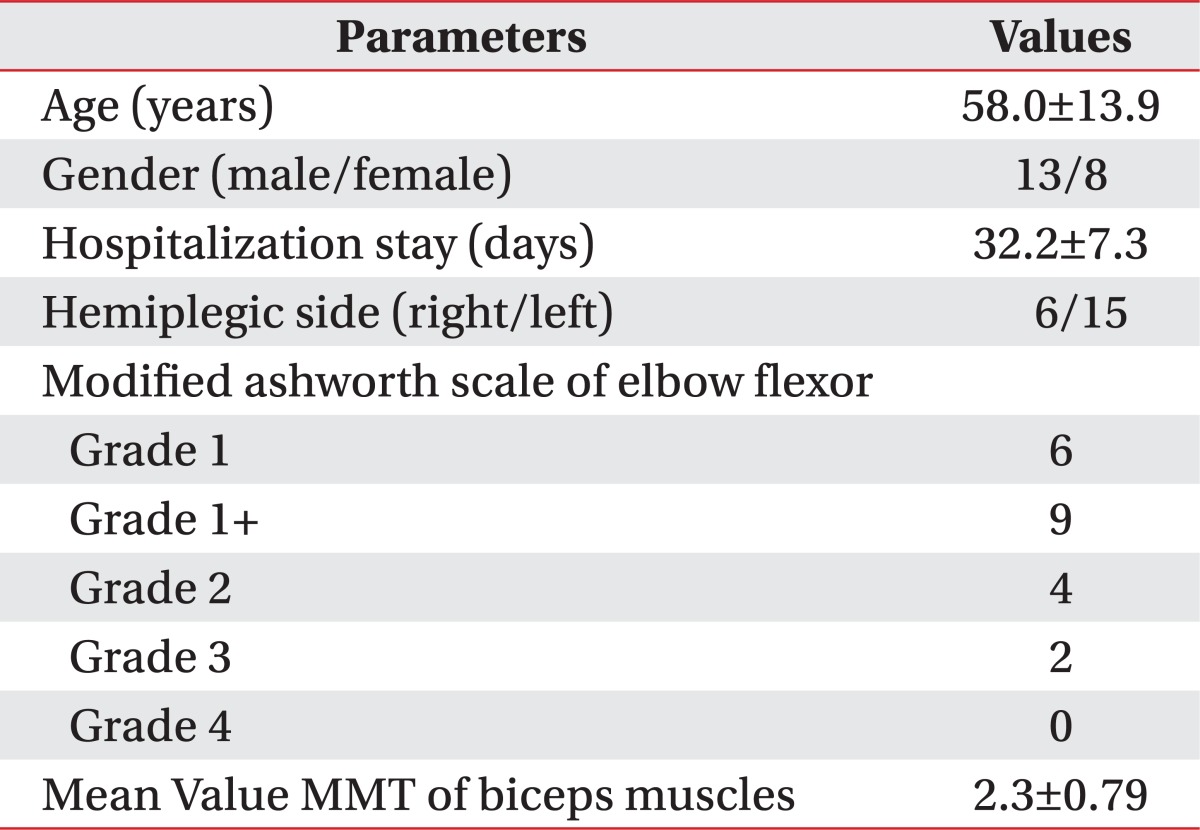
Demographic and Clinical Characteristics of the Subjects
Correlation between MAS and the values of biceps T-reflex test
The Spearman correlation coefficients between MAS and amplitude of biceps T-reflex were 0.464 for the 1st examiner and 0.573 for the 2nd examiner, respectively, which show high confidence (p<0.01). However, the values of latency did not show any correlation (rs=-0.042 and 0.-170, respectively) (p>0.05) (Fig. 2).

Correlation between MAS and amplitude of biceps T-reflex; amplitude of biceps T-reflex increased with increasing level of MAS (rs=0.464 and 0.573, respectively, p<0.01).
The inter-rater reliability for biceps T-reflex
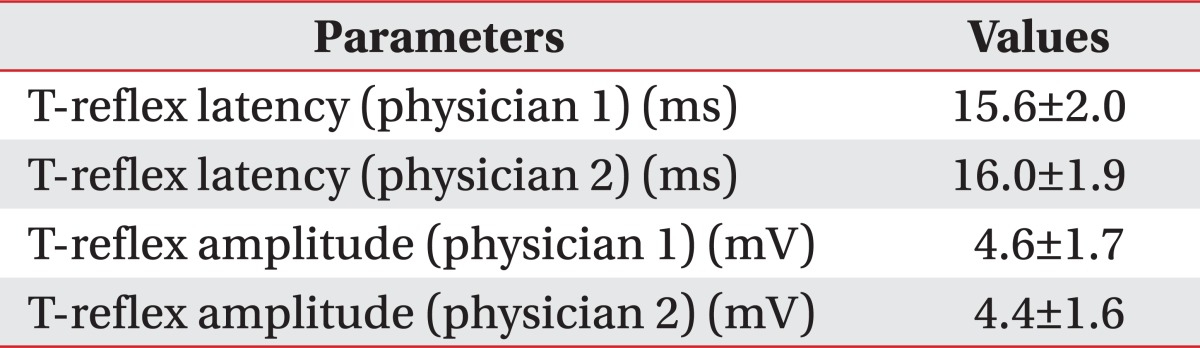
The value of biceps T-reflex latency, done by two different rehabilitation medicine clinicians, was 15.6±2.0 ms and 16.0±1.9 ms respectively, and the value of biceps T-reflex amplitude was 4.6±1.7 mV and 4.4±1.6 mV, respectively (Table 4).
Results of Biceps T-reflex of the Subjects
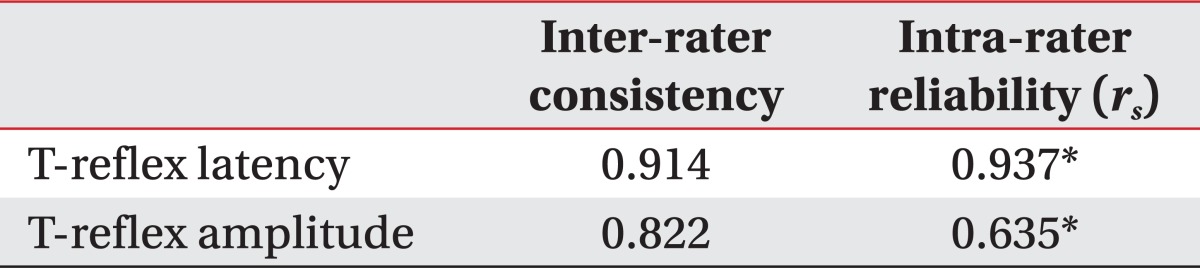
The correlation coefficients between the ranges, indicating the confidence among examiners, were 0.914 for latency and 0.822 for amplitude, showing high confidence (Table 5).
Inter-rater and Intra-rater Reliability of Biceps T-reflex
The intra-rater reliability for biceps T-reflex
The latency and amplitude of the biceps T-reflex was estimated per week by a rehabilitation medicine clinician. The Spearman correlation coefficient for latency was 0.937 (p<0.01), and for amplitude was 0.635 (p<0.01), showing high confidence (Table 5).
DISCUSSION
Among the commonly used evaluation methods for spasticity is the MAS6, but it is subjective, less confident and has too big of a gap between the grades to quickly respond to the changes in spasticity.7,8 To overcome these shortcomings and evaluate spasticity objectively, various neurophysiological tests are used: Hoffman reflex, tendon reflex, changes in a single synaptic stretch reflex, while suppressing vibration, etc.4,5
T-reflex is one of the evaluation methods for stretch reflex, used for upper motor neuron disease or peripheral neuropathy.9-13 H-reflex is an evaluation method for spinal reflex, having identical efferent, afferent routes, but it causes synchronized volley happening at the same time by electric stimulation, while T-reflex is more easily stimulated by mechanical hit, causing a less synchronized volley. Therefore, T-reflex is affected more by the disease state of an afferent route.9 Thus, T-reflex can avoid electric stimulation compared to that of H-reflex and is aroused in many cases, so it is more sensitive in case of testing motor neuron diseases or peripheral neuropathy.15-17
This study proves the intra- and inter-rater reliability of biceps T-reflex and look at the possibility to use biceps T-reflex as a quantitative evaluation method for upper limb spasticity to analyze the correlation with MAS.
As a result of this study, the Spearman correlation coefficients of MAS and biceps T-reflex were 0.464 for amplitude, indicating high confidence (p<0.05) and little correlation for latency (p<0.05). The previous studies on spasticity evaluation, using T-reflex, were conducted by Kim et al.18 and Fellow et al.19 and showed a correlation between MAS and the amplitude of T-reflex but little correlation for latency. However, the study done by Kim et al.18 looked into T-reflex of lower limb as well. As the spasticity of the upper limb was shown more frequently than the lower limb,20 this study researching the T-reflex and spasticity of upper limbs is considered significant.
In Korea, the studies on quantitative analysis and standardized evaluation methods of T-reflex, among the normal adults, were conducted, but most of them were about the lower limb and confidences both among examiners and within an examiner were not evaluated.9-11 Thus, this study tried to prove the intra- and inter-rater reliability of biceps T-reflex. As a result of the study, the intra-class correlation coefficient for the intra-rater reliability was 0.914 for latency and 0.822 for amplitude, which are of high confidence. In addition, the Spearman correlation coefficients for the inter-rater reliability were 0.937 (p<0.01) for latency of biceps T-reflex and 0.635 (p<0.01) for amplitude, presenting high confidence, which shows that the intra- and inter-rater reliability of biceps T-reflex alike are high.
However, despite the results, this study has some limitations. First, the statistics for 21 subjects is not enough to be generalized for significance. To minimize the errors at the time of examination, postures and lamp positions were set, but as for the strength of hitting or the gap between hitting might affect the result, in case of the amplitude of biceps T-reflex. Additionally, it is difficult to quantitatively evaluate the spasticity only with amplitude. Therefore, in future studies, there should be more focus regarding the quantity and objectivity by estimating T-reflex of the upper limb, and using the ratio.
CONCLUSION
As a result of this study conducted, among the 21 patients with hemiplegia to prove the confidence among the examiners and within an examiner for biceps T-reflex in the upper limb, the inter-rater and intra-rater reliability are significantly high.
In addition, as recorded tendon response displacement was compared and analyzed, using MAS and biceps T-reflex in the upper limb, it was shown that there is a correlation between MAS and amplitude of biceps T-reflex.
In sum, it is suggested that measuring the biceps T-reflex can be a useful method for quantitative and objective evaluation of spasticity.
ACKNOWLEDGEMENTS
This work was supported by Pusan National University Research Grant, 2010.