

INTRODUCTION
Because many of our daily living activities are multi-joint movements produced by specific muscle actions, therefore, the maintenance of muscular function is important in the elderly to carry out daily tasks, such as walking, rising from a chair, climbing stairs, or balance and functional independence.
Among many factors affecting muscular function, previous studies have highlighted the role of the angiotensin-converting enzyme (ACE) genotype to make a prediction of sports performance,1 and contributes to the development of an elite endurance athlete.2
The polymorphism of the human ACE gene is based on the presence (insertion, I) or absence (deletion, D) of a 287-base pair sequence in the intron 16 on chromosome 17.
Three genotypes exist: II, ID and DD; with each having different characteristics.
It was postulated that the two functional alleles of the human ACE gene differ in their effects on athletic ability,3 with the I allele favoring endurance-demanding events, and the D allele promoting power events.4
This genetic variation and its effect on ACE activity5 may account for some of the individual differences in both skeletal muscle and function, which are the well-known determinants of muscular strength and endurance.4
ACE D allele is associated with the higher systemic and tissue ACE activities and the production of angiotensin II.6
High activities of ACE in the DD genotype increase the vessel wall thickness and cause thrombosis, higher blood pressure, and hypertrophy of cardiac smooth muscle.7
Due to this mechanism, the DD genotype group has been found as possible risk factors for degenerative and cardiovascular diseases.8
Angiotensin II functions as an atrophic factor to skeletal muscle by decreased capillary perfusion,5 and contribution to the catabolism of skeletal muscle protein, especially in fast-twitch muscle fiber.9
In addition, there is the research that the frequency of II allele is positively correlated with the quantity of fat within the thigh, and the body mass index, as well as the exercise endurance.5
However, these studies have limitations, such as subjects were restricted to a specific population of young elite athletes, and statistical significance was assessed based on distribution of genotypes, rather than the quantitative analysis. Furthermore, the maintenance and improvement of muscle function would be critically important to athletic success in competitive sports, as well as to slow the progression of sarcopenia in the elderly.
Sarcopenia, refers to the age-related decline in muscle mass and function,10 and is reflected in increased mortality because it is related to the functional disabilities and risk of falling, which is taken with the diabetes, obesity, high blood pressure, and chronic degenerative diseases, like the metabolic syndrome in the elderly.11
The mechanism of sarcopenia is thought to involve the growth hormone/insulin-like growth factor-I (GH/IGF-I) axis, which is affected by angiotensin II,5 which is the physiologically active form of the hormone.
The age-dependent increase of angiotensin II levels can contribute to the development of sarcopenia, both by accelerating the protein degradation through the ubiquitin-proteasome proteolytic pathway and by depressing the protein synthesis through inhibition of GH/IGF-1 in skeletal muscle.9
Because the level of ACE activity is varied with ACE gene polymorphism6 and plays a critical role in the conversion of the inactive angiotensin I to angiotensin II, recent evidence suggests that angiotensin converting enzyme inhibitors (ACEIs), which lessen angiotensin II, has an effect on the improvement of physical performance, and it inhibits the age related decline of muscle strength by increasing the insulin resistance and raising skeletal muscle glucose uptake.
If chronically lower ACE activity persists, caused by ACEIs, it prevents a decline of age-related muscle strength. ACE II genotype, potentially has lower ACE activity, which might affect change of age-related muscle function.12 So, the aim of this study was to investigate the difference of ACE activity level, according to the ACE genotypes, and the association between the ACE activity and muscular function of people aged 65, which puts forward the hypothesis that muscular function in the elderly, in connection with sarcopenia, is related to the ACE gene polymorphism.
Grip strength was used as an indicator of muscle strength, and as an indicator of the muscle endurance, in addition, muscle fatigue was objectively and directly quantified using a dynamic electromyogram.13
This study may eventually be significant as basic data to manage age-related loss of muscle function in connection with gradually aged society.
MATERIALS AND METHODS
Subjects
As subjects of this study, 65-year-old people, were able to do their daily activities independently, they were recruited by the health care program of the public health center from June 2010th to January 2011th.
None of the participants had a history of taking drugs, especially anti-hypertensive medication, anti-inflammatory, or statins. All subjects were free of signs or symptoms of any overt chronic diseases.
Individuals with a history of central nervous system disease (stroke, Parkinson's disease, dementia, spinal cord injury and etc.), peripheral nervous system disease (peripheral neuropathy and neuromuscular disease), diabetes, hyperlipidemia or cardiopulmonary disease were excluded from participation.
Considering the sex ratio, we identified 55 subjects. However, only 49 subjects were remained as the final study group, because 5 subjects refused genetic testing and 1 subject developed adverse events (backache).
All volunteers were informed of the risks and benefits of their participation in the study, and then they were instructed to sign a consent form. This study was approved by the institutional review board.
Method
ACE genotyping and plasma ACE activity measurement
Peripheral venous blood samples (5 ml) were drawn from the cubital vein and moved to a blood-collecting tube containing EDTA, an anticoagulant, and stored in the refrigerator until genetic analysis was performed.
Genomic DNA was extracted from leukocytes obtained from peripheral blood using an Accuprep Genomic DNA Extraction kit (Bioneer Corp., Seoul, Korea). The extracted DNA was quantified and qualified. PCR (polymerase chain reaction) was carried out to determine the genotypes of ACE I/D, using specific primers.
After the final products of amplified PCR fragments were electrophoresed,14 the stained gel was visualized under UV light.
Groups were classified, using UV, into three categories based on the number and size of the band: type II 490 bp, type DD 190 bp, type ID 490 and 190 bp (Fig. 1). The level of ACE activity in the serum was measured in duplicate, by colorimetric method, using an automated spectrophotometer, based on the quinineimine dye produced from the substrate of p-hydroxyhippuryl-L-histidyl-L-leucine.15
Body composition measurement
The height of the participants of this study was measured using a Wall-mounted standiometer (Holtain Ltd., Crymych, UK), and the body weight, body fat percent and muscle mass were measured using IN-BODY 3.0 (Biospace, Seoul, Korea).
BMI (body mass index) was calculated, defined as the weight in kilograms divided by the square of height in meters (kg/m2).
Grip strength
In the literatures, grip strength might have used an adequate measurement, indicative for the generalized muscle strength16 because the grip strength is also associated with the arm, back, and leg strength in the elderly.17
In the present study, the grip strength was measured using a handgrip dynamometer (TAKEI Inc., Tokyo, Japan) to characterize the muscle strength indirectly.
We instructed that the participant to be in a standing position, arms abducted to 10┬░ at their side, not touching their body, while the forearm and wrist in a neutral position. Then we asked the participant to squeeze the dynamometer, with as much force as possible.
The best of the three grip measurements was taken as the value of maximal muscle strength.
Muscle fatigue measurement
Muscular endurance is defined as the capacity of muscle groups to sustain the contractions until fatigue.18 Thus, after we had set the individualized target RMS level, the muscle endurance was assessed, both by the quantification of fatigue, using a dynamic EMG and by endurance time while sustaining a submaximal contraction of that level.
We have adopted the test protocol (Fig. 2-A), which was modified from that of Nordez (2009).19 Prior to the test, the room temperature was maintained at 25Ōäā.
The participant was asked to push against a wall using maximum force, and then myoelectrical signal of the maximal voluntary contraction (MVC) was measured in the gastrocnemius muscle.
Prior to an electrode placement, the skin was shaved and cleaned with alcohol, in order to minimize the impedance.
The surface electrodes (Delsys Inc., Boston, USA) were placed at the Medial GCM Muscle belly, as recommended by SENIAM (Surface Electromyography for Non-Invasive Assessment of Muscle).20
We have fixed the location of the chair, suitable for the leg length, in order to contact the resistant wall with the foot of participants and not allowing the foot to move, while ankle plantar flexion. Further, we have instructed the participants not to put stress on the shoulder, trunk and thigh, as well as to keep the knee fully extended. A 5 min warm-up, consisting of gradually and increased isometric plantar flexion, was performed first, followed by a 5 min rest period.
Voluntary isometric contractions of the plantar flexor was assessed, using a conventional isometric strength-testing chair, where the participants were seated in an upright position with the back supported, both hip and ankle joint angled at 90 degrees and with the knee fully extended (0┬░) to ensure that the gastrocnemius was contributed significantly to the plantar flexor joint movement. Participants were firmly secured with the straps, which fastened at the waist, trunk and the distal part of the thigh.
Prior to submaximal contractions, maximal isometric strength was determined by having the participants perform three maximal voluntary contractions of the plantar flexor, each of the 3 s duration, and with 10 s rest between each contraction. The highest value was recorded as the participants' maximal strength (Fig. 2-B1).21
EMG signals were amplified and digitized (bandwidth of 10-2,000 Hz) sampling rate of 1,024 Hz using a four-channel portable system of EMG amplifiers, connected in parallel QEMG-4 system, LXM3204 (Laxtha, Daejeon, Korea). The raw EMG signal was full wave rectified and high-pass filtered with a cutoff of 20 Hz, using the Telescan 2.89 software program (Laxtha, Daejoen, Korea).
EMG amplitude of each signal of the GCM, during plantar flexion, was quantified as the root-mean-square (RMS) value. The maximal value of the averaged RMS represents a muscle activity under 100% maximal voluntary contractions. RMS value was used to assess the extent of recruitment of the motor units, and was used as the reference to calculate the target force for the fatiguing contraction test.
Next, after a 5 min rest period, subjects were required to maintain an isometric submaximal plantar flexion, at 40% of the MVC, until exhaustion.
The participants were seated in a chair and asked to plantar flexion with both feet, pushing as hard as they could against the wall.
The fatiguing contraction was performed at a target force of 40% of the maximal voluntary contraction level (MVC).19,22 The subject was required to match the target vertical force, as displayed on the monitor, and was verbally encouraged to sustain the force for as long as possible (Fig. 2-B2).
The fatiguing contraction was terminated when the force dropped below 95% of the target level (40% MVC) for more than 5 s, despite strong verbal encouragement. When this occurred, the subject was deemed to have reached exhaustion, and the duration of the contraction was recorded as the endurance time.
We measured the mean frequency change of the submaximal isometric contraction (40% MVC) during a 2 min period to evaluate the muscle firing pattern during the same time period across the ACE genotypes. The mean frequency was recorded every 10 s, then the mean frequency of the initial 20 s and the last 20 s were averaged. The mean frequency change was calculated by taking the last value from the initial value of the mean frequency.
Measurement of usual physical activity
The physical performance level of the elderly can be various, according to physical condition, spare time and so on. Accordingly, the body composition, muscular strength and muscle endurance can be changed. This research uses the Korea-Physical Activity Scale for the Elderly (K-PASE) for evaluating the physical performance level of the subjects. Because of K-PASE is a proven measurement tool concerning the reliability and validity.23
And it can be a more precise evaluation of the physical performance level of the elderly.
Statistical analysis
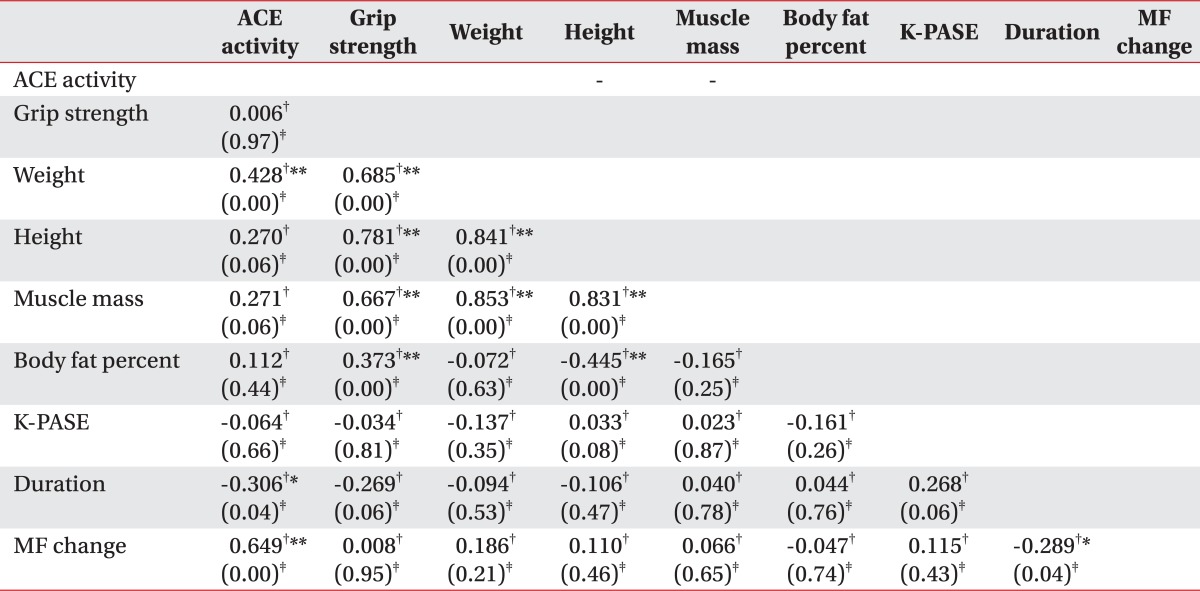
All analyses were conducted using the SPSS statistical software Version 12.0 (SPSS Inc., Chicago, USA). Data collected through the research are presented as the means┬▒standard deviation. Data of ACE activity, endurance time, handgrip strength and the mean frequency change, across the three genotype groups, were analyzed using Kruskal-Wallis test, non parametric test. When the test proved a significant difference in the mean value, multiple comparisons between two groups (II vs. ID, ID vs. DD, II vs. DD) were done by a Mann-Whitney test and Bonferroni correction (Post-hoc test). On Bonferroni correction, p<0.0167 (0.05/3) was considered statistically significant. In all cases, except this, p<0.05 was considered statistically significant. There were tested in order to analyze the correlation between the variables (physical activity, body composition, endurance time, handgrip strength and MF change), using a Spearman rank test.
RESULTS
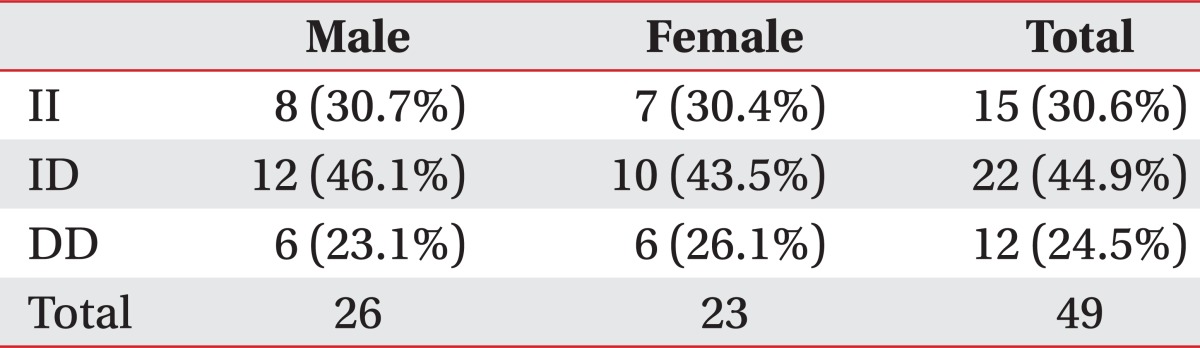
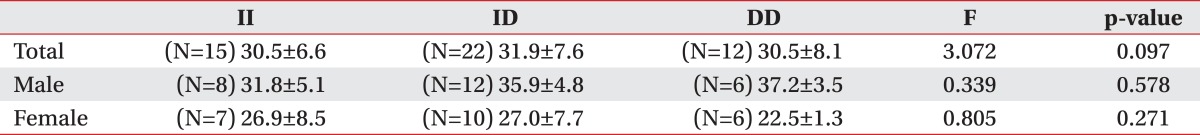
The subjects participated in this study were total of 49 persons, aged 65 years-old (26 males and 23 females). The distribution of ACE genotypes appeared to be similar between males and females. The genotype distributions were ID (44.9%), II (30.6%), and DD (24.5%) (Table 1).
ACE gene polymorphism and Physical characteristics
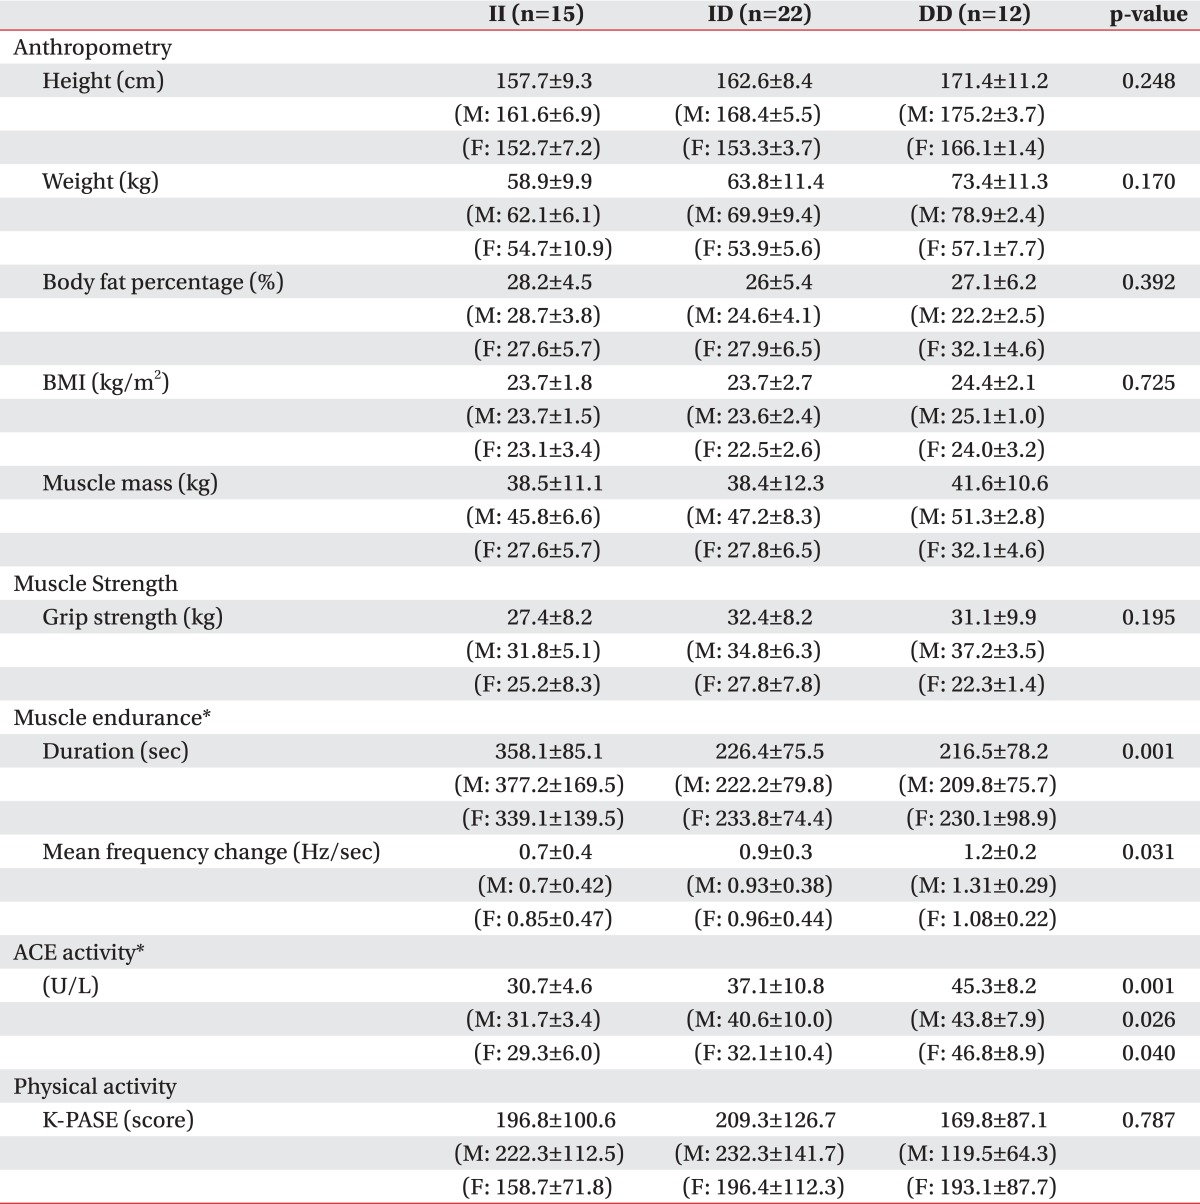
The body measurements of the whole subjects were 162.1┬▒9.7 cm (average height) (mean┬▒ S.D.), 63.1┬▒11.3 kg (weight), 26.9┬▒5.3% (body fat percent), 39.2┬▒11 kg (muscle mass), and 23.9┬▒2.3 kg/m2 (BMI). The subject's physical characteristics upon the ACE gene polymorphism were not different with statistical significance (Table 2). There was no difference between the genders (p>0.05).
ACE activity and muscle strength
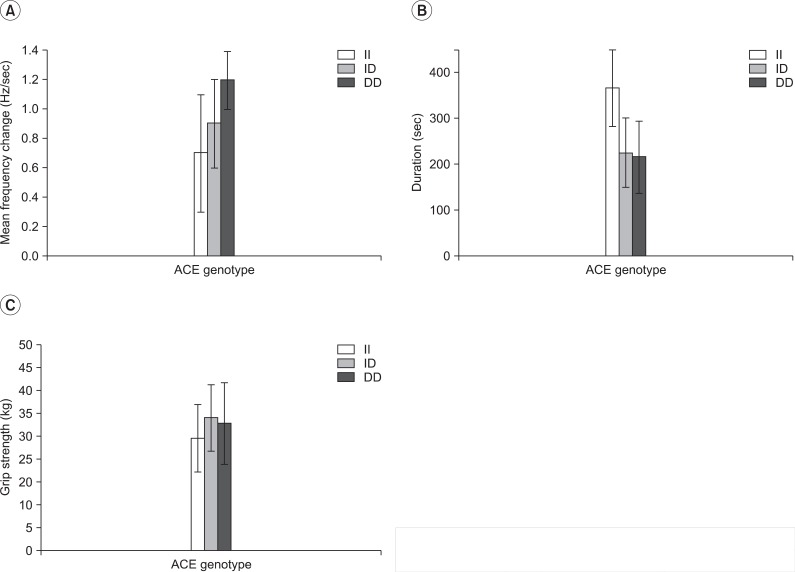
Muscle strength was evaluated indirectly by the handgrip strength. Further, the handgrip strength for the II, ID, and DD genotypes were 27.4┬▒8.2, 32.4┬▒8.2, and 31.1┬▒9.9 kg, respectively (Table 2, Fig. 3-C). The variables and handgrip strength were compared using a Spearman rank test. There were no interrelation between the handgrip strength and ACE activity (p>0.05) (Table 3). The handgrip strength were correlated to height, body weight, muscle mass and BMI (p<0.05). Furthermore, ANCOVA test (covariate is determined height, weight, muscle mass and body fat percent) was performed to compare with the handgrip strength of the three groups, to minimize the differences of influence of the body composition on the handgrip strength. As a result, the handgrip strength, upon ACE gene polymorphism, did not show a statistically significant difference (p>0.05) (Table 4).
ACE activity and Muscle endurance
Using a dynamic EMG, we averaged the initial 20 s and the last 20 s mean frequency change during the 2 min period of 40% MVC. The mean value of the mean frequency change was 0.95 Hz, and the mean contraction time was 267.6 sec. Between the ACE activity and muscle fatigability, there was interrelation by Spearman rank test (p<0.05) (Table 3).
ACE gene polymorphism and ACE activity
There were statistical differences in serum ACE activity in relation to ACE genotype (DD=45.3┬▒8.2, ID=37.1┬▒10.8, II=30.7┬▒4.6 U/I). Also, there was a difference between the gender (p<0.05) (Table 2).
ACE gene polymorphism and muscle endurance
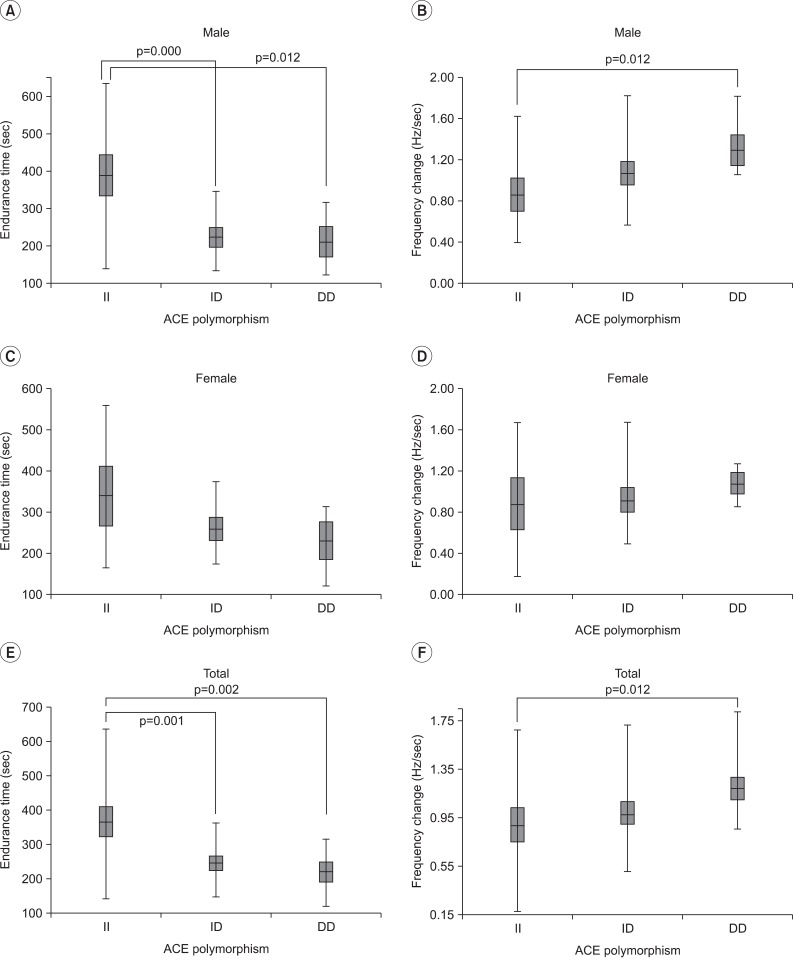
Endurance time and frequency change were compared among the three groups, defined by the ACE gene's polymorphism. As a result, there was a significant difference between DD and II, but no statistical difference was observed between II and ID, as well as, ID and DD. However, in the comparison of the average value, it showed the tendency to get greater frequency change and to get shorter endurance time, in the order of II, ID and DD genotype (Fig. 4-E, F) (Table 2). In the gender division, there were significant differences of the frequency change and endurance time on the male subject group, as the whole group. However, there were no statistical difference on the female subject group (only showed the tendency on the comparison of average value) (p>0.05) (Fig. 4).
ACE gene polymorphism and K-PASE
The K-PASE score for the II, ID, and DD genotypes were 196.8┬▒100.6, 209.3┬▒126.7, and 169.8┬▒87.1, respectively. The physical performance level (described by K-PASE score), upon the ACE gene polymorphism, were not different with statistical significance (Table 2). The physical performance level were not correlated to the grip strength, the mean frequency change, endurance time and muscle mass (p>0.05).
DISCUSSION
This study has significance in that it is the first study to show a relationship between the ACE activity across the ACE genotypes and muscle endurance by quantify muscle fatigability, objectively, using a dynamic EMG in the elderly of the same age.
In addition, this is the comprehensive study to analyze the difference of the muscular function and body composition, according to the ACE activity, as well as the ACE genotype.
Although, the frequencies of the ACE ID alleles vary considerably in the midst of different races, recent previous studies had reported that it was ID, II, and DD, in order. In the present study, the frequencies for II, ID and DD genotypes of the ACE gene were 30.6%, 44.9% and 24.5%, respectively, and thus, ID type is the most common, followed by II and DD type in Korean population. This finding was not different from the previously reported studies. As compared according to the sex, the frequencies for II, ID and DD genotypes were ID 43.5%, II 30.4%, and DD 26.1% in men, and were ID 46.1%, II 30.7%, and DD 23.1% in women, as the same order (Table 1).
In this study, the ACE activity and handgrip strength did not have significant association, but the ACE activity and endurance time, as well as the mean frequency change showed a statistic association, regardless of the sex.
In addition, since the ACE activity differs according to the ACE genotype, we try to find out whether the muscular strength and muscular endurance are different according to the different ACE genotypes.
Grip strength, as an indicator of muscle strength, was not significantly different across the three genotype groups in both genders.
As an indicator of muscle endurance, endurance time was significantly longer, and the mean frequency change was less in II genotype than that of DD genotype, analyzed separated by men and women.
In the gender division, there were same results on the male subject group, as the analysis of the whole group. But it showed only the tendency on the comparison of average value on the female subject group (Fig. 4). In conclusion, the II type showed a lower ACE activity than the DD type, and it had similar muscle strength. But II type showed superior muscle endurance than DD type.
In II genotypes, the muscle strength was not significantly different, but the muscle endurance was significantly superior and ACE activity was lower, in comparison to the DD genotypes.
Previous epidemiologic studies pointed out that the presence of the I allele gives rise to lower the ACE activity in the serum, whereas, those individuals with the DD allele typically have higher circulating and endogenous ACE levels.24
This trend remains significant across the three genotype groups in this study, as well.
In the present study, only the upper limb muscle strength was measured, using a handgrip dynamometry. Handgrip dynamometer had been used as a precise and consistent method for the measurement of one's muscle strength.
However, because the previous studies had shown strong and significant correlations and similar pattern of the muscle strength loss between the upper and lower limbs, it can be used as a surrogate to generalize the muscle function of the whole body.5,16,17 We have concluded that no clear association was observed between the muscle strength and ACE genotypes or activity, as to several previous studies.25,26
However, the other previous investigators had suggested that DD genotype with higher ACE activity have greater strength/power at high velocities than II, ID genotypes,24 because the D allele stimulates the skeletal muscle hypertrophy.4 A possible explanation for that discrepancy may be related to the bias, which is derived from many factors, such as the duration and velocity of contraction, the thickness of subcutaneous tissue, muscle length and fiber-type, gender, age, motor recruitment, neurological, endogenous and psychological events.
In this study, muscle endurance was estimated that measured the duration time of the muscle contraction and muscle fatigue, upon the ACE genotype like the previous study.27,28
Failure to maintain the required or expected force, defined as muscle fatigue,29 is accompanied by the shift toward the lower frequencies of the surface myoelectric signal power spectrum.13 The lower EMG power spectrum shift, during fatigue, is considered to be related to the biochemical by-product accumulation (H+ and lactic acid) in the muscle, which changes the potential conduction velocity, increased firing rate, and/or synchronization of motor, and additional recruitment of motor units.
The build-up of lactic acid during glycolysis in muscle contraction contributes to the delayed repolarization period, and thus, the refractory period is longer. Conduction velocity of action potential and change of the mean frequency decreases, as the inter-depolarization interval increases. Overall, the changes in motor unit conduction velocity, firing rate, recruitment, and synchronization may jointly interact to frequency shift of the power spectrum toward lower frequencies as fatigue progresses. Further, the degree of frequency shift is influenced by the muscle properties, duration and strength of contraction.13 By the way, in muscles with a high proportion of fast-twitch (type II) fibers being more fatigable, the mean frequency change will be greater, as more lactic acid is accumulated.30
As muscle fatigue was measured with the rate of change in the mean frequency, according to time and the mean frequency slope (change/min) in the previous study,31,32 our study tried to estimate the muscle fatigue by a change in the mean frequency for 20 seconds of the beginning and end of submaximal voluntary contraction for 2 minutes. This study needed to set up the section for measuring the change within the same contraction time, and minimum value of the recorded endurance time was 121 seconds. Therefore, we decided 2 minutes by section.
The electromyographic parameter obtained, using surface EMG, can differ from position of electrode and individual characteristics, like subcutaneous fat or muscle condition. Therefore, MVC was measured for marking the relative electromyographic value.13 In addition, this value was considered as the maximum activity of electromyelography gained by spontaneous maximum muscle contraction.21 It was measured as the duration time of the muscle contraction by calculating 40% MVC.
In the previous studies concerning the isometric muscle contraction, MVC target level was various as 15-80%,33,34 but in the present study, we set up a 40% MVC as the target level to reduce the further any potential bias. If MVC target level were so high, the endurance time would be shortened, and the change of the mean frequency decreased, so that the result would not be statistically significant.35 In contrast, if MVC target level was so low, the endurance time would be lengthened, then the attention of the subject to the test is decreased, and the occurrence of error might be a possibility.
Our results confirmed significant differences in muscle fatigability between the DD and II groups, but not between II and ID or between ID and DD. However, we showed positive trends to get greater frequency change and to get shorter endurance time, in the order of II, ID and DD genotypes.
Because the DD type has a relatively higher proportion of fast-twitch fibers than II type, The DD type with the biggest mean frequency change might have less resistance to muscle fatigue than II type. In other words, it means that the DD type has lower muscle endurance than that of II. On the contrary, the II genotype is also associated with more slow-twitch fibers, which are more efficient. This may be a mechanism for the tendency to get longer endurance time of muscular contraction in II genotype.
Nevertheless, it has been suggested that the ACE genotype is related to both muscle endurance and strength, in the previous studies. Why is the ACE genotype associated with not the muscle strength, but only the muscle endurance in our study? The reasons are far from clear-cut, but we presume that the muscle endurance, rather than muscle strength, was more affected by genetic factors, especially in the elderly, because older people have relatively higher proportion of slow-twitch fibers compared to younger people, regardless of ACE genotypes, as increasing age is accompanied by a greater loss of contractile material of fast-twitch type than that of slow-twitch type fibers.11
To our knowledge, there has been no other study, except this study, which aimed at the evaluation of the association among the ACE polymorphism, ACE activity and muscular endurance by an objective quantification of the muscle fatigability.
Also, this study has significance in terms of trying to postulate the effect of the ACE genotypes on muscle strength through the grip strength and body composition, alongside the muscle fatigability. Further, the correlation between the ACE genotypes and physical performance level was examined. In this way, it was considered that our study is significant as a multiple-dimensional model.
However, there are several limitations in the interpretation of the result in this study. First, the subjects who participated in the research were relatively small in numbers. Therefore, these results cannot be reflect the characteristics of the general population. In addition, due to the limitations of a sample size, the nonparametric statistics were used. Even though this study shows similar results from that of the earlier studies, there were some limitations on its statistical significance.
Secondly, the ACE activity measured by this study was ACE levels of the circulating blood. Therefore, it can differ from that of the ACE activity inside the real skeletal muscle. Angiotensin II, affecting at the skeletal muscle through venous by locally produced blood, had a greater influence than the systemic circulation. Therefore, because of the ACE level on the local skeletal muscle had more significant effect on the muscle endurance and strength,36 we need to further investigate the evaluation of the ACE activity on skeletal muscle by muscle biopsy.
Thirdly, the serum calcium, phosphorus, and magnesium, which have an effect on the muscular endurance, was not considered in the present study.
Finally, because this study is targeted at the 65-years-old people, it can become an advantage of this research, owing to exclude the effect of age on muscle function. But at the same time, it is the limit that there is no comparison with the other age groups.
CONCLUSION
In this study, the muscle fatigue and endurance time, using a handgrip strength and surface EMG, was measured in order to examine how the ACE activity on ACE gene polymorphism is likely to affect the muscle strength and muscle endurance among the healthy 65-year-old people. There was a significantly difference of ACE activity and muscle endurance. ACE activity on the whole subject was higher DD type than II type. Endurance time was compared among the three groups, defined by the ACE gene's polymorphism. As a result, there was a significant difference between DD and II, but no statistical difference between II and ID, as well as ID and DD. It showed the tendency to get longer muscle endurance time in order, DD, ID and II genotype. Therefore, the muscle endurance was superior in the II type than DD type. The muscle strength was not statistically different among the three groups (II, ID, DD genotype), regardless of gender. The difference between the body composition and physical performance level upon ACE gene polymorphism were not statistically significant.