


INTRODUCTION
The Bayley Scales of Infant Development (BSID) is the most widely used developmental assessment test for infant and children. The first edition of this test was revised and restandardized in 1993 as the Bayley Scales of Infant Development II (BSID-II) [1]. Although it became the most widely used standardized developmental test, the structure of the BSID-II was criticized for its lack of subscale-standardized scores for assessing cognitive and language development [2]. The scales were subsequently reconstructed and restandardized to produce a third edition, the Bayley Scales of Infant and Toddler Development third edition (Bayley-III). The Mental Developmental Index (MDI) was divided into cognitive, receptive language, and expressive language scales, and the Psychomotor Developmental Index (PDI) was divided by fine/gross motor scales in the revised version. The Bayley-III also benefits from extended floors and ceilings, permitting an assessment of development at lower functioning levels and in more impaired children and populations [2].
Since the introduction of Bayley-III, there is a concern that the score is highly rated compared to the previous version and that children's neurodevelopment is overestimated [3,4]. Even if the change in the structure made it difficult to compare standardized scores between the two versions, the publishers suggest that the average scores of the Bayley-III Cognitive Language Composite (CLC) scores will be 7 points higher than the MDI scores of the BSID-II [5]. Thus, standardization of the Bayley-III is a growing concern. However, previous studies comparing the BSID-II and Bayley-III have focused on high-risk infants on the cognitive and language scales [3,4]. Therefore, it is not known whether the same effect will be observed in cognitive and language scales as well as in motor scales of children with suspected developmental delay.
Most of the previous studies have included preterm infants and suggested cutoff scores for cognitive/language scales. In this study, we suggest appropriate Bayley-III cutoff scores for motor scale as well as cognitive/language scales in patients with suspected developmental delay.
MATERIALS AND METHODS
Participants
The complete Bayley-III and BSID-II scales were assessed in the Department of Physical Medicine and Rehabilitation, Division of Pediatric Rehabilitation Medicine in Asan Medical Center using clinical and experimental methods for diagnosing motor and cognitive development. Developmental assessments were performed between April 2014 and April 2015 during a single session. The following inclusion criteria were used: (1) suspected developmental delay of less than a developmental quotient (DQ, the division of the developmental age into chronological age) of 70 according to a developmental screening test of one or more of the developmental domains; (2) an age from 1 month to 42 months; and (3) the BSID-II and the Bayley-III both were evaluated consecutively. According to these inclusion criteria, 62 children were enrolled in this study.
Neurodevelopmental assessment
A total of 62 children suspected to have developmental delay were assessed with both the BSID-II and Bayley-III. The BSID-II cognitive and motor scale and the Bayley-III cognitive, language (receptive/expressive), and motor (fine/gross) scale assessment were performed according to the manual guidelines. Each child was assessed using the BSID-II and Bayley-III in a single session by one assessor proficient in the administration of both versions of the developmental assessment. Many items were common to both versions of the test. Items were scored according to the instructions of each version of the test. Items common to both scales were simultaneously scored from one item, thereby avoiding practice effects and reducing the duration of testing. BSID-II raw scores were computed and transformed to the Mental Developmental Index (MDI) for the cognitive scale and the PDI for the motor scale (mean=100, SD=15). Bayley-III composite scores were derived from the cognitive, language, and motor scales (mean=100, SD=15). The Bayley-III CLC score, which corresponds to the BSID-II MDI, is defined as the average score of the Cognitive Composite (CC) and the Language Composite (LC) scales. The Motor Composite (MC) scale was evaluated to assess psychomotor development. As recommended for premature births, corrected age was always used up to 2 years for defining the starting point and deriving normative data.
Classification of development
Development should be classified using standardized scores. Specifically, the deviation of an individual's score from that of the normative mean is used to classify developmental delay: normal, within 1 SD of the mean (≥85); mild, −1 SD to −2 SD (≥70 and <85); moderate, −2 SD to −3 SD (≥55 and <70); and severe, more than 3 SDs below the mean standard scores (<55). As the minimum MDI score using the BSID-II is 50, children failing to achieve this were nominally assigned a score of 49.
Statistical analysis
The means and SDs of the CC, LC, CLC, and MC scores (Bayley-III), as well as those of the MDI and PDI (BSID-II), were calculated. The proportions of participants with mild (≥70 and <85), moderate (≥55 and <70), and severe (<55) developmental delay on the Bayley-III and BSID-II were computed. Receiver operating characteristic (ROC) analysis was used to compare the cutoff scores for mild (≥70 and <85), moderate (≥55 and <70), and severe (<55) developmental delay between the Bayley-III and BSID-II. Bayley-III CLC and MC scores were determined on the basis of the optimal cutoff in the ROC curve. We plotted the ROC curves with the true positive rate (sensitivity) on the y-axis and with the false-positive rate (1-specificity) on the x-axis. We then calculated the area under the curve and determined the optimal cutoff for developmental delay on the basis of Youden's J index (J= sensitivity+specificity−1) [6]. The association between the composite scores of both versions was analyzed with the aid of Pearson correlations. Linear regression analysis was used to determine the regression equation to estimate BSID-II scores from Bayley-III scores. The level of significance was set at 0.05 (two-sided). All statistical analyses were performed with SPSS software version 20.0 (IBM, Armonk, NY, USA).
RESULTS
In total, 62 children with suspected developmental delay completed both the Bayley-III and BSID-II scales.
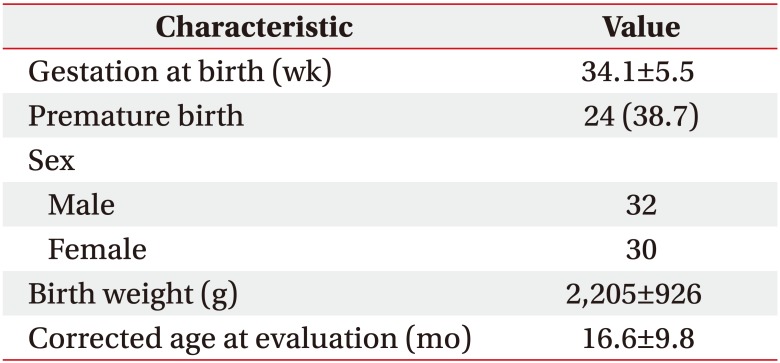
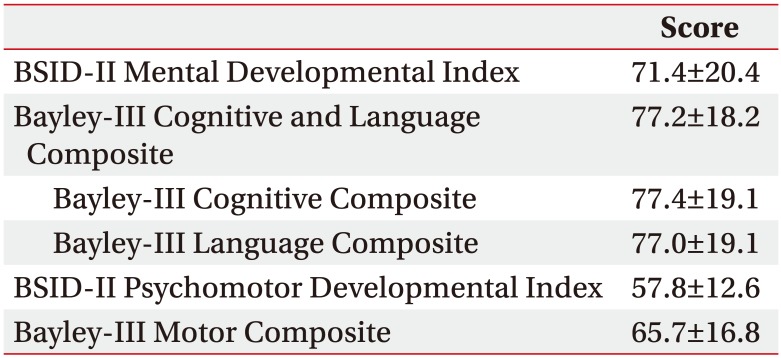
The average age at the time of evaluation was 16.6 months. The mean gestational age of infants was 34.1 months, and 24 children (38.7%) were premature. The mean birth weight was 2,205 g (Table 1). The mean Bayley-III CLC score was 5.8 points higher than the mean BSID-II MDI score, and the mean Bayley-III MC score was 7.9 points higher than the mean BSID-II PDI score (Table 2).
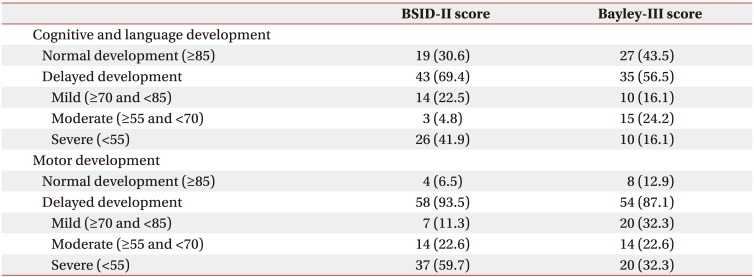
According to the BSID-II MDI and Bayley-III CLC scores, 19 (30.6%) and 27 (43.5%) children, respectively, in our current study were assessed as having normal cognitive development. Regarding motor development, 4 (6.5%) and 8 (12.9%) children were evaluated as having normal development according to the BSID-II PDI and Bayley-III MC scores, respectively. According to the BSID-II MDI and Bayley-III CLC scores, 46.7% and 40.3% of children had cognitive scores <70, respectively, although the rates of severe (<55) cognitive developmental delay according to the BSID-II MDI and Bayley-III CLC scores were 41.9% and 16.1%, respectively. Additionally, the proportions of participants with motor scores <70 according to the BSID-II PDI and Bayley-III MC scores were 82.3% and 54.8%, respectively (Table 3).
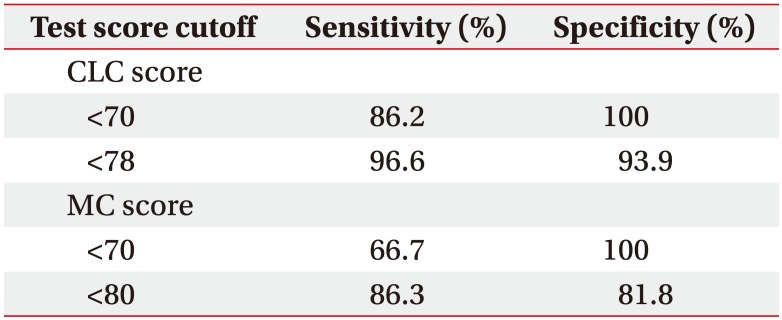
In ROC analysis of a BSID-II MDI score <70, the Bayley-III CLC score showed a cutoff of 78.0. When the Bayley-III CLC cutoff of <78 was used, BSID-II MDI scores <70 were identified with 96.6% sensitivity and 93.9% specificity compared with 86.2% sensitivity and 100% specificity with a Bayley-III CLC cutoff of <70 (Table 4). In ROC analysis of a BSID-II MDI score <55, the Bayley-III CLC score showed a cutoff of 67.0 (p<0.001; area under the ROC curve [AUC], 0.984; sensitivity, 92.3%; specificity, 100.0%). In ROC analysis of a BSID-II MDI score <85, the Bayley-III CLC score showed a cutoff of 87.3 (p<0.001; AUC, 0.946; sensitivity, 86.0%; specificity, 95.0%).
In ROC analysis of a BSID-II PDI score <70, the Bayley-III MC score showed a cutoff of 80. A Bayley-III MC cutoff of <80 had 86.3% sensitivity and 81.8% specificity for identifying BSID-II PDI scores <70, compared with 66.7% sensitivity and 100% specificity with a cutoff of <70 (Table 4). In ROC analysis of a BSID-II PDI score <55, the Bayley-III MC score showed a cutoff of 68.5 (p<0.001; AUC, 0.913; sensitivity, 88.3%; specificity, 88.5%). In ROC analysis of a BSID-II PDI score <85, the Bayley-III MC score showed a cutoff of 94 (p=0.004; AUC, 0.939; sensitivity, 96.6%; specificity, 75.0%). However, only four children showed a BSID-II PDI score ≥85. Thus, determination of the cutoff for a BSID-II PDI score <85 is meaningless.
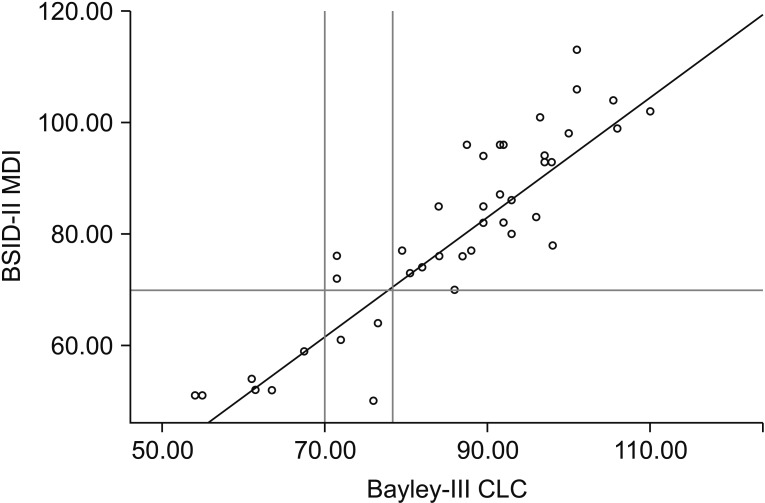
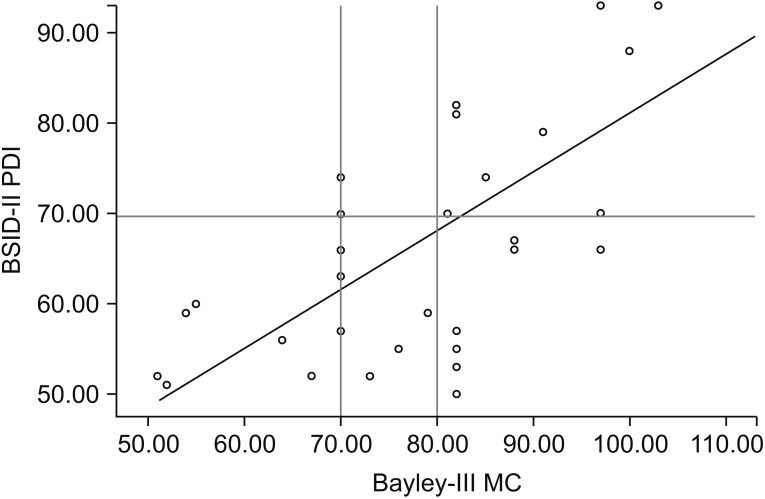
There was a very strong correlation between the BSID-II MDI and Bayley-III CLC scores in children with a BSID-II MDI ≥50 (Pearson's r=0.90, p<0.001) (Fig. 1). The BSID-II PDI scores also strongly correlated with the Bayley-III MC scores in children with a BSID-II PDI ≥50 (Pearson's r=0.779, p<0.001) (Fig. 2). Because the lowest score of the BSID-II is 50, correlation analysis cannot be applied to children failing to achieve this score.
DISCUSSION
One of the aims of our present study was to determine the relationship between the BSID-II and Bayley-III scores in children aged younger than 42 months with suspected developmental delay. In our analysis, BSID-II scores strongly correlated with Bayley-III scores. The mean Bayley-III CLC scores were on average 5.8 points higher than the comparable BSID-II MDI scores, and the mean Bayley-III MC scores were 7.9 points higher than the mean BSID-II PDI scores concurrently acquired in our analysis of 62 children with developmental delay (Table 2). These results are consistent with the validity study reported by the publishers of the Bayley-III, in which a normative sample of 102 children aged 1–42 months were tested using both the second and third editions, and the mean Bayley-III CLC scores were 7 points higher than the MDI scores.
Previous studies have also reported that the Bayley-III underestimates developmental delay compared with the BSID-II [3,7,8,9]. BSID-II and Bayley-III were evaluated as extremely preterm subjects born at less than 26 weeks' gestational age at the National Institute of Child Health and Human Development's Research Network. In this study, the proportion of developmental delay with less than a composite score of 70 was significantly lower in Bayley-III than BSID-II [7]. In a study of 55 premature infants aged 7 months, Bayley-III score was significantly higher than Bayley-II score, from which it was concluded that Bayley-III underestimated developmental delay [8]. Similarly, Acton et al. [3] reported that the mean Bayley-III CLC scores were 5.7 points higher than the MDI scores and the mean Bayley-III MC scores were 6.9 points higher than the PDI scores in 110 patients after early complex cardiac surgery. Moore et al. [9] reported that the mean Bayley-III CLC scores were 6.5 points higher than the MDI scores in 185 extremely preterm children. In a few studies comparing BSID-II and Bayley-III motor scores [3,10], the Bayley-III MC score was 6–10 points higher than the BSID-II PDI score. However, these studies only compared the average differences in the BSID-II and Bayley-III motor scores and did not identify the optimal cutoff value of the Bayley-III MC for developmental delay.
Our present study reports that the cutoff value for developmental delay increased from a BSID-II score of 70 to a Bayley-III CLC score of 78 and Bayley-III MC score of 80 (Table 4). One previous study comparing the BSID-II and Bayley-III in 61 term-born infants with neonatal encephalopathy at 18 months concluded that increased Bayley-III cutoff scores for developmental delay (<70) using BSID-II scores are recommended, from BSID-II MDI scores <70 to Bayley-III CLC scores <85 [11]. Moore et al. [9] suggested a cutoff for cognitive/language developmental delay defined as a composite score under 70 in preterm infants from 70 to 80, which is similar to but slightly higher than the cutoff of 78.0 in our study. They also reported that the proportion of children with a cognitive score <70 was 6% with the Bayley-III CLC compared with 12% using the BSID-II MDI. Although the mean difference in our present analysis between the Bayley-III CLC and BSID-II MDI scores was +5.8 points, the cutoff value of the Bayley-III CLC score of 75.8, which corresponds to this, underestimated the developmental delay compared to the BSID-II cutoff score of 70. However, use of a Bayley-III CLC score <78 significantly improved the detection of developmental delay (BSID-II <70). With a Bayley-III CLC cutoff <78, BSID-II MDI scores <70 were identified with 96.6% sensitivity and 93.9% specificity compared with 86.2% sensitivity and 100% specificity using a Bayley-III CLC cutoff <70. As far as we know, there is not yet a cutoff study on Bayley-III MC scores. According to our present study results, the cutoff score for motor developmental delay by the Bayley-III for identifying moderate and severe developmental delay could be revised from 70 to 80 and 55 to 68.5, respectively. There were only four children in our current series with normal motor development, so we could not estimate the cutoff value for mild developmental delay.
The Flynn effect represents the observed rise in intelligence quotient (IQ) scores as time passes, which results in inflated estimates of intellectual disability [12]. When a developmental test is restandardized or revised, evaluated scores using the new test are generally lower than those evaluated on the previous edition, which is proved by comparing the BSID and BSID-II. However, our results were contrary to those we expected. The rationale for our unexpected score result is that the normative population included clinical cases such as language impairment, cerebral palsy, and Down syndrome in the new Bayley-III standardization, which was not included in previous BSID-II standardizations; children with a preexisting status that has the possibility for developmental delay comprised 10% of the Bayley-III normative sample. When using the Bayley-III test, the initial inclusion of 10% of children with developmental delay in a normative population might lead to underestimation of developmental delay, accounting for the decreasing discrepancy between the two test scores as the average scores increase. According to recent studies on the Flynn effect, the score generally has a tendency to decrease, and children have a smaller score change than adults [12]. This paper warns that applying group-level data to individual practice can have different effects. More research is needed to determine how changes in demographic characteristics have contributed to the evaluation of children's performance in the second and third editions.
When Bayley-III scores were used rather than BSID-II scores, the proportion of children classified as having normal development (≥85) increased from 30.6% to 43.5% for cognitive development and from 6.5% to 12.9% for motor development (Table 3). In particular, the proportion of children classified as having severe developmental delay, defined as a composite score under 55, declined from 41.9% to 16.1% for CLC scores and from 59.7% to 32.3% for MC scores (Table 3). Additionally, the cutoffs for the Bayley-III defining mild, moderate, and severe cognitive/language developmental delays were 87.3, 78.0, and 67.0 rather than 85, 70, and 55 in the BSID-II MDI, respectively. Therefore, the gaps between the two tests are 2.3, 8.0, and 12.0, with the gap increasing with the severity of the developmental delay. However, most previous studies focused on children with scores <70, with only one study [11] reporting the Bayley-III CLC score to be 22 points higher than the BSID-II MDI score equivalent of 50. A Bayley-III CLC score of 105, which is equivalent to a BSID-II MDI score of 100, is reported to be only 5 points higher [11]. They reported that the difference was more pronounced in children with lower abilities. Children with low abilities especially should be aware of the standardization and interpretation of Bayley-III scores. So far as we know, three studies have provided a formula to convert BSID-II scores to Bayley-III scores [9,11,13]. All studies reported higher Bayley-III scores, with the differences more pronounced in the lower range. Factors that differ in the conversion equation in each study include the age of the study population at evaluation, the method used to obtain the BSID-II and Bayley-III scores, and the age at which the evaluation was conducted.
Although there have been studies comparing BSID-II with Bayley-III, most studies have focused on preterm or limited to cognitive composite. The cognitive and language score of Bayley-III at 2 years old was recently reported to be correlated with the Wechsler Preschool and Primary Scale of Intelligence third edition (WPPSI-III) IQ score at 4 years with correlation coefficient of 0.81 and 0.78, respectively [14]. While previous studies have suggested cutoff scores for cognitive/language scales, our study presents not only the cognitive and language composite, but also the cutoff score for the motor composite. This is a study of the relationship between BSID-II and Bayley-III in children with suspected developmental delays, and it differs from previous studies in that the study population was considered as a child suspected of delayed development of less than a developmental quotient of 70 according to a developmental screening test of one or more of the developmental domains. Therefore, our current report is the first to determine a cutoff for the Bayley-III in children with suspected developmental delay, with most previous studies focusing on preterm or high-risk children.
Some limitations to our present analyses must be mentioned. We could not evaluate the long-term developmental outcomes so we could not conclude whether the Bayley-III underestimates and/or whether the BSID-II overestimates developmental delay. Second, the relatively small number of children (n=62) limited the ability of our current study to detect small effects. The number of cases of obtaining statistically appropriate sensitivity and specificity is estimated to be 125, and the number of cases used in this study is less than 125, so it is possible that an inaccurate estimation has occurred. However, when the sample size is very small (n<30), the marginal error is known to increase so greatly that this statistical technique cannot be used [15]. In this study, inclusion of more than 30 patients avoided a large marginal error. Lastly, we focused on children with suspected developmental delay who belonged to various disease groups. Our findings need to be verified with larger numbers identifying the age and gestation-groups.
In conclusion, we recommend diligence when interpreting Bayley-III scores in children with suspected developmental delay because the Bayley-III underestimates developmental delay compared with the BSID-II. We suggest that the cutoff for the identification of moderate cognitive developmental delay using Bayley-III CLC scores be raised from 70 (nominally less than 2 SDs) to 78.0, the number that showed the best predictive power in our current study. Additionally, the cutoff for the identification of mild and severe developmental delay using Bayley-III CLC scores should be raised from 85 to 87.3 and from 55 to 67.0, respectively. The cutoff for the identification of moderate and severe developmental delay using Bayley-III MC scores should be raised from 70 (nominally less than 2 SDs) to 80.0 and from 55 to 68.5, respectively. Further investigation of long-term outcomes is needed to determine which evaluation version is a better predictor of motor and cognitive development.