


INTRODUCTION
Cerebral palsy (CP) is defined as “a group of permanent disorders of the development of movement and posture, causing limitations to activity, that are attributed to non-progressive disturbances that have occurred in the developing fetal or infant brain” [1]. Overall we have noted that a decline in activity leads to muscle weakness, muscle atrophy, and muscle shortening, all of which can further cause activity limitations.
The muscle strength is generally impaired in individuals with spastic CP [2,3,4,5]; the muscle weakness results in reduced functional ability in these individuals [6,7,8]. The selective motor control and cognitive problems typical of this disorder make it difficult to quantify the muscular strength of individuals with CP; therefore, research has been targeted towards muscle morphology and structure in CP [9,10]. There is subsequent consistent evidence to suggest that the size of the muscles in the paretic limbs, as indicated by muscle volume, cross-sectional area, and thickness, is therefore reduced compared to both normal developing muscles and non-paretic muscles [10]. The deficits in muscle size in CP are likely to increase as the infant gets older [11]. The cycle of disuse and inactivity in children and adolescents with CP is often made permanent by the progressive development of weakness and contractures, leading to the onset of a significant progressive disability over the patients' lifespan [9,11].
A previous report suggested that changes in the muscle structures are related to motor function in older children, adolescents, and adults with CP [12,13,14]. Furthermore, this relationship is also reported to be associated with muscle thickness (MT) in older children and adolescents with CP, which enables quantitative muscle evaluation, showing a direct positive relationship with activity [10,12]. However, it remains unclear when the structure of the muscle begins to change in children with CP, and how the changes of the muscle progress with time. In addition, there is little information that is known about the influence of the muscle structure on motor function in young children with CP.
The aim of this study was to investigate the significant relationship between functional level and MT in young children with CP.
MATERIALS AND METHODS
Subjects
Children with spastic CP who were admitted to, or who had visited, our hospital facility were recruited for this study upon fulfilling the following inclusion criteria: (1) the participant was diagnosed with spastic CP and (2) the participant was aged 3 to 6 years old. The exclusion criteria for this study were as follows: (1) CP combined with muscular disease, (2) previous history of muscle trauma, (3) previous history of surgical intervention of the lower extremities, and (4) previous history of chemodenervation therapy within 6 months.
The age-matched children who attended our hospital affiliated day care center who were noted with typical developing muscles, were recruited for this study as controls (typical development [TD] group). The participants were able to walk independently; potential participants were excluded if they had a history of lower leg injury or any other developmental disorder affecting the lower limbs.
An ethical approval was granted by the Institutional Review Board and Ethics Committee of Bundang Jesaeng General Hospital (No. RM17-02). As all of the children in this study were younger than 18 years of age, an informed consent form and agreement was obtained from their parents for participation of their children in the study.
Measurements
On initial examination, the height and weight of each participant was measured and recorded.
The thickness of the rectus femoris (RF), medial gastrocnemius (GCM), and lateral GCM muscles was measured with a B-mode ultrasound imaging device (LOGIQ E9; General Electric Healthcare, Milwaukee, WI, USA), using a 6–15 MHz linear transducer. The MT was defined as the longest distance between the upper muscular fascia and the lower muscular fascia that was visible on the image [15]. The transverse image was used to measure the thickness of the RF and GCM (Fig. 1). In the transverse image of the RF muscle, the probe was positioned at 50% of the distance between the anterior superior iliac spine and the superior border of the patella. The participants rested comfortably in the supine position with the knee joint near the natural resting position of 10°; furthermore, a towel roll was placed under the knee as required for positioning or to aid in comfort and muscle relaxation. The transverse images of the GCM muscle were taken at 25% of the tibial length from the popliteal fossa. The subjects were positioned prone on the examination table, with their feet hanging over the edge enabling a resting ankle position. During the measurement, extreme care was taken to maintain the study individuals in a standardized position. The pressure of the transducer was kept to a minimum by using a generous amount of contact gel, and by observing the measured real-time ultrasonic images as noted, to eliminate distortion of the skin and subcutaneous tissues due to excess compression [15]. All MT measurements were performed by the same rehabilitation physician.
The activity limitations of the participants were evaluated by the Gross Motor Function Classification System (GMFCS), Gross Motor Function Measurement-88 (GMFM-88), and mobility area by the Korean version of the Modified Barthel Index (K-MBI). The spasticity in the knee extensors and ankle plantar flexors in both legs was assessed with the Modified Ashworth Scale (MAS) by a single physician.
The GMFM-88 is a criterion-referenced observational measure for the assessment of children with CP [16]; it consists of 88 items grouped into five dimensions: lying and rolling; sitting; crawling and kneeling; standing; and walking, running, and jumping. The scale was therefore proposed to quantitatively evaluate gross motor function of the participants. The score for each dimension is expressed as a percentage of the maximum score for that dimension as analyzed in this study. The total score is calculated by averaging the percentage scores across the five dimensions, range from 0 to 100.
During the GMFM-88 evaluation, the GMFCS was also assessed. The GMFCS was developed by the Palisano et al. [17] study to classify the degree of gross motor impairment of children with CP into five levels. The distinction that is noted and established between each level is based on the ability to move and the need of supporting devices.
The K-MBI was used to assess activity and participation levels. We note that generally compared to other evaluation tools, it is widely used due to its simplicity of evaluation, accuracy, speed, consistency, and ease of statistical processing of analyzed data and information [18]. The K-MBI consists of 10 areas of functioning, and scores indicate the degree of independence. The application of the K-MBI in children might be limited, although it is used as a criterion to determine the disability level of infants and children with brain lesions because, the K-MBI was originally designed to assess the daily living of adults. However, it has discriminative power in the evaluation of ambulation or wheelchair, transfer, and stair climbing of infants and children of CP [19]. In this case, we only used the mobility area including the ambulation or wheelchair, transfer, and stair climbing scores, ranging on a measured scale from 0 to 40.
Statistical analysis
The statistical software SPSS version 18.0 for Windows (SPSS Inc., Chicago, IL, USA) was used for statistical analysis of the data. An independent t-test was used to determine the differences between the CP and the TD groups. The relationship of MT with age and body mass index (BMI) was assessed utilizing a Spearman rank coefficient, and the differences in sexes were subsequently compared using an independent t-test. The correlations between the MT and functional level (GMFM, GMFCS, mobility scores of K-MBI) were assessed by partial correlation coefficients adjusted for age and BMI. A Mann-Whitney U-test was used to determine a difference in MT between the CP and TD groups, depending on age. The significance level was set at p<0.05.
RESULTS
Characteristics of participants
The present study included 50 legs from 26 children with spastic CP, of which 14 male and 12 female. The mean age of the participant group was 50.57±10.26 months. The TD control group consisted of 50 legs from 25 age-matched peers (mean age, 49.50±11.38 months). Table 1 demonstrates comparisons of the anthropometric measurements between the CP and TD groups. The CP and TD groups did not significantly differ by age (p>0.05); however, height, weight, BMI, and MT of RF and the medial and lateral GCM were significantly higher in the TD group (p<0.05).
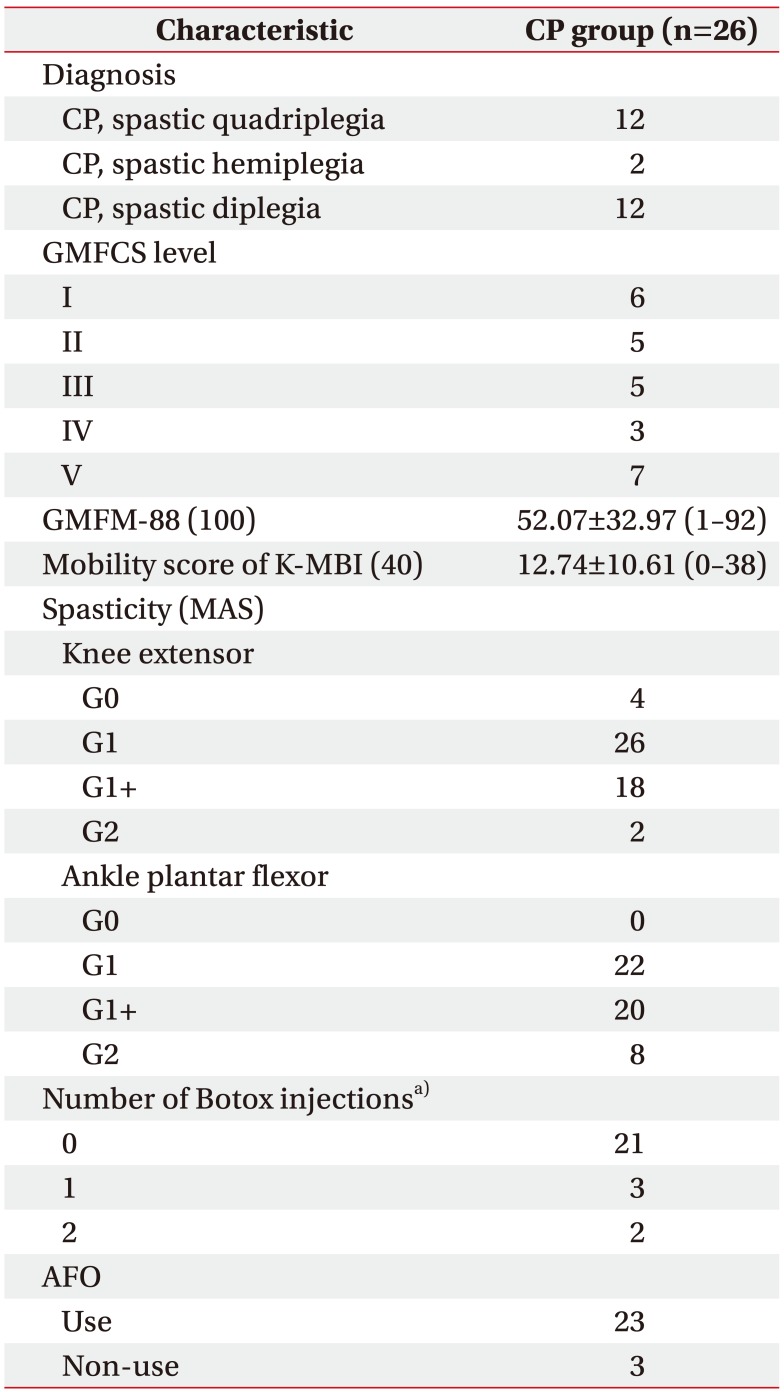
The characteristics of the CP group are shown in Table 2. Regarding the types of CP, 12 subjects had spastic quadriplegia, 2 had spastic hemiplegia, and 12 had spastic diplegia. According to the GMFCS, 6 subjects were at level I, 5 were at level II, 5 were at level III, 3 were at level IV, and 7 were at level V. Twenty-one of the subjects had no history of Botox injections, 3 subjects had undergone a Botox injection once previously, and 2 subjects had undergone Botox injections twice previously. All of the Botox injections had occurred more than 6 months prior to this study. In addition, there were 23 subjects who used an ankle foot orthosis (AFO), whereas 3 subjects did not use an AFO.
The median score of the GMFM-88 and mobility area of K-MBI were 52.07±32.97 (range, 1–92) and 12.74±10.61 (range, 0–38), respectively.
Relationship between the muscle thickness and the gross motor function
There was no significant difference in MT between males and females (p>0.05).
In the CP group reviewed, the age of the participants showed a significant correlation with the MT of the RF (r=0.446, p=0.001), medial GCM (r=0.373, p=0.001), and the lateral GCM (r=0.406, p=0.001), respectively. The BMI also showed a significant correlation with the MT of the RF (r=0.582, p<0.001), medial GCM (r=0.567, p<0.001), and the lateral GCM (r=0.546, p=0.001), respectively. Therefore, the measurements of the age and BMI of participants were used as adjusting variables in this study.
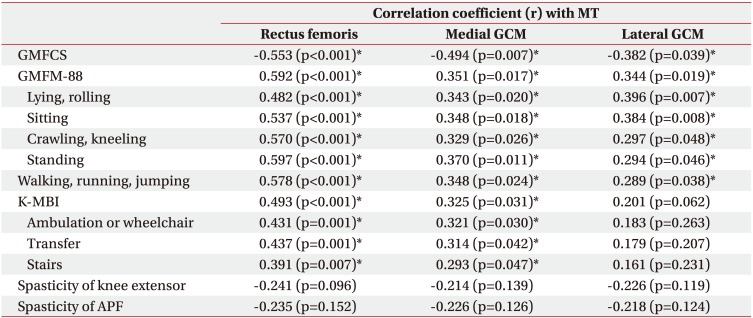
Table 3 demonstrates the direct relationship between the thickness of each muscle with the GMFCS, GMFM-88, and mobility scores of the K-MBI in individuals with early CP.
MT of the RF significantly correlated with the GMFM-88 score (r=0.592, p<0.001). There were also significant correlations between the MT of the RF and both GMFCS (r=−0.553, p<0.001), and the mobility scores of the K-MBI (r=0.493, p<0.001). MT of the medial GCM showed a significant correlation with the GMFM-88 score (r=0.351, p=0.017). There were also significant correlations also between the MT of the medial GCM and both GMFCS (r=−0.494, p=0.007), and mobility scores of the K-MBI (r=0.325, p=0.031). MT of the lateral GCM showed a significant correlation with the GMFM-88 score (r=0.344, p=0.019) and GMFCS (r=−0.382, p=0.039). However, the MT of the lateral GCM showed no significant correlation with the mobility scores of the K-MBI (r=0.201, p=0.062).
Although there was a tendency towards a lower RF, medial GCM, and lateral GCM MT with increasing MAS ratings in knee (r=−0.241, r=−0.214, and r=−0.226, respectively) and ankle (r=−0.235, r=−0.226, and r=−0.218, respectively), the correlations were not statistically significant (p>0.05).
Comparison CP and TD groups depending on age
Fig. 2 demonstrates the height, weight, and MT of the RF, medial GCM, and lateral GCM in the CP and TD group depending on age. There were no statistically significant differences in the height, weight, and MT of RF and GCM between CP and TD participants aged 3 years old (p>0.05). However, it was noted that the CP participants aged 4, 5, 6 years old are shorter and lighter than participants of a similar age in the TD group, and had a smaller MT of the RF and GCM (p<0.05), independently. The results demonstrated that the deficits in MT in CP are likely to increase as the children grow older, and the differences in MT will be expected to gradually increase during growth.
DISCUSSION
To the best of our knowledge, this is the first study to indicate a relationship between MT and motor function in young children (aged 3–6 years) with CP. The results demonstrated a direct relationship between MT of the RF and the GMFCS, GMFM-88, and the measured mobility scores of K-MBI in young children with CP. In previous studies, significant relationships have been found to exist between muscle morphological parameters, strength, and function in older children, adolescents and adults with spastic CP. The research of Ohata et al. [12] indicated a significant relationship between quadriceps MT and activities evaluated by the GMFM-66 and the Pediatric Evaluation of Disability Inventory (PEDI) in older children and adolescents with CP; the thickness of the quadriceps femoris muscle was suggested to be a useful quantitative muscular evaluation in CP. The study of Moreau et al. [13] demonstrated a strong relationship between the thickness of the vastus lateralis and knee extensor voluntary strength in children aged 7–19 years old with spastic CP. Furthermore, the study of Ohata et al. [14] suggested that the MT of the quadriceps femoris, longissimus, and triceps surae muscles were significantly different according to the GMFCS level. The similar findings in the present study showed that MT is related to functional level in young children with spastic CP, as have been confirmed and noted in previously studies in late childhood, adolescent and adult CP.
In the present study, the MT of the RF and the GCM was found to be significantly lower in children who were 3 to 6 years old with CP than in age-matched children with TD (Table 1). The study of Malaiya et al. [20] reported that the medial GCM is shorter and smaller in the paretic limb of older children with CP (mean age, 8 years) than in age-matched TD children; which typified a 35% reduction in medial the GCM muscle volume which was observed. In addition, a study by Barber et al. [11], suggested a 22% reduction in the medial GCM muscle volume in children with CP (mean age, 4 years). We began to postulate at which point in time the structure of the muscle begins to change in children with CP, and how those changes in muscle structure progress with time. Overall, we created and organized classifications depending on age and comparisons of CP with TD (Fig. 2). The results of this study demonstrated that there were no significant differences between the MT of the RF and GCM in CP and TD children aged 3 years old. However, we noted in this study that MT was significantly reduced in 4, 5, 6 years old with CP compared TD, independently. These results can be assumed that there is little difference at a young age, but the difference of MT with CP from TD group progress over time during the growth spurt due to muscle weakness and disuse atrophy. In addition, these differences were further associated with gross motor function; therefore, at the time of the growth spurt, suitable exercise interventions including concentrated training of muscle strengthening may be required. However, we have noted that the number of subjects of 3 years old with CP in this study were smaller than other age group, and they had relatively higher motor function (GMFCS level I or II). Therefore, we note that it is difficult to generalize about the time frame at which point the MT had begun to change. Further studies for large sample sizes and covering heterogenicity will be required to generalize this result, and make further predictions and assumptions on the topic.
The correlations of MT and motor function are reviewed and comprehensively evaluated in this study. However, it is not clear whether the MT determines the activity level, or if the incidence of an impaired gross motor function leads to muscle atrophy. Although the perinatal brain lesion of CP is not progressive, it results in secondary muscular pathologies such as reduced muscle volume and muscle belly length [10]. The mechanisms behind the development and progression of muscle weakness and contracture corresponding to aged-related impaired motor function in individuals with CP are complex, but the results are attributable that the combination of altered neural mechanisms and muscular factors, which are related [4,10]. Muscle weakness is not caused by reduced muscle size alone, but also by reduced muscle activation and the situation or case of increased co-activation [21]. Therefore, the degree of muscle development may have determined the level of motor function in the early stages of CP.
We examined the RF and the GCM group of muscles. The quadriceps femoris are particularly important for transitioning from sitting to standing, ascending and descending stairs, and for antigravity control during the stance phase of gait, among other functional activities [22]. The quadriceps and GCM muscles, as weight-bearing muscles, are the most affected by inactivity and disuse in humans due to their antigravity function [23,24]. Therefore, it is possible that the muscle architecture is altered in these same muscles in a child with CP, because of an associated muscle disuse and low activity levels noted in the participants. This suggestion is supported by the finding of the largest correlation coefficient that is found to have existed between the GMFM and standing (r=0.597) in the present study.
In this study, a significant relationship occurred between MT and functional level, except between the lateral GCM and the K-MBI. It was considered that the lateral GCM was seen as significantly much thinner than the medial GCM, and the distribution range was relatively small.
We note that the 2D B-mode ultrasonography is easy, quicker, and simpler when used to perform this review and analysis, when compared with magnetic resonance imaging and computed tomography. The measurements of MT using 2D ultrasonography exhibited excellent reliability in evaluating the children and adolescents with CP [9,25]. In agreement, the previous studies have shown that measurements of MT obtained using 2D ultrasonography are useful for estimating muscle volume in different muscle groups [9,25,26]. Looking at the results of direct relationship the MT and motor function, it has been noted that the measurements of the MT with ultrasonography may be helpful evaluating the level of function in young children, with CP whom measurement of muscle strength is difficult due to cognitive and selective motor control problems.
This study has reviewed and recognized some specific limitations. First, we performed measurements on only one standardized area per muscle; it has been shown that muscle architecture can vary throughout its length [9,27]. Second, the study was limited to evaluate MT in the participant population. We noticed that other muscle structures, such as muscle fascicle length and the pennation angle, were not therefore evaluated; however, the measurement of muscle volume is a good predictor of the maximal force generating capacity [28], and is related to MT [14]. Third, the study was limited to the review and study of the RF and GCM muscles; therefore, the relationship between other muscles including hamstring and iliopsoas and motor function in young children with spastic CP remains unclear at this time. The fourth limitation is the small sample size of the participant population. A larger sample size may provide greater power for examining the relationships between MT and functional level in study participants, to show associative outcomes that can be expected or predicted in general populations.
In conclusion, we offer and note that this study demonstrated that a positive correlation has occurred between the MT of the RF and GCM, and the functional level in young children with CP. In young children with CP, MT was thinner than in age-matched children with TD. Consequently, we understand that the differences in MT gradually increase in children aged 4–6 years old, after the growth spurt. Therefore, we confidently suggest that muscle strengthening exercises in the lower extremities, including the quadriceps femoris and GCM muscles, should be undertaken to facilitate muscle growth in young children with CP. We therefore postulate that this would prevent muscle atrophy and increase functional level, activity, and participation in their daily lives.