Proposed Use of Thickener According to Fluid Intake on Videofluoroscopic Swallowing Studies: Preliminary Study in Normal Healthy Persons
Article information
Abstract
Objective
To examine the characteristics and changes in the pharyngeal phase of swallowing according to fluid viscosity in normal healthy persons, to help determine fluid intake methods in more detail than the use of standardized fluid.
Methods
This was a prospective observational study involving 10 normal healthy adults. While the participants sequentially took in fluids with 10 different viscosities changes in the pharyngeal phase of the swallowing process were monitored using videofluoroscopic swallowing studies (VFSS). Twenty parameters of the pharyngeal phase, including epiglottis contact, laryngeal elevation, pharyngeal constriction, and upper esophageal sphincter opening, were determined and compared.
Results
No significant viscosity-based changes in epiglottis contact, laryngeal elevation, or upper esophageal sphincter-opening duration of the pharyngeal phase were observed. However, pharyngeal transit time and time from the start of the pharyngeal phase to peak pharyngeal constriction were significantly delayed upon intake of fluid with viscosities of 150.0 centipoise (cP) and 200.0 cP.
Conclusion
VFSS analysis of fluid intake may require the use of fluids of various concentrations to determine a suitable viscosity of thickener mixture for each subject.
INTRODUCTION
Dysphagia is common in the presence of central nervous system anomalies. It is observed in over 50% of cases of cerebrovascular accident (CVA), 44% of multiple sclerosis cases, 60% of patients with amyotrophic lateral sclerosis, 50% of traumatic brain injury patients, and in 84% of patients with other neurodegenerative diseases [12]. In particular, dysphagia following a CVA is often encountered in rehabilitation medicine, where it presents great difficulties in maintaining quality of life and supplying nutrition, with an increased risk of serious clinical problems such as asphyxia, aspiration pneumonia, and malnutrition [3]. Aspiration of food or saliva due to dysphagia can lead to respiratory infections, i.e., pneumonia. According to one study, the prevalence of pneumonia in patients with dysphagia was 19%, compared to 8% in those without dysphagia [4].
Videofluoroscopic swallowing study (VFSS) is generally accepted as the gold standard technique in the diagnosis and treatment of dysphagia [5]. VFSS facilitates comprehensive evaluation of the active features of the oral cavity, pharynx, and esophagus.
Despite the fact that fluid intake test is critical for determining the possibility of a fluid diet and water intake, such tests frequently involve only a few viscosities and do not take into consideration the safest and optimal viscosity. This leads to inconsistencies between fluid intake results by VFSS test and the patient's actual fluid intake pattern, which can lead to aspiration pneumonia. A related study reported that during an ultrathin fluid test in patients in whom intake of thin fluids was safe, aspiration occurred in 50% of the cases [6]. Although it might be more appropriate to use ultrathin fluid to determine the safety of water intake, accurate observations by fluoroscopy are difficult, and accurate measurement of viscosity in the stepwise treatment process is problematic. Thickeners are used clinically when aspiration of thin fluid, but not thick fluid, is observed. However, the fact that thickener viscosity is generally not measured accurately can lead to difficulties at the bedside. Aspiration can occur if the thickener has inadequate viscosity, which unnecessarily delays treatment of dysphagia. In addition, according to the test diet standards of the American Dietetic Association, because the difference in viscosity between thin and thick fluid is excessive, the correlation between the actual test results and their clinical application is insufficient [7]. The first aim of our study was to determine the safest fluid viscosity for optimal rehabilitation for dysphagic patients who have difficulty swallowing fluids.
Use of thickeners with more appropriate viscosity, based on intake tests using fluids of different viscosities, would improve the treatment of dysphagic patients by allowing safer fluid intake and reducing the risk of aspiration pneumonia. Therefore, the present study aimed to determine a method of the selection of thickeners to optimize the viscosity of dietary fluid intake for dysphagic patients by assessing using the VFSS test the characteristics and pattern of changes in the swallowing process of normal healthy adults when drinking fluids with various viscosities.
MATERIALS AND METHODS
Participants
This was a prospective observational preliminary study. The participants consisted of 10 healthy adults (8 males and 2 females; mean age of 37.2±5.1 years). The study was conducted after receiving the approval of the Institutional Review Board. None of the participants had any swallowing, neurological, or gastrointestinal disorders. To ensure the accuracy of the examination, food intake was prohibited for 4 hours and liquid intake, including water, for 2 hours prior to the examination.
Procedures
All procedures were performed using a properly collimated radiographic-fluoroscopic unit KF-7 (Shimadzu Corporation, Kyoto, Japan) providing 63 kV, 1.2 mA-type output for the full field-of-view mode (12 inch input phosphor diameter). Studies were conducted in the fluoroscopic contrast study room of our radiology department, with a licensed radio-technician and occupational therapist performing the examination in a space shielded by lead under the supervision of a doctor of rehabilitation medicine. The VFSS images were recorded as high-definition digital files, using a Samsung HMX-H405 camcorder operating at 30 frames per second. The recorded images were replayed from a PC and analyzed by the authors by taking measurements at 1/100 second on the Adobe Premiere 6.5 multimedia player.
The examinations were conducted with the participants seated sideways on a chair attached to the fluoroscopy unit. The head position was set to neutral, facing forward, and metallic items were removed to prevent artifacts. A lead apron was worn to protect the reproductive organs. The boundaries of the fluoroscopic field of the lateral posture were set as lips anteriorly, nasopharynx superiorly, cervical spine posteriorly, and cervical esophagus inferiorly (Fig. 1).

Boundaries of the lateral fluoroscopic view.
To reduce errors in the VFSS examination, the method used involved intake of liquid with a specific viscosity, followed by examination with a different concentration 3 minutes later, with sequential intake of liquids of 10 concentrations. The viscosity of BaSO4 used in the examination was set to 5.0, 10.0, 20.0, 30.0, 40.0, 50.0, 75.0, 100.0, 150.0, and 200.0 centipoise (cP), to ensure inclusion of the viscosity of the commercialized fluid widely used in VFSS examinations. A 10 mL volume of fluid of each viscosity was administered.
The viscosities of the test materials were checked and the concentration curves assessed using a viscometer DV-II+Pro (Brookfield Engineering Laboratories, Middleboro, MA, USA) (Fig. 2).

The curve of viscosity and BaSO4 dissolved in water (100 mL). The temperature was 21.8℃±2.1℃.
Measures
Previous researchers used different definitions of the pharyngeal phase of swallowing [89]. In the present study, we used the posterior nasal spine as a landmark for the beginning of the pharyngeal phase, and the moment when the upper esophageal sphincter (UES) closes and the bolus has fully entered the esophagus as the end of the pharyngeal phase [8]. Thus, the pharyngeal transit time (PTT) was defined as the interval from the beginning of the pharyngeal phase to closure of the UES. The epiglottis contact was defined as the arrival of the bolus head in the valleculae. The latency of laryngeal elevation (LLE) was defined as the interval from the beginning of the pharyngeal phase to laryngeal elevation. The peak laryngeal elevation was defined as the maximal point of anterior and superior excursion of the larynx during swallowing [8]. The rise time of laryngeal elevation was defined as the interval from the latency of laryngeal elevation to the latency of peak laryngeal elevation. The duration of laryngeal elevation was defined as the interval between the initiation and the end of laryngeal elevation. As the bolus is propelled into the upper esophagus, the pharynx is typically completely obliterated by the tongue, which pushes against the contracting posterior pharyngeal wall. Pharyngeal constriction was defined as the beginning of pharyngeal wall and soft palate constriction. Peak pharyngeal constriction was defined as the moment when the anterior-posterior diameter of the pharyngeal wall becomes narrowest [9]. The rise time of pharyngeal constriction was defined as the interval from the latency of pharyngeal constriction to the latency of peak pharyngeal constriction. The UES opening was identified as the moment when the narrowest part of the upper esophagus (between C4 and C6) opened; this opening is the most functionally significant [89].
We measured the values of 20 distinct timing variables during the pharyngeal phase of swallowing. Table 1 shows the abbreviations and definitions used [8].
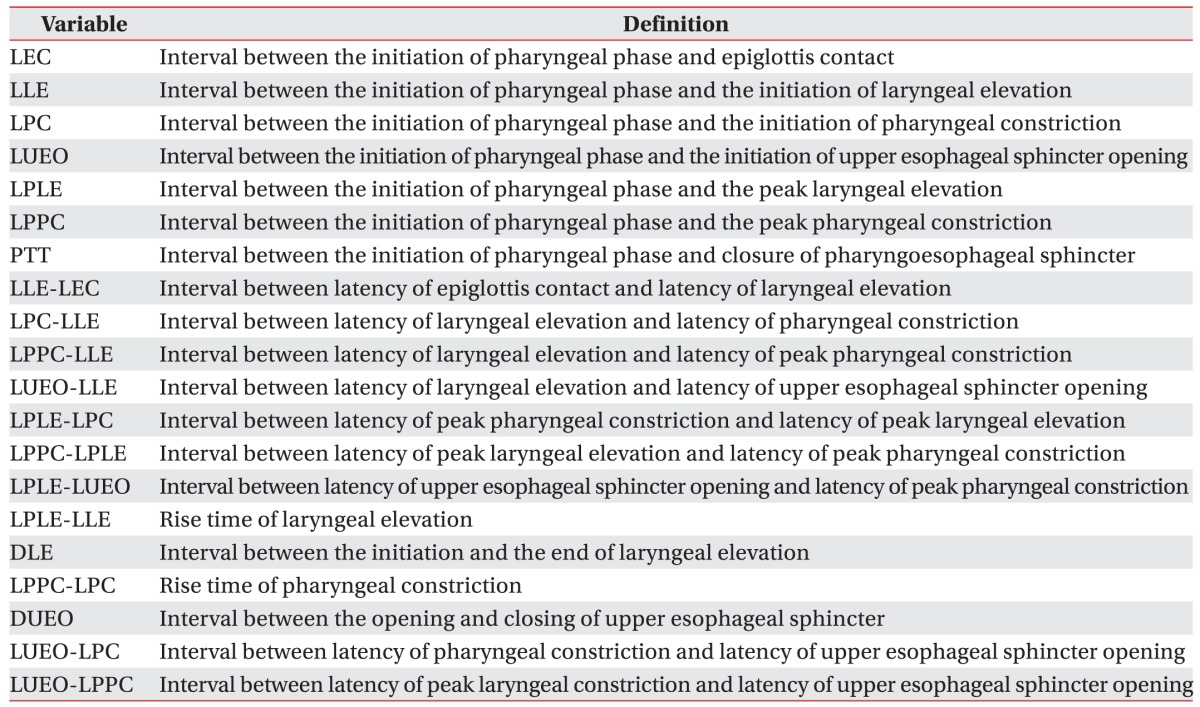
Abbreviations and definitions
Statistical analysis
The SPSS ver. 21.0 software (IBM, Armonk, NY, USA) was employed for statistical analyses. Firstly, differences in 20 parameters among the viscosities were analyzed by ANOVA. If any parameter had significant differences across bolus viscosity, the Bonferroni method was used for post hoc analysis. Values were presented as means±standard deviation. A significance level of α=0.05 was determined.
RESULTS
The interval between the initiation of the pharyngeal phase and epiglottis contact (LEC); laryngeal elevation (LLE); pharyngeal constriction (LPC); and upper esophageal sphincter opening (LUEO) did not differ significantly according to viscosity. The interval between the initiation of the pharyngeal phase and the peak laryngeal elevation (LPLE) also did not show a statistically significant difference according to viscosity (p>0.05).
However, the interval between the initiation of the pharyngeal phase and the peak pharyngeal constriction differed significantly according to viscosity. In particular, delays were observed at viscosities of 150.0 and 200.0 cP (p<0.05).
Furthermore, the PTT differed significantly according to viscosity. In particular, statistically significant delays were observed at viscosities of 150.0 and 200.0 cP (p<0.01).
The gaps between LLE-LEC, LPC-LLE, LPPC-LLE, LPLE-LPC, LPPC-LPLE, LPLE-LUEO, and LPLE-LLE, which express the intervals of each movement, did not differ significantly according to viscosity (p>0.05).
The interval between the initiation and the end of laryngeal elevation (DLE) and the interval between the opening and closing of the upper esophageal sphincter (DUEO) also did not differ significantly according to viscosity (p>0.05). The intervals of LPPC-LPC, LUEO-LPC, and LUEO-LPPC, which express the gaps between each movement, also did not differ significantly according to viscosity (p>0.05).
The results described above are shown in Table 2, Figs. 3 and 4.
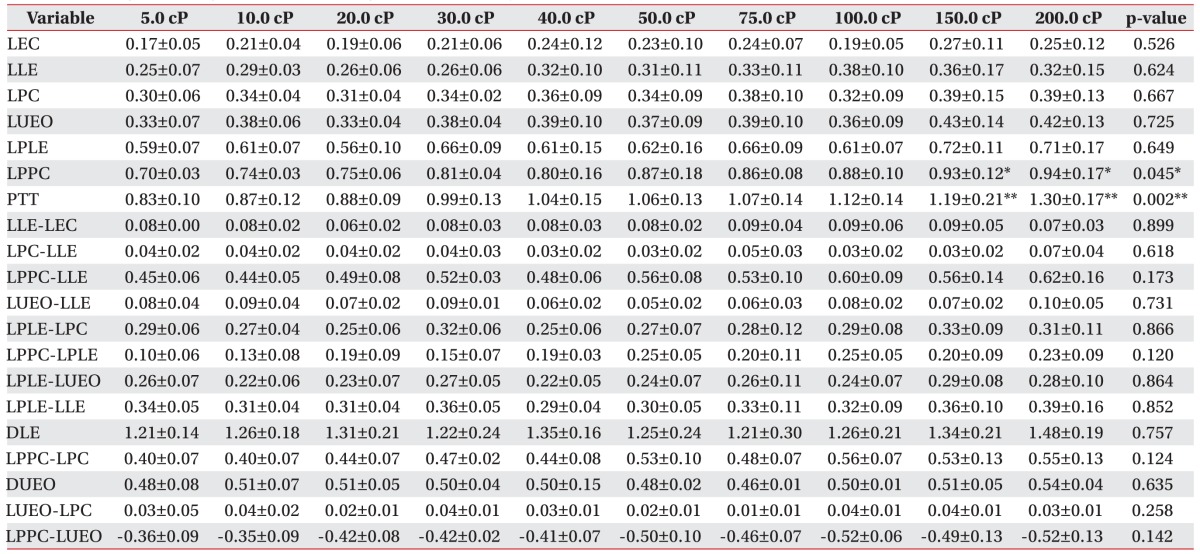
Findings of timing variables according to liquid viscosity in normal subjects (unit, s)

Findings of timing variables according to liquid viscosity in normal subjects. LEC, latency of epiglottis contact; LLE, latency of laryngeal elevation; LPC, latency of pharyngeal constriction; LUEO, latency of upper esophageal sphincter opening; LPLE, latency of peak laryngeal elevation; LPPC, latency of peak pharyngeal constriction; PTT, pharyngeal transit time. a)p<0.05 at 150 cP on LPPC, b)p<0.05 at 200 cP on LPPC, c)p<0.01 at 150 cP on PPT, d)p<0.01 at 200 cP on PPT.

Findings of timing difference variables according to liquid viscosity in normal subjects. LEC, latency of epiglottis contact; LLE, latency of laryngeal elevation; LPC, latency of pharyngeal constriction; LUEO, latency of upper esophageal sphincter opening; LPLE, latency of peak laryngeal elevation; LPPC, latency of peak pharyngeal constriction; PTT, pharyngeal transit time; DLE, duration of laryngeal elevation; DUEO, duration of upper esophageal sphincter opening.
DISCUSSION
This study was conducted to provide guidelines on fluid intake by determining the optimal viscosity of thickener to use in clinical settings based on the kinematic changes in the pharyngeal phase observed on VFSS when normal healthy adults took in fluids with various viscosities. In 2002, the American Dietetic Association established the National Dysphagia Diet (NDD) guidelines for thickened dietary supplements [7]. According to these guidelines, thin fluid should be 1-50 cP, Neckar-like fluid 51–350 cP, honey-like fluid 351-1,750 cP, and thick fluid >1,750 cP. The appropriate viscosity of fluid for dysphagic patients for intake or testing is determined on this basis. However, the fluid used in tests conducted at most hospitals use a commercialized viscosity, and phased diets for dysphagia severity are prescribed according to the guidelines of the nutritional unit of each hospital. Therefore, regarding the possibility of fluid intake associated with hydration, conducting tests with only a few commercialized fluids makes determining the safest fluid viscosity for dysphagic patients problematic. When testing with thick fluid shows laryngeal penetration without definite aspiration, and testing with thin fluid shows definite aspiration, this creates a dilemma on how to determine the appropriate fluid viscosity for that dysphagic patient. Moreover, a rough visual determination of the viscosity of a thickened mixture can be required, which can in extreme cases lead to development of aspiration pneumonia.
Most rehabilitation units use commercialized thickener powder to prevent dehydration in dysphagic patients by enabling them to drink a sufficient quantity of water. This thickener is used mainly when mild penetration without definite laryngeal aspiration with thick fluid, and definite aspiration with thin fluid, is seen on VFSS. However, because the exact viscosity is not set, the mixture can easily be made too thin, increasing the risk of aspiration pneumonia.
Increasing the bolus viscosity reduces the laryngeal penetration of the bolus, which decreases the risk of aspiration and significantly improves the stability and efficiency of deglutition [10]. Moreover, increasing the viscosity has been reported to reduce the risks of laryngeal penetration or aspiration by extending the oral and pharyngeal phase transit time, delaying pharyngoesophageal sphincter (PES) opening, and increasing the duration of pharyngeal peristaltic waves [11]. However, it also increases the risk of post-swallowing aspiration by increasing the amount of post-swallow residue in the pharynx, which leads to the use of compensatory mechanisms such as the chin tuck [11]. In addition, observations of the pharyngeal phase of the process by computed tomography using thin and thick fluid showed a greater difference in true vocal cord closure with thin than thick fluid, while there were no significant changes in epiglottis movement, hyoid movement, and PES opening duration [12]. This suggests that the pharyngeal transit time is reduced with thin fluid, which leads to more rapid true vocal cord closure to reduce the aspiration risk. However, the limited range of viscosities used in the above studies, prevents determination of the viscosity that induces significant changes in parameters. As such, this study used fluids of a wide range of viscosities.
According to our results, intake of a thin-fluid mixture that contained barium (viscosity, 50 cP) and thickfluid mixture that contained barium (viscosity, 250 cP), resulted in an increase in PTT and delayed peak pharyngeal constriction at viscosities of 150 cP and ≥200 cP, respectively. Moreover, parameters such as epiglottis movement and laryngeal elevation were not affected by fluid viscosity. These results are consistent with previous reports. However, there was a significant difference with intake of fluid of 150–200 cP, which would be considered a mid-thick viscosity fluid [9]. Therefore, tests using fluid of mid-thick viscosity would enable a strategy for increasing fluid intake to be established.
When fluid is taken in at the bedside, a commercial thickener is commonly used. If aspiration is observed with thin but not thick fluid, we suggest that fluid of viscosity 150–200 cP be used, which would enable safer fluid intake training. When fluid is taken in, significant differences in PTT and the time to reach peak pharyngeal constriction are observed at viscosities ≥150 cP, suggesting that this can also be applied to the thickener.
The limitations of this study were as follows. First, bolus volume was not varied. According to Clave et al. [10], bolus volume significantly affects the stability and efficiency of deglutition. However, a set volume of 10 mL was used in this study. Therefore, a range of bolus volumes should be evaluated in future studies. Second, the appropriate viscosity was not verified in actual dysphagic patients. This warrants follow-up studies in patients capable of fluid intake to identify the optimal viscosity for individual dysphagic patients.
According to Lazarus et al. [13], normal persons showed a longer cricopharyngeal opening on paste boluses, while dysphagic patients did not show these changes. This may be because the motor-sensory pathways controlling these systematic swallow variations have been compromised in these patients. Therefore, our results may not be applicable to all patients with dysphagia. Future studies should focus on validating our results in patients with actual swallowing difficulties, and this is planned as a future research project. In addition, when PTT is delayed, the risk of aspiration increases. Patients with dysphagia are likely more vulnerable than normal persons because of their altered motor-sensory pathway.
Third, poor fluoroscopic imaging quality was seen with very-low-viscosity fluid, which made the images indecipherable. This is a technical issue that should be overcome in future.
In conclusion, we observed significant delays in PTT and time to reach peak pharyngeal constriction with midthick fluid; i.e., fluid of viscosity intermediate between thin and thick fluid, on VFSS conducted. Therefore, it is recommended that in future various concentrations of fluid should be used in VFSS tests to enhance safety and optimize fluid intake for dysphagic patients. In addition, if a thickener is required to prevent aspiration, the safe concentration of test fluid and thickener must be determined to ensure safe and optimal use of thickener.
This technique will enable regulation of the amount of thickener used in dysphagic patients. Further studies using various bolus volumes and viscosities are required in patients with dysphagia.
Notes
CONFLICT OF INTEREST: No potential conflict of interest relevant to this article was reported.