Feasibility of Mobile Health App-Based Home Aerobic Exercise for Physical Performance in Healthy Young Adults
Article information

Abstract
Objective
To investigate the feasibility and effects of a mobile app-based home cycling exercise program compared to home cycling exercise without additional monitoring system. Compared with fitness facilities or outdoor exercise, home-based exercise programs effectively improve physical performance in an indwelling community. However, a flexible, informal environment may decrease motivation and impair adherence to physical exercise. Mobile devices for aerobic exercise and mobile applications provide real-time monitoring, immediate feedback, and encouragement to increase motivation and promote physical performance. We investigated the feasibility and effects of a mobile app-based home exercise program on body composition, muscular strength, and cardiopulmonary function.
Methods
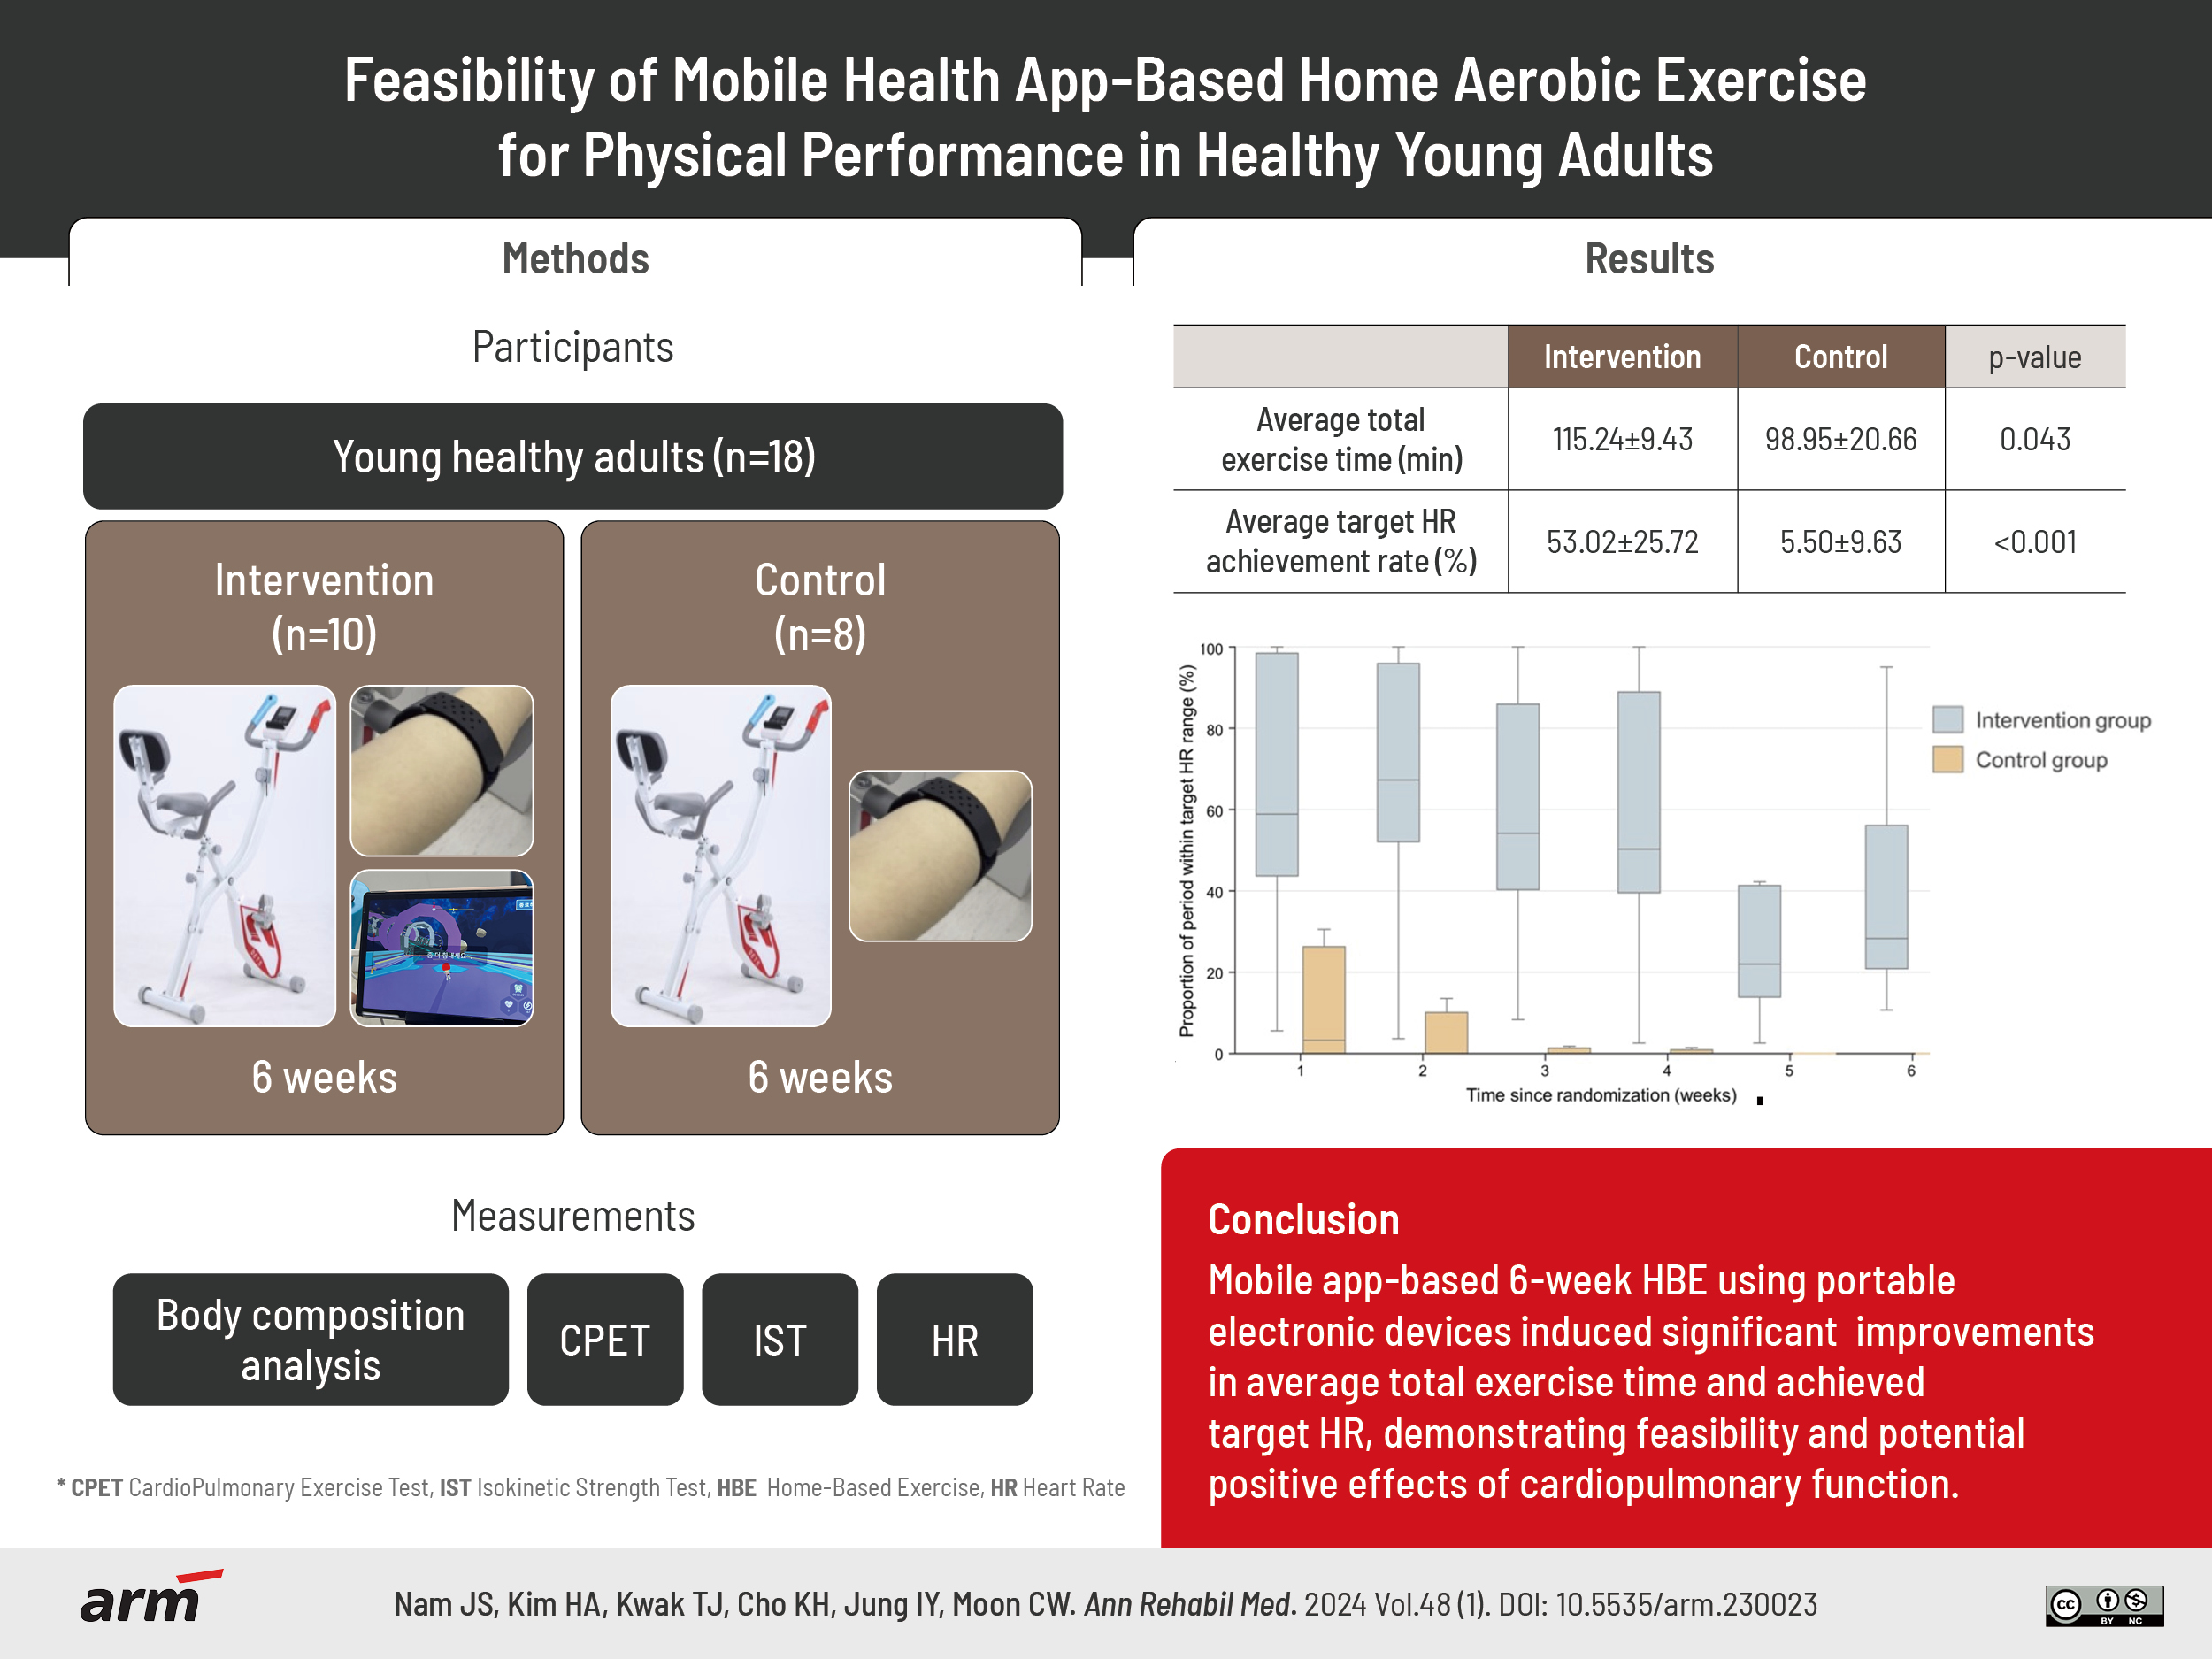
Between February and May 2023, 20 participants were randomly allocated to the intervention (mobile application with a tablet) and control groups, and they performed aerobic exercise using a stationary bicycle for ≥150 minutes per week for 6 weeks (≤30-minute exercise session, with 3-minute warm-up and 3-minute cool-down). Karvonen formula-based heartrate defined the weekly increase in exercise intensity. Outcome measures included body-composition parameters, isokinetic knee flexor and extensor strength tests, cardiopulmonary exercise test results, and rate of target heart rate (HR) achievement. Participants were assessed at baseline and after the intervention.
Results
Unrelated personal events led two participants to drop out. The intervention and control groups had similar baseline characteristics. Compared with the control group, in the post-intervention isokinetic strength test, bilateral knee flexor and extensor power, and time to target HR achievement significantly increased each week in the intervention group.
Conclusion
Home-based exercise to achieve long-term cardiovascular fitness with portable electronic/mobile devices facilitates individualized exercise using real-time feedback to improve motivation and adherence.
INTRODUCTION
Physical activity (PA) has several health benefits. A single bout of moderate to vigorous PA not only improves sleep and anxiety and reduces blood pressure but also provides benefits including prevention of chronic diseases, such as cardiovascular disease, stroke, and diabetes; decreased risk of weight gain, depression, and falls; and improvement in bone health [1]. Regular PA has been associated with decreased incidence, symptoms, and mortality of viral infection through immunomodulation [2,3]. Several studies on the benefits of exercise using bioelectrical impedance analysis (BIA), have shown that PA prevents an increase in fat mass [4] and is inversely related to body mass index (BMI) and body fat percentage [5]. Regular exercise with moderate-to-vigorous intensity led to higher phase angle A values, indicating its potential benefits for cellular health and muscle quality [6]. A recent systematic review showed a curvilinear dose–response relationship between PA and health status, wherein significant health benefits, such as reduced risks for chronic disease and mortality, can occur with a small change in PA; this emphasizes the importance of being physically active [7].
In Korea, interest in aerobic exercise is gradually increasing in line with the era of pursuing a healthy lifestyle, although PA is not being performed appropriately. This failure to perform PA correctly is possibly due to reasons such as not being familiar with or not knowing the PA guidelines. According to data from the Korea National Health and Nutritional Examination Survey, the adherence rate to aerobic PA guidelines was less than 50% and had decreased by more than 10% in 5 years [8]. In 2020, less than 20% of adults in Korea satisfied the criteria for both aerobic and muscle strengthening PA guidelines [9].
Compliance with both muscle strengthening and aerobic PA guidelines is important due to its correlation with a substantial decrease in all-cause mortality risk compared to following either guideline alone [10]. However, it is difficult for the Korean population to meet these PA guidelines. A considerable amount of working time and continuously increasing sedentary lifestyles, characterized by sitting in a chair for more than 8 hours per day, could be a contributing factor [8,11]. The prevalence of insufficient PA was more than 50% among Korean adults in 2020, surpassing the global physical inactivity level [9,12].
Long working hours are associated with a higher risk of physical inactivity, and the accumulation of physical inactivity may gradually induce health problems [13]. In addition, during the coronavirus disease 2019 (COVID-19) pandemic, the social distancing and quarantine policies of the Korean Disease Control and Prevention Agency led to worsened inactivity. In one questionnaire study in Korea, daily step counts decreased by more than 10% after the COVID-19 pandemic compared to before [3]. During the pandemic, a decrease in PA and an increase in sedentary time were observed, which were negatively and positively related to changes in BMI, respectively [14]. Lee et al. [15] showed that the prevalence of obesity in Korean adults revealed a significant increase of 2.5% in 2020 compared with that in 2019, which may be associated with low PA and unhealthy eating habits.
Considering these circumstances associated with restricted mobility, the interest in and demand for non-contact health care and home-based exercise (HBE) has increased [16]. Not only have the sales of fitness equipment for home exercise increased by 59%, compared to before the COVID-19 pandemic, but also the use of fitness-related applications has increased significantly [17].
In particular, HBE with healthcare devices can provide exercise monitoring and feedback and is a safe and appropriate method for alleviating physical inactivity and maintaining or improving cardiovascular health [18]. In addition, individuals can exercise at home at any time without restrictions. Individualized home exercise programs among adults have already been shown to be effective in improving physical activities or activities of daily living [19,20]. However, the treatment adherence was relatively poor in the HBE group. Additionally, it may be challenging for individuals to regularly conduct structured exercise programs at home without supervision or exercise prescriptions. Digital health interventions (DHIs) can help alleviate these barriers and encourage exercise. HBE delivered by DHIs was effective in enhancing physical function and quality of life related to health among older individuals [21].
Among the DHIs, mobile health can be used to make the exercise environment more appealing and entertaining through gaming [22]. The combination of PA with gaming through mobile health could be a great strategy for increasing PA and encouraging consistent participation in exercise.
The primary aim of this study was to evaluate the feasibility of HBEs using mobile applications and devices. We used a stationary bicycle, DETS Bike (UNIVR), as an exercise tool because the equipment is safe and helpful for aerobic and strengthening exercises and has fewer space restrictions at home. The second aim was to determine effectiveness by comparing the outcomes of physical performance in young adults between groups with exercise using a mobile application and those with conventional exercise after 6 weeks.
METHODS
Study design
This single-center randomized controlled trial of healthy adults was conducted in accordance with CONSORT (Consolidated Standards of Reporting Trial) guidelines and the principles of the Declaration of Helsinki. The study protocol was approved by the Institutional Review Board and Ethics Committee of Chungnam National University Hospital (no. 2021-11-076).
All procedures were performed with adequate understanding and written informed consent was obtained from all participants. This study is registered with cris.nih.go.kr (registration number: KCT0008876).
Study participants
Participants were recruited through paper-based and online advertisements in the Department of Rehabilitation Medicine of a tertiary hospital. The enrollment was conducted between February and May 2023. In total, 20 individuals were enrolled and randomly allocated to each arm (the intervention and control groups) in a 1:1 ratio (Fig. 1).

Flow chart of the participants selection.
Participants who met the following inclusion criteria were recruited to participate in the study: (1) aged 18 years or older; (2) agreed to participate in the study voluntarily; (3) not diagnosed with cardiovascular disease; (4) able to use mobile devices, including installing and using mobile applications; and (5) able to understand and perform the exercise protocol at home and provide feedback without difficulty. The exclusion criteria included: (1) medical problems or physical disabilities that would prevent participation in exercise; and (2) inability to read and understand the exercise manual.
Exercise protocol
Before each exercise session, both intervention and control group participants wore a heart rate (HR) sensor (exa-i; Shenzhen Chileaf Electronics) on either their right (Rt) or left (Lt) forearm to monitor their HR. They were instructed to exercise using a stationary bicycle for a minimum of 150 minutes per week based on the WHO PA guidelines [11]. Participants were required to perform each exercise session for a minimum of 30 minutes, including 3-minute warm-up and cool-down phases.
The entire exercise program was performed for 6 weeks. Exercise intensity was increased weekly using the calculated HR based on the Karvonen formula [23]. Participants began the program by exercising at an intensity of resting HR+50% of HR reserve (HRR) in the first week and gradually increased to an intensity level as follows: second week, resting HR+60% of HRR; third week, resting HR+65% of HRR; fourth week, resting HR+70% of HRR; fifth week, resting HR+75% of HRR. Finally, in the sixth week, exercise was performed at an intensity of resting HR+80% of HRR. The HR, measured in real-time, was displayed on a screen.
Intervention with mobile application
In the intervention group, participants were instructed to install the mobile app, Clinic C (UNIVR) on a tablet and were educated on how to use the application before starting the exercise. When the participants run the application, a message regarding the link between the HR sensor and the bicycle appears. When the connection between the application and bicycle is confirmed, the HR sensor moves on to a screen to record simple personal information, current exercise weeks, and target exercise time. Subsequently, the virtual reality game screen appears, and the exercise begins.
The target HR of the session is automatically calculated based on the resting HR measured using an HR sensor (Fig. 2A) and presented on the screen during the game. The virtual reality game consists of a warm-up, the main exercise, and a cool-down. There is a game character in the middle of the screen. When the participants begin cycling, the wireless sensor embedded in the bicycle monitors their speed and reflects it by adjusting the speed of the character. At the top of the screen, the target HR is displayed as a yellow line in the middle, and the current HR is displayed in red. The relative amount of time elapsed since the start of the exercise is shown as a bar graph on the left-hand side of the screen (Fig. 2B). When the participant’s HR is lower than the target HR, comics are displayed on the screen to encourage the participant to exert more effort (Fig. 2C). After each session, the achievement rate of the target HR, total exercise time, and actual exercise time are displayed on the screen (Fig. 2D). In contrast, the control group underwent the same exercise protocol without using the mobile application.
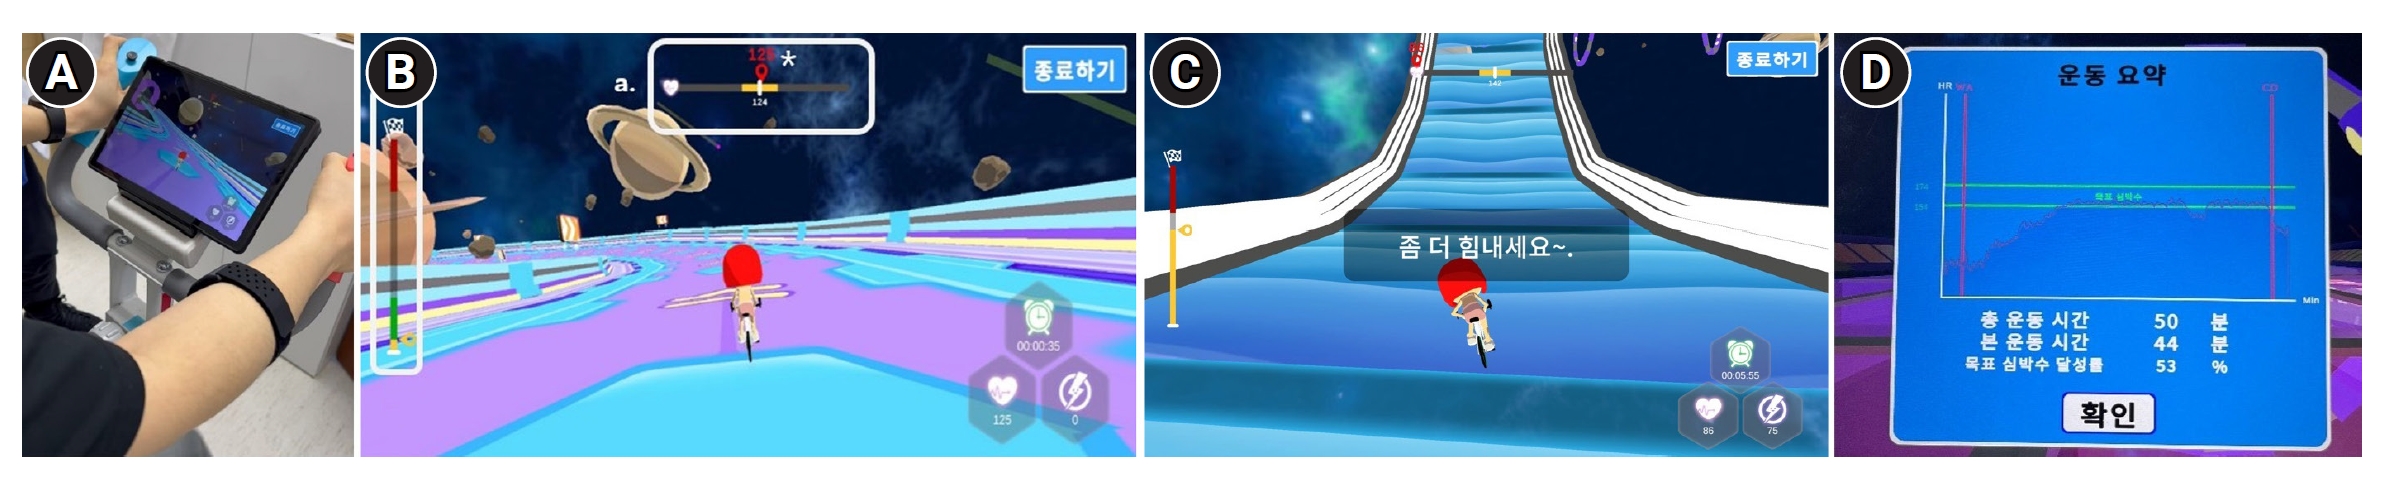
Home-based exercise program using tablet and wireless heartrate tracker. (A) Setting for the intervention with a heartrate sensor placed on the participant’s right forearm. (B) Screenshot of the game screen delivered to the participants that is displayed while exercising on a bike. Box a: (above) Range of the target HR (yellow line) and current HR (asterisk). Box b: (left) Bar graph showing the relative amount of time elapsed in the game. Screenshot of the game screen showing the lyrics displayed as encouragement when the participants did not reach the target HR range. Summary of training sessions showing the achievement rate of the target HR and the total and actual exercise time on the screen. HR, heart rate.
Measures
All participants were assessed at baseline and 6 weeks post-intervention. Measurements included body composition analysis, isokinetic muscle strength test, and cardiopulmonary exercise test (CPET). All measurements were performed by the same experienced physiotherapist who was blinded to the study.
Body composition measurement
Using an automatic height- and weight-measuring device, BSM370 (Biospace), the participants’ height (cm) and weight (kg) were measured to the first decimal place in an upright position without shoes. Body composition was determined by BIA using InBody S10 (InBody). Participants stood barefoot on two-foot electrodes and gently held two hand electrodes placed in the palm of their hand with their fingers wrapped around the hand electrode so that the palms, fingers, and soles could be in contact with the electrodes during the test. The skeletal muscle mass (SMM), percentage body fat (PBF), visceral fat area (VFA), segmental lean analysis (SLA), and phase angle of both legs were measured using BIA.
Isokinetic strength test
To measure lower extremity muscle strength, bilateral isokinetic knee flexor (KF) and extensor strength tests were performed. Before the test, each participant was required to cross their arms over the chest, and Velcro straps were used to fix the trunk, pelvis, and thighs in place to minimize body compensation. At an angular velocity of 60°/s, using an isokinetic dynamometer (Medical Systems 4; BIODEX), the participants were required to perform five maximal repetitions of flexion and extension in both legs after submaximal trials for adaptation. The peak torque generated over five repetitions was recorded, and the peak torque per body weight was calculated.
Cardiopulmonary exercise test
To determine the exercise capacity of the participants, experienced physiotherapists performed the incremental CPET with 12-lead electrocardiographic monitoring on a treadmill (Marquette T2000; GE HealthCare). The participants underwent symptom-limited exercise testing using a Korea Institute of Sports Science protocol developed for the evaluation of national athletes. A breath-by-breath expired gas analyzer (Quark CPET; COSMED), blood pressure monitor, and pulse monitor were used during testing. Termination of the CPET was done by following the guidelines set by the American Heart Association [24].
An oxygen consumption (VO2) peak was determined as the highest recorded VO2 value during a given 15-second interval within the last 90 seconds of exercise [25]. Anaerobic threshold (AT) refers to VO2 at the onset of blood lactate accumulation and is the point at which minute ventilation increases disproportionately relative to VO2; the AT is generally observed at 60%–70% of VO2 max [26,27]. VO2 peak, predictive percentage, and VO2 values over the AT were used for the study.
Achieved target HR percentage
For each exercise session, the exercise time and HR were automatically recorded on a mobile platform. These data were used to calculate the total exercise time for each week and the percentage of time spent within the target HR range (target HR±10 beats per minute). These parameters were used to assess the intergroup difference in the rate of reaching the target HR and thereby evaluate the effectiveness and feasibility of the mobile application as an adjunctive tool for promoting PA during HBE.
Statistical analysis
Demographic and clinical characteristics are presented as means and standard deviations. Baseline characteristics were compared using the Mann–Whitney U-test for continuous variables and the chi-square test for dichotomous variables. Statistical analyses included the Mann–Whitney U-test for intergroup comparisons and Wilcoxon signed-rank tests for within-group comparisons. All statistical analyses were performed using IBM SPSS Statistics 29.0 (IBM Corp.). The level of statistical significance was 0.05.
RESULTS
Baseline variables
Among the 20 participants recruited, 18 completed the study, and two in the control group were excluded from the study due to aggravation of back pain and orthopedic surgery due to trauma, respectively. The participant’s back pain was originally caused by long-standing sedentary lifestyles and has recently been worse due to prolonged sitting from recent increase in workload regardless of exercise intervention. The baseline demographic and clinical characteristics of both the groups are listed in Table 1. The average ages of the participants were 29.50±4.45 and 27.75±4.62 years in the intervention and control groups, respectively. The sex ratios (male:female) in the intervention and control groups were 5:5 and 3:5, respectively.
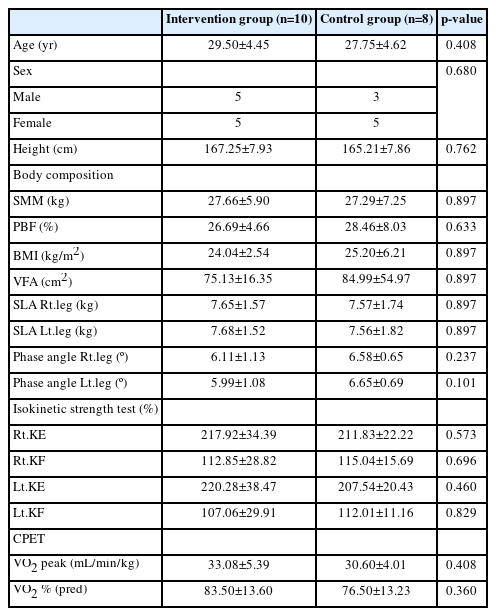
Demographic characteristics of the participants
There was no significant intergroup difference in age (p=0.408), sex (p=0.680), or height (p=0.762), or in baseline differences in parameters of body composition (SMM, p=0.897; PBF, p=0.633; BMI, p=0.897; VFA, p=0.897; SLA Rt.leg, p=0.897; SLA Lt.leg, p=0.897; phase angle Rt.leg, p=0.237; phase angle Lt.leg, p=0.101), isokinetic strength test (Rt.knee extensor [Rt.KE], p=0.573; Rt.KF, p=0.696; Lt.KE, p=0.460; Lt.KF, p=0.829), CPET (VO2 peak, p=0.408; VO2 % [pred], p=0.360).
Outcome variables after the 6-week intervention
Table 2 presents the descriptive results of the outcomes during the study period for both the intervention and control groups. Intergroup analysis showed no statistically significant mean differences in body composition parameters. In the isokinetic strength test, significant differences were found between the baseline and post-intervention assessments in the intervention group (Rt.KE, p=0.007; Rt.KF, p=0.005; Lt.KE, p=0.007; Lt.KF, p=0.007), whereas no significant difference was found in the control group (mean changes in Rt.KE, p=0.401; Rt.KF, p=0.208; Lt.KE, p=0.401; Lt.KF, p=0.327).

Outcome measures of participants from before to after the intervention
In the CPET, the VO2 peak and VO2 % (pred) values were increased in intervention group after the intervention but without statistical significance.
Table 3 demonstrates the average total exercise time and target HR achievement rate in each group. During the 6-week intervention period, both the average total exercise time and the achieved target HR rate were significantly higher in the experimental group compared to that in the control group (p=0.043, p<0.001, respectively). Specifically, the difference in average target HR attainment rate was larger than that of average total exercise time between the two groups (53.02%±25.72% vs. 5.50%±9.63%).
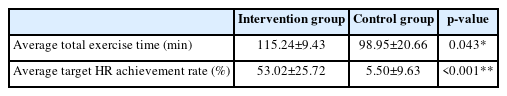
Average total exercise time and target HR achievement rate of the participants
Fig. 3 comprises box plots showing the degree of target HR achievement in each group. Compared with the control group, the intervention group showed a significantly higher target HR achievement rate every week (week 1, p=0.012; week 2, p<0.001; week 3, p=0.001; week 4, p=0.001; week 5, p<0.001; week 6, p<0.001).

Achieved target heart rate percentage stratified by each study group for 6 weeks. HR, heart rate.
DISCUSSION
The main result of our study was that HBE combined with a mobile application for 6 weeks improved lower extremity muscle strength and target HR achievements. However, its effects on body composition and cardiopulmonary function remain unclear.
Body composition before and after the intervention
There are no clear statements regarding how long or intense exercise should be to produce changes in body composition or cardiorespiratory function. This might be due to the different exercise volumes, intensities, programs, and participant characteristics among the studies, which makes it difficult to generalize the results. Several studies have investigated the relationship among exercise type, intensity, and changes in body composition. A systematic review on the effectiveness of various types of exercise on body composition showed that combined resistance and aerobic training had the greatest effect on reducing BMI, PBF, and inflammatory cytokine levels [28]. Grediagin et al. [29] demonstrated that a 12-week exercise program showed no significant difference in changes in body weight, PBF, fat-free mass, and fat mass between high- and low-intensity exercise groups in overweight women, and this emphasized the importance of energy expenditure rather than exercise intensity. In another 12-week high-intensity functional training study, both low- and moderate-resistance load groups with similar total volume load experienced comparable increase in lean body mass. Additionally, during the 6 weeks of the study, both groups demonstrated a decrease in fat mass [30]. Similarly, another study of how walking speed affects body fat in postmenopausal healthy women showed comparable body fat reduction in both the slow- and fast-walking groups after a 30-week walking regimen, suggesting that the degree of energy expenditure is important [31].
Therefore, rather than determining the duration of exercise, it seems reasonable to prescribe exercise types and the total amount of exercise to reflect energy expenditure, considering that these are important factors in changes in body composition. Although the stationary cycling used in this study was an appropriate form of exercise combined with aerobic and resistance training [32], the exercise volume, including the total duration of exercise (weeks) and the intensity of exercise, may not be sufficient to produce significant changes in body composition.
Change in isokinetic strength test results from before to after the intervention
We demonstrated that the intervention group showed a marked improvement in lower-extremity strength measured by peak torque/body weight compared with that in the control group. During the early phases (first 6–8 weeks) of resistance training, neural adaptations are the primary mechanisms for increased muscular strength [33]. As the 6 weeks of exercise conducted in this study constitutes too short a duration to provoke muscle fiber hypertrophy and conversion to the fast fiber type, which contributes to strength gains in the later phase (12–26 weeks) [33], it seems reasonable that substantial muscular strength gains in participants of the intervention groups were attributed to adaptation.
CPET before and after the intervention
A systematic review showed a graded dose–response relationship between total weekly PA volume and cardiorespiratory fitness, and a more distinct relationship was observed between the intensity of PA and VO2 max [34]. A recent meta-analysis on the effects of training intensity on VO2 max in young healthy adults demonstrated that training at any intensity at or greater than 60% of VO2 max seems to show an improvement in VO2 max, without additional gain with an increase in the intensity above 60%. In addition, high-intensity training can efficiently generate similar enhancement in VO2 max through shorter training sessions and reduced training volumes [35]. In contrast, a randomized controlled study by Helgerud et al. [36] showed that 8 weeks of higher aerobic endurance training is more effective than other training at lower intensities in improving VO2 max.
Considering these studies, prescribing exercise at an intensity greater than 60% of VO2 max for sufficient total volume is likely to improve VO2 max. If the exercise duration is short, exercise at a higher intensity would be more appropriate.
In this study, although the intervention group showed some improvement in cardiopulmonary function after the intervention compared with the control group, a statistically significant difference was not found. The total volume of exercise may not be sufficient to improve cardiovascular fitness in terms of exercise duration and intensity. However, compared to the control group, the intervention group showed a significantly higher target HR achievement rate each week. As exercise intensity was determined by the target HR, a greater exercise volume in the intervention group could have improved VO2 max.
Achieving the target HR percentage in the intervention group
Various factors can influence adherence to HBE. A study on patients with chronic illness demonstrated that factors linked to patients, such as motivation and perceived behavior control, along with socioeconomic factors like education, as well as factors pertaining to their conditions, including comorbidities, play a significant role in adherence to HBE [37]. A previous systematic review of the predictors of adherence to HBE suggested that greater self-efficacy, motivation, social support, intentions, and previous adherence to physical therapy predicted higher adherence to HBE [38]. Our research demonstrated that the intervention group showed significantly higher average total exercise time and rate of target HR achievement compared to the control group throughout the intervention period. It is believed that the use of mobile applications influenced motivation and significantly increased adherence to exercise.
This could suggest that employing strategies such as exercise with mobile applications using electronic devices, as in this study, could serve as a suitable additional method for enhancing participant motivation and intentions to maximize exercise outcome, especially considering the non-adherence rate of HBE reaches as high as 70% [38].
Limitations
This study has several limitations. First, only 18 participants were eligible because of the study’s short recruitment period. Our study may be underpowered as a result of the relatively small number of participants. The young, healthy participants of this study may not reflect the state of young adults in the overall population. Second, there were limitations in controlling for various factors, including participation in other exercises and degree of nutrient supplementation. In addition, there were practical difficulties in checking whether the participants performed the exercises with full attention. Accordingly, the degree of participation among the participants may have varied even within the group. Third, the relatively short-term exercise intervention and follow-up time were insufficient to demonstrate the effects of exercise. Future studies should be conducted with larger sample sizes, longer intervention durations, and longer follow-up periods to determine the sustained effects of the intervention.
Conclusions
Mobile app-based 6-week HBE using portable electronic devices induced significant improvements in lower-extremity muscle strength and differences in target HR achievement, but not in body composition or aerobic exercise capacity. However, by demonstrating a significant increase in exercise participation time and the rate of target HR achievement, the intervention has confirmed feasibility and could potentially have a positive effect on cardiopulmonary function with longer-duration application.
Notes
CONFLICTS OF INTEREST
The authors declare potential conflicts of interest related to this research. Taejin Kwak is a CEO of UNIVR company and the authors utilized products from the company in this study. Such conflicts of interest could potentially influence the impartiality of the research.
To mitigate these conflicts, We collaborated with other authors to ensure independence in the design and data collection process of this study, and other researchers participated in the outcome measurement and data analysis process. Through this, the authors aim to minimize the influence of conflicts of interest and maintain the accuracy and credibility of the research.
FUNDING INFORMATION
This work was supported by the Technology Development Program (grant no. S3040507), funded by the Ministry of SMEs and Startups, Republic of Korea.
AUTHOR CONTRIBUTION
Conceptualization: Jung IY, Kwak T, Moon CW. Data curation: Nam JS, Kim HA. Methodology: Jung IY, Moon CW. Formal analysis: Kim HA. Investigation: Kim HA. Funding acquisition: Jung IY, Kwak T, Moon CW. Project administration: Kwak T. Visualization: Nam JS, Moon CW. Writing – original draft: Nam JS. Writing – review and editing: Cho KH, Moon CW. Approval of final manuscript: all authors.