


INTRODUCTION
In 1989, the term “sarcopenia” was first introduced by Rosenberg [1] to describe an age-related decline in lean body mass, muscle mass, and function. For over 20 years, various studies have been performed in this area to clarify the etiology, pathophysiology, risk factors, and consequences of sarcopenia. In addition, various publication groups, including the International Working Group on Sarcopenia (IWGS), the European Working Group on Sarcopenia in Older People (EWGSOP), and the Asian Working Group for Sarcopenia (AWGS), are working to create a standardized definition and diagnostic criteria for agerelated sarcopenia [2-4]. Moreover, a number of therapeutic approaches and clinical trials are still evolving [5-7].
In terms of etiology, a variety of conditions, including altered endocrine function, immobilization, impaired feeding, insulin resistance, denervation, and inflammation, have been suggested as the cause of sarcopenia, and these circumstances could result from many diseases as well as the aging process. Therefore, the existence of secondary disease-related sarcopenia, in addition to agerelated sarcopenia, has been debated. The phenomenon of stroke-related sarcopenia, in particular, has received attention recently in the stroke field [8]. According to the World Health Organization estimates, stroke is the second leading cause of death worldwide after ischemic heart disease [9]. Long-term disability is the most frequent complication following stroke, with 50% of patients suffering from hemiparesis and 30% being unable to walk without assistance [10]. Recent studies found that strokerelated sarcopenia is associated with different characteristics from those of age-related sarcopenia and with the same clinical manifestations including muscle mass loss and decreased muscle strength and physical performance. First, it has been reported that muscle mass tends to decline faster after the onset of a stroke than after agerelated sarcopenia. Second, muscle fibers after a stroke tend to shift from slow to fast type, and the opposite occurs in age-related sarcopenia. Third, depending on the side of brain lesion, physical and functional performance is more degraded in the plegic side than in the non-plegic side. Lastly, the diverse mechanisms of brain lesions result in anabolic deficit and catabolic over-activation [8].
Currently, there is no standard assessment tool that distinguishes stroke-related sarcopenia from age-related sarcopenia, except by invasive method. The evaluation of sarcopenia in stroke patients is based solely on the diagnostic measurements of age-related sarcopenia suggested by the IWGS, EWGSOP, and AWGS, which have limitations for stroke patients. To measure muscle mass, the EWGSOP recommends computed tomography (CT), magnetic resonance imaging (MRI), dual energy X-ray absorptiometry (DXA), and bioelectrical impedance analysis (BIA). While CT and MRI are considered precise imaging techniques, the high cost, exposure to radiation damage, and immobility limit the use of these modalities. DXA is an alternative approach, but its minimal radiation and lack of portability restrict its use in immobile and bedridden patients. BIA is non-invasive, rapid processing, radiation free, inexpensive, portable, easy to use, and suitable for both ambulatory and bedridden patients [3,11]. In terms of muscle strength, handgrip (HG) strength, knee flexion/extension, and peak expiratory flow measurements are recommended in EWGSOP criteria. Among these measurements, HG strength is the most convenient and easy to perform and correlates well with lower extremity strength. As suitable measures of physical performance, EWGSOP criteria suggest usual gait speed, short physical performance battery, and the Timed Up and Go test [3]. Among them, the usual gait speed test is the most reliable, valid, and feasible measurement [12,13].
These recommended methods might be difficult to use to evaluate sarcopenia in patients with stroke, as many stroke patients suffer from hemiplegia or gait disturbance, although these methods are widely utilized for functional assessment of stroke patients. First, some BIA machines have lack of portability and only support standing mode, which could be uncomfortable for stroke patients. Second, in terms of muscle strength, HG strength of the paretic side might reveal a floor effect, although some researchers have noted that this tool is reliable, responsive, and correlates with functional status and motor performance for stroke patients [14]. In addition, some studies revealed that this test does not correlate well with overall muscle strength, as it uses only relatively small muscle groups [15]. Third, in physical performance, usual gait speed might reveal a floor effect due to hemiplegia or gait disturbance or to asymmetric weight-bearing ability despite the fact that many stroke rehabilitation studies utilize this method as an outcome measurement of physical performance [8,12].
Thus, alternative measurements that compensate these drawbacks are required to assess stroke-related sarcopenia with respect to muscle mass, muscle strength, and physical performance. In terms of muscle mass, another convenient tool for quantitative and qualitative assessment of skeletal muscle is ultrasonography. Previous studies have shown that skeletal muscle ultrasonography can reliably diagnose muscle atrophy and neuromuscular diseases through measurement of muscle thickness, echo intensity, and pennation angle [11,16]. Advantages of ultrasonography include lack of radiation, cost-effectiveness, simplicity, availability at the bedside, and noninvasiveness relative to other methods such as DXA, CT, and MRI. Ultrasonography is also common in the clinical setting in rehabilitation department other than DXA, CT, or MRI. In addition, numerous studies have reported significant correlations between assessments using ultrasonography and DXA, CT, and MRI to evaluate muscle mass for sarcopenia [11]. With regard to muscle strength, the Medical Research Council (MRC) sum score, initially devised for use with peripheral nerve diseases, is a quick and easy method for testing muscle strength with a high level of reliability. This test is also a reliable assessment tool for measuring muscle power in various clinical situations including stroke and can be carried out by the examiner without the need for equipment such as a dynamometer. In addition, this test covers a larger group of muscles than the HG strength [17-19]. Lastly, concerning physical performance, patients who have experienced stroke frequently report gait disturbance and balance problems. Balance is an integral component of the locomotor system and activities of daily living (ADLs). Among the various measures of balance, the Berg Balance Scale (BBS) is the most commonly used tool to evaluate balance status with respect to the physical performance of ADLs in patients with neurological conditions, including those who have experienced stroke. Also, this test has a lower floor effect compared to usual gait speed in stroke patients, since the BBS can measure physical performance with static and dynamic balance of stroke patients who suffer from gait disturbance [20-22]. Therefore, with these advantages, ultrasonography, MRC sum score, and BBS might be the alternative method for measuring muscle mass, muscle strength, and physical performance in stroke patients.
The aim of this study is to suggest more advantageous tools for stroke patients who can walk independently, when evaluating sarcopenia. Since there are no standard methods of assessment for sarcopenia in stroke patients, we applied existing safe and simple measurements, including appendicular skeletal muscle index (SMI) using BIA, HG strength, and usual gait speed with consensus from AWGS and EWGSOP to evaluate clinical manifestation of sarcopenia in stroke patients. Then, we studied the relationship between these existing methods and the new methods, which are ultrasonographic muscle thickness for muscle mass, MRC sum score for muscle strength, and BBS for physical performance.
MATERIALS AND METHODS
Participants
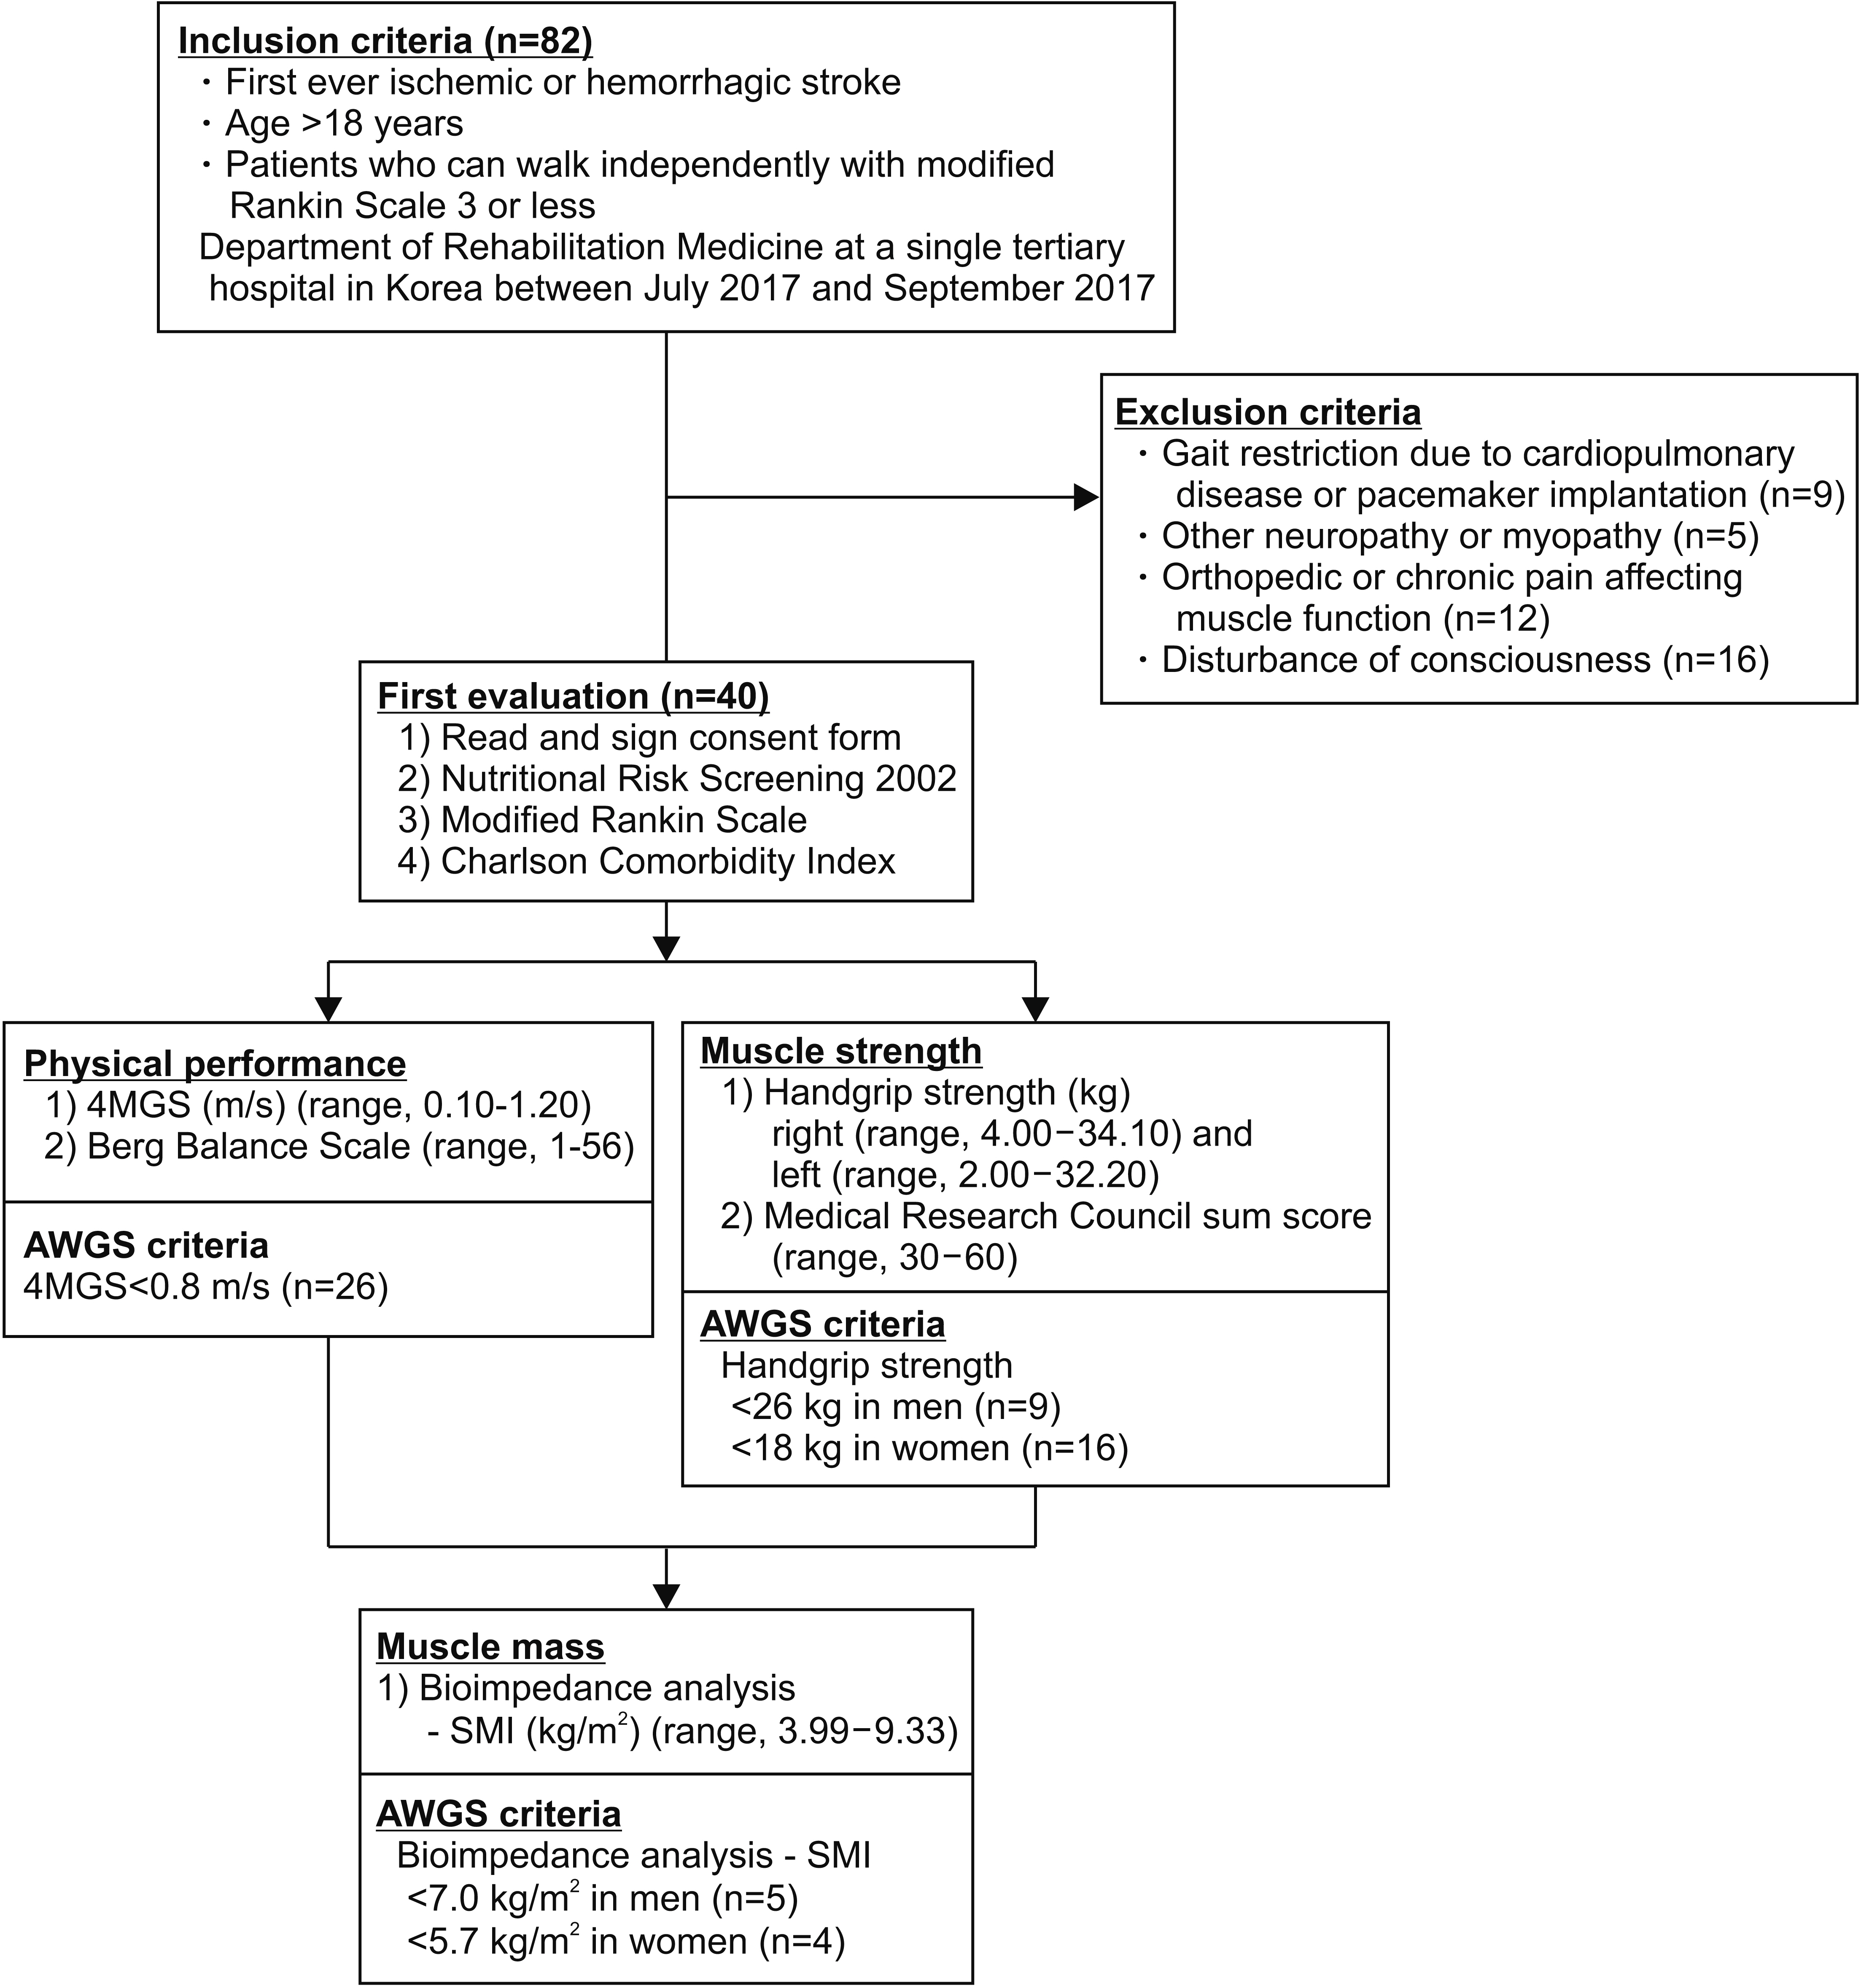
This cross-sectional study examined data from patients with ischemic or hemorrhagic strokes who were admitted to the Department of Rehabilitation Medicine at a single tertiary hospital in Korea between July 2017 and September 2017. A total of 82 patients met the following initial inclusion criteria: (1) first-ever ischemic or hemorrhagic stroke; (2) age greater than 18 years; and (3) patients who can walk independently with modified Rankin Scale (mRS) score of 3 or less. Patients with restriction of gait due to cardiopulmonary disease or pacemaker implantations (n=9), other neuropathy or myopathy (n=5), orthopedic or chronic pain affecting muscle function (n=12), and disturbances of consciousness (n=16) were then excluded from the initial total.
A total of 40 patients (17 men, 23 women; mean age, 66.9±15.4 years; range, 33–91 years) were found to meet the inclusion criteria as described in Fig. 1. The characteristics of study participants were recorded on admission, including age, sex, stroke type and lesion location, duration from stroke onset to measurement of parameters, plegic side, body mass index (BMI), Korean version of Modified Barthel Index (K-MBI), and the presence of spasticity by modified Ashworth Scale and dysphagia by water swallowing test [23,24]. Further, stroke severity, comorbidity, and nutritional status were evaluated with mRS, Charlson Comorbidity Index (CCI), and Nutritional Risk Screening (NRS) 2002, respectively.
Assessing muscle mass, muscle strength, and physical performance, we utilized recommended measurements of the AWGS, which include appendicular skeletal muscle mass using BIA, HG, and 4-meter gait speed (4MGS). All patients were able to perform the HG test albeit weakly on plegic side. Further, 16 patients who were stratified as mRS 3 required supervision during the 4MGS test. As shown in Fig. 1, there were 25 and 26 patients who met the criteria for HG and 4MGS, respectively. In addition, the assessments for sarcopenia in stroke patients suggested by the present study, including ultrasonographic muscle thickness, manual muscle strength in 6 muscle groups utilizing the MRC sum score, and BBS, were conducted.
This study was reviewed and approved by the Institutional Review Board of Konkuk University Medical Center, Seoul, Korea (No. KUH1180038). Patients were enrolled after giving informed consent to participate.
Muscle mass
Bioimpedance analysis
Appendicular body mass was analyzed with InBody S10 device (model JMW140; Biospace Co. Ltd., Seoul, Korea). This non-invasive and portable device can easily be used in patients who cannot remain in a standing or sitting position owing to balance problems or hemiplegic status or who are bedridden. Because changes in blood flow, food, and drink can affect impedance values in BIA, patients were evaluated right after awakening, having spent the previous hour lying flat [25]. Patients are placed in the supine position, and electrodes are placed on the bilateral thumbs, 3rd fingers, and ankles, and BIA is used to measure volume of fat and lean body mass [26]. We then calculated the height-adjusted appendicular SMI defined by appendicular skeletal muscle mass divided by height squared, according to AWGS recommendations. With the use of BIA, the cutoff values for the diagnosis of age-related sarcopenia were 7.0 kg/m2 in men and 5.7 kg/m2 in women, as recommended by the AWGS [2].
Ultrasonographic muscle thickness
In the present study, a single sonographer performed ultrasonographic muscle thickness measurements with a B-mode LOGIQ S8 device (GE Healthcare Korea Co. Ltd., Seoul, Korea) equipped with a linear-array transducer (code ML6-15) with a variable frequency band (5–15 MHz). Gain was set at 50% of the range. All system-setting parameters were maintained constant throughout the study and for each subject, with the exception of depth (initially set at 40 mm), which was modified during the examination (range, 30–60 mm) to allow visualization of the entire muscle thickness.
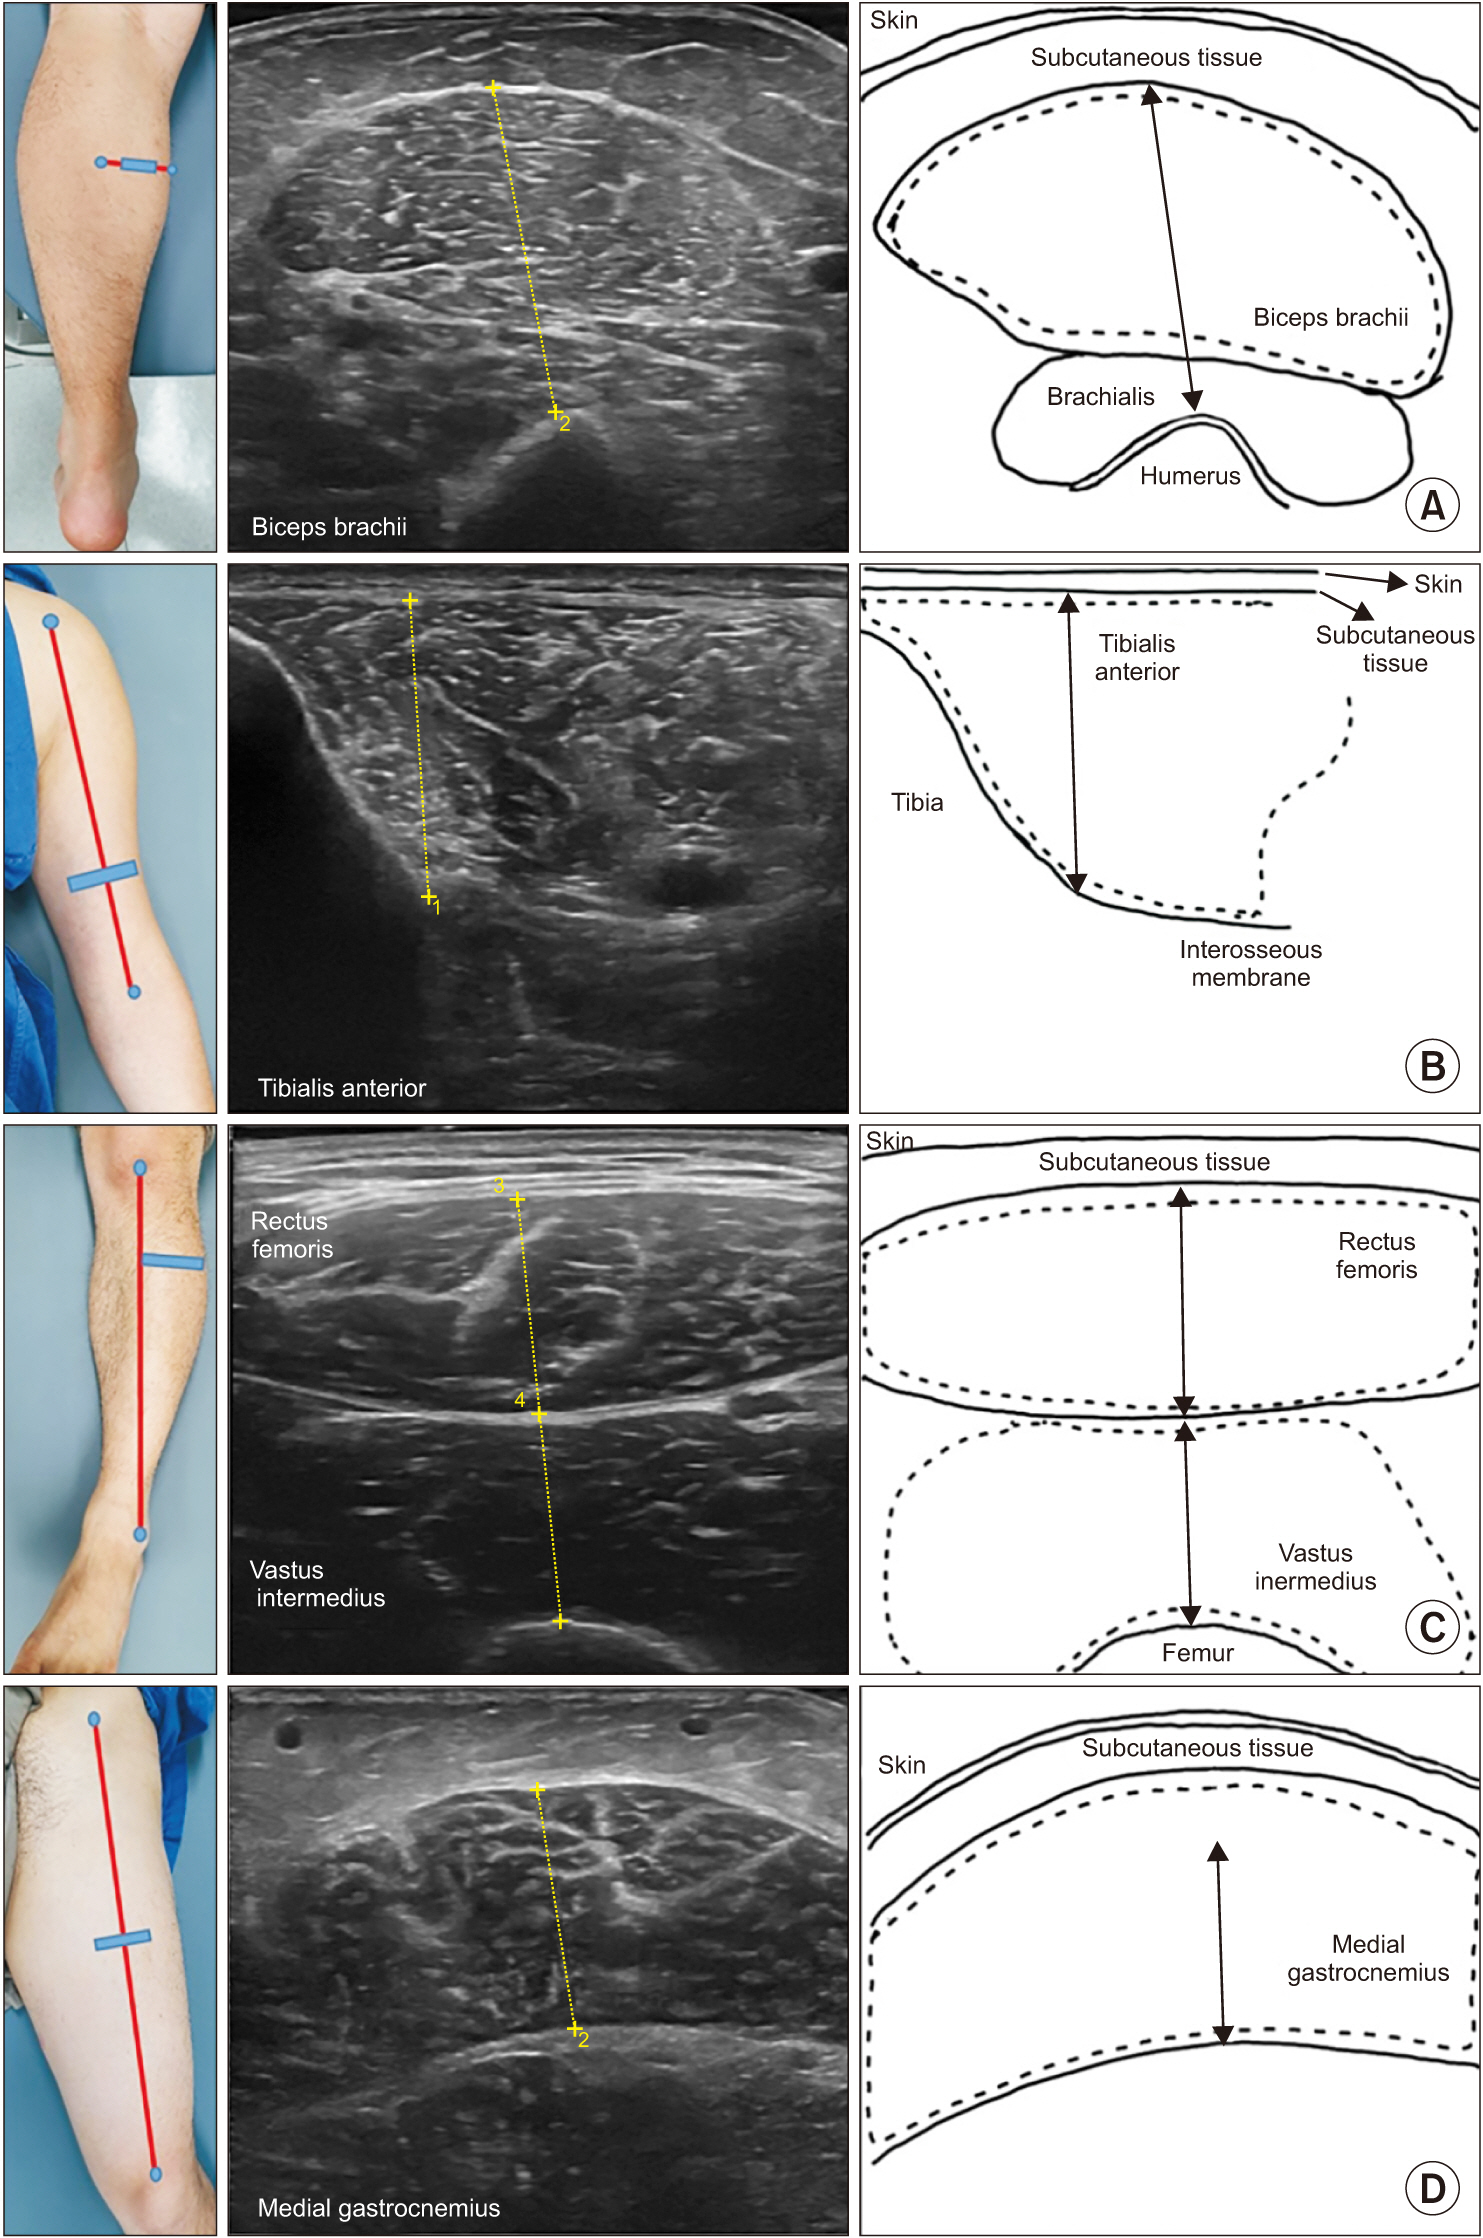
Ultrasonographic muscle thickness measurement was performed at plegic and non-plegic rectus femoris (RF), vastus intermedius (VI), tibialis anterior (TA), medial gastrocnemius (GCM), and biceps brachii (BB). Patients were examined in the supine position with the arms and legs fully extended and relaxed in a portable bed, although for the GCM muscle, the patients were placed in the prone position. The examiner applied a sufficient amount of ultrasonographic coupling gel on the target muscle to minimize the transducer pressure on the skin. All ultrasonographic scans were performed transversely to the muscle. The precise ultrasonographic measurement positions of the BB, RF, and TA were adopted from previously published protocols as shown in Fig. 2: the BB muscle at two-thirds of the distance from the acromion to the antecubital crease; the TA muscle at one-quarter of the distance from the inferior aspect of the patella to the lateral malleolus; and the RF muscle at halfway along the line from the anterior-superior iliac spine to the superior aspect of the patella [27]. The VI muscle was evaluated at the RF measurement site. The GCM muscle was measured at the midpoint of the GCM mediolateral width of the thickest perimeter of the lower leg, as determined with a tape measure [28]. At these measurement sites, ultrasonographic muscle thickness was evaluated using electronic calipers. The BB muscle, which includes the brachialis muscle, was measured between the uppermost part of the humerus and the superficial aponeurosis of the BB; the TA between the interosseous membrane next to the tibia and the superficial aponeurosis of the TA; the RF muscle between the superficial and deep aponeuroses of the RF; the VI muscle between the uppermost part of the femur and the superficial aponeurosis of the VI; and the GCM between the superficial and deep aponeuroses of the GCM. Measurements on both sides and their averages were recorded (Fig. 2).
Muscle strength
Handgrip strength
Subjects performed the HG test on both sides of the hand using a digital grip dynamometer (Takei Grip-D; Takei Scientific Instruments Co. Ltd., Niigata, Japan). Patients sat in a chair with the elbow flexed 90º in front while holding the dynamometer without arm rest. If patients were not able to assume this posture due to weakness, they were positioned supine with the elbow fully extended while holding the dynamometer. Peak forces from three consecutive trials on both hands were recorded, and the highest force on each hand was chosen for maximum HG. With the maximum HG, the cut-off values were 26 kg in men and 18 kg in women, as recommended in AWGS guidelines [2].
Medical Research Council sum score
The MRC sum score is calculated by evaluating the muscle strength of the upper and lower limbs with a scale of 0 to 5 using manual muscle testing. The target muscle groups are the shoulder abductors, elbow flexors, wrist extensors, hip flexors, knee extensors, and ankle dorsiflexors, bilaterally. The total possible score is 60 points (Table 1). A single physician conducted the testing in the present study.
Physical performance
4-meter gait speed
The 4MGS was measured by the same physician within 1 week of admission. In a flat hospital corridor, the physician marked a 4-m length with tape and showed the patient a gait on the flat 4-m long corridor prior to the test. Timing with a stopwatch was initiated when the participant began to move and stopped at the end of the 4-m line. The walk test was repeated a total of three times, and the fastest time was used for the result of the 4MGS, expressed in m/s [29]. The cut-off value for the 4MGS was 0.8 m/s as recommended in AWGS guidelines.
Berg Balance Scale
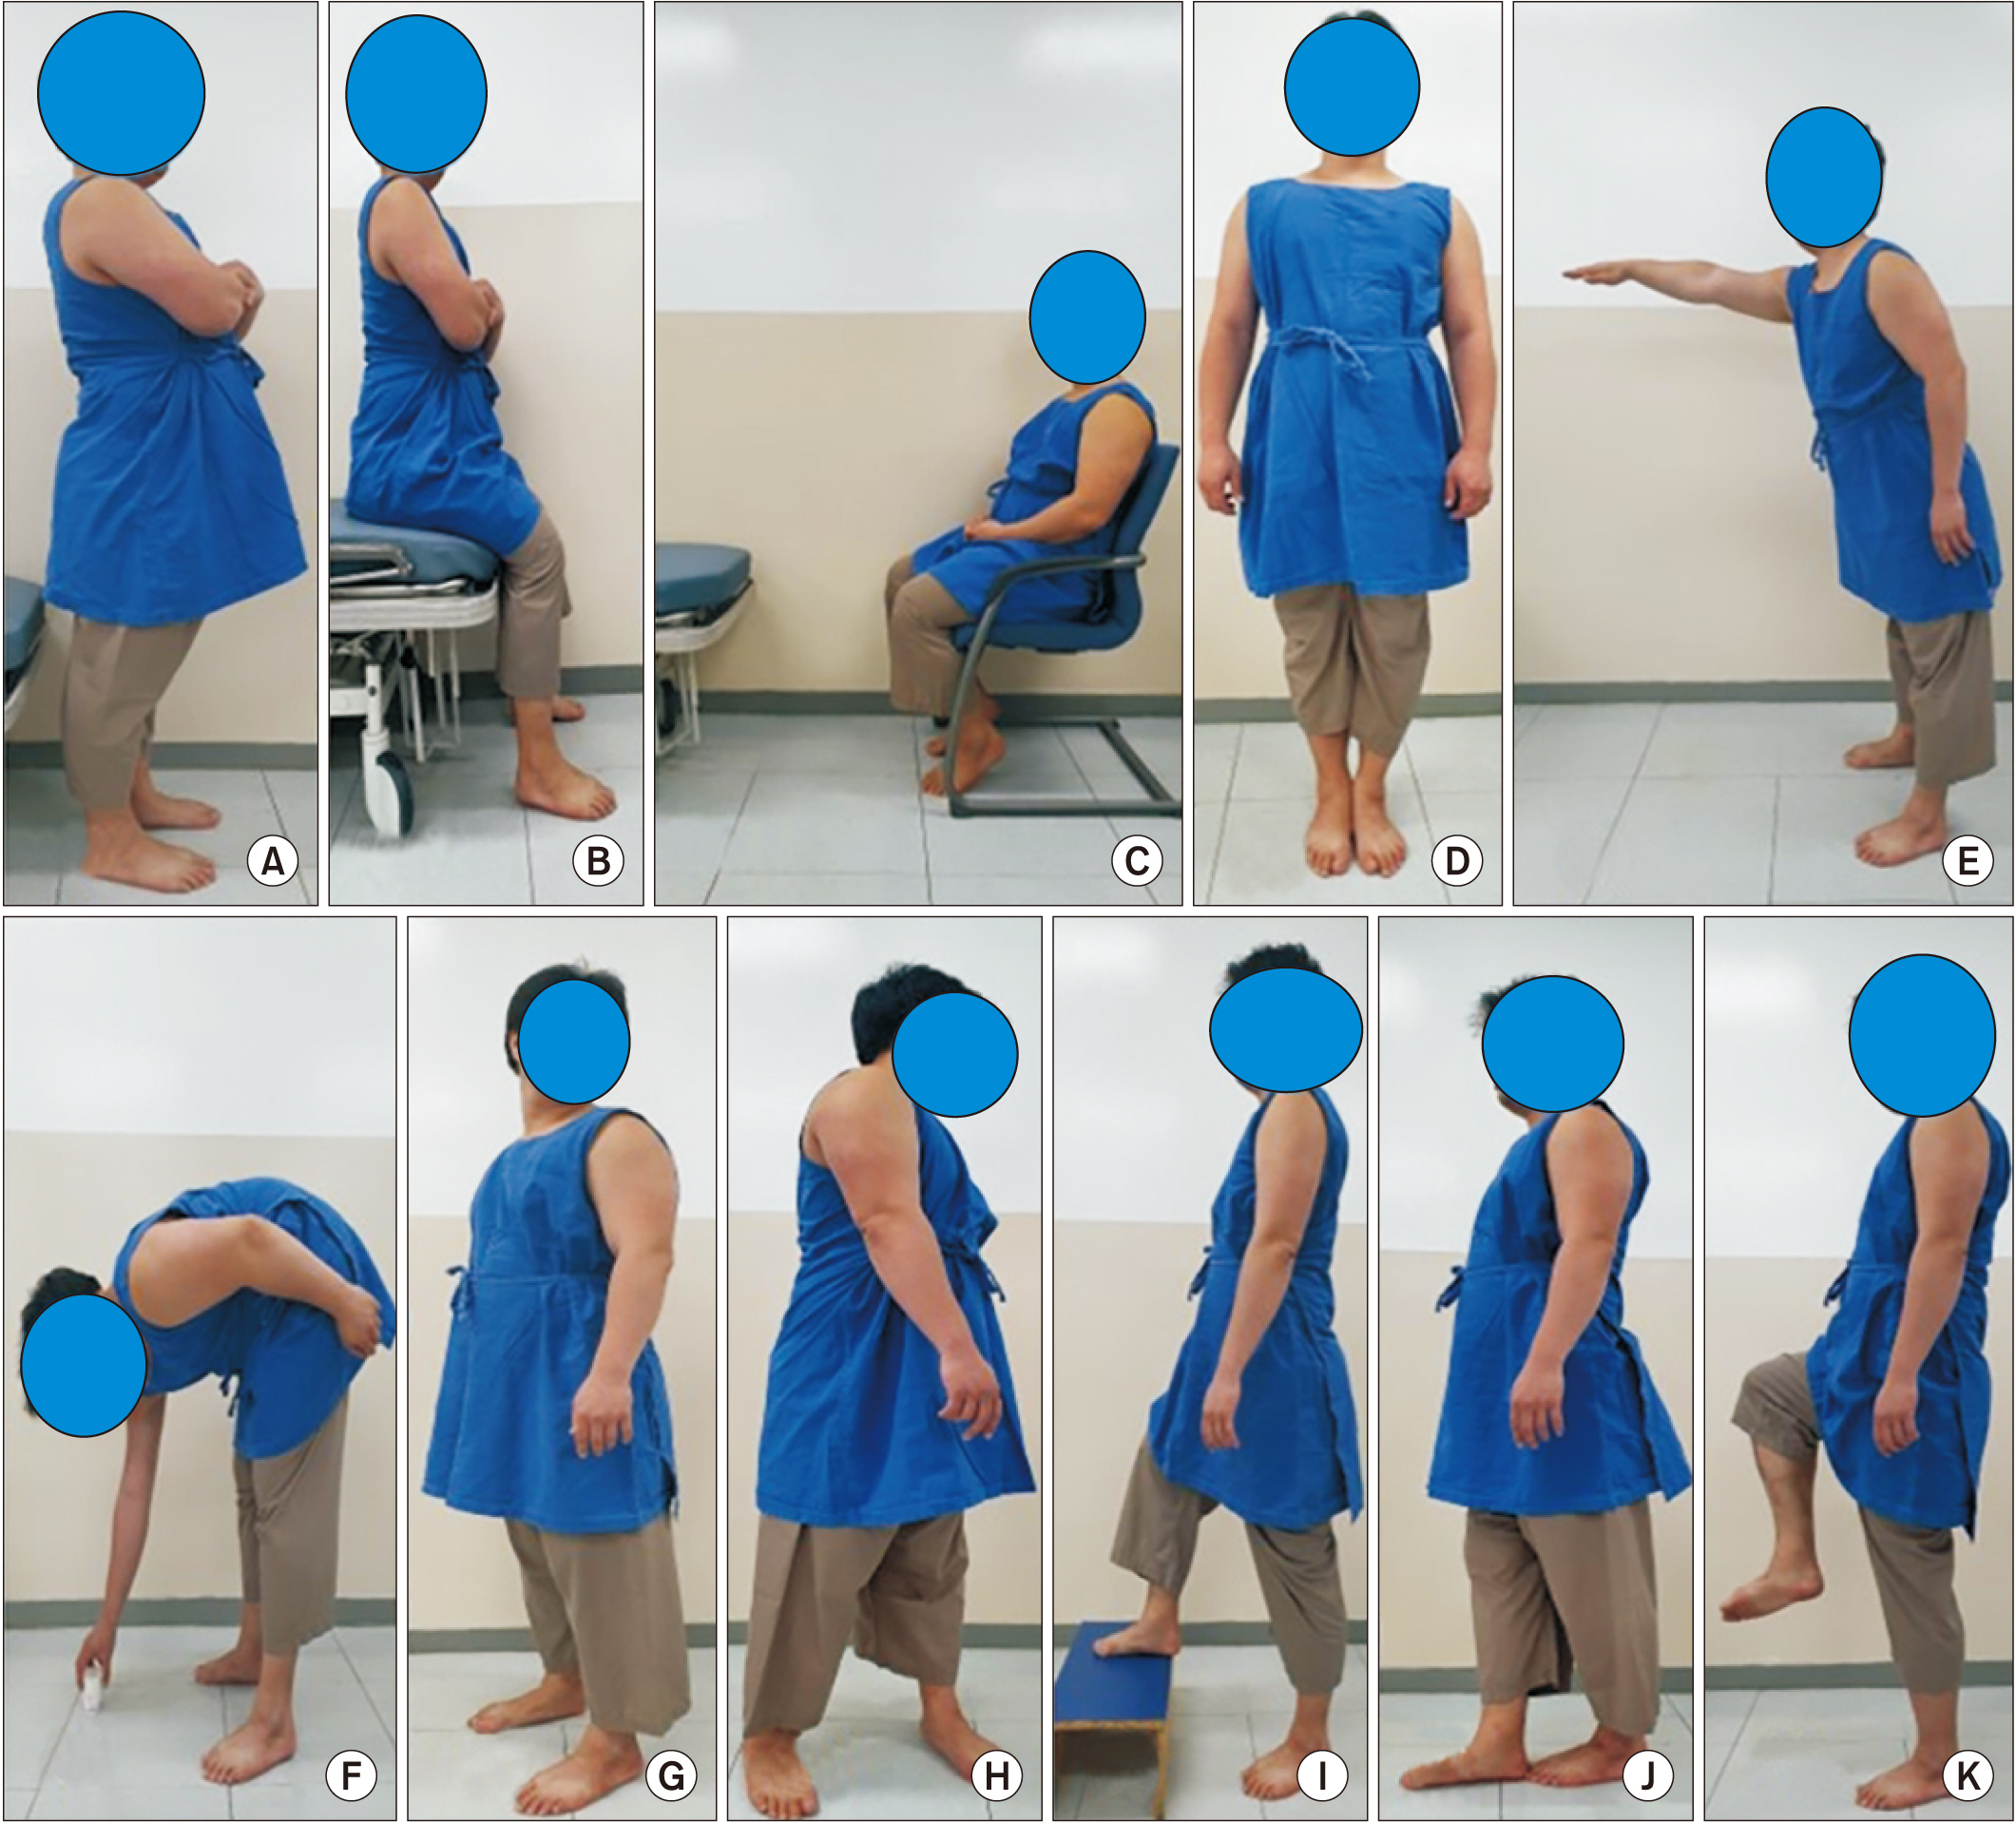
The BBS consists of 14 different items that evaluate sitting, standing, and dynamic balance in a hierarchical manner and are assigned scores of 0 to 4, with 0 indicating that an individual is unable to complete the task entirely. The BBS comprises the following tasks: sit to stand; standing without support; sitting without support; stand to sit; transfers; standing with eyes closed; the Romberg test with eyes open; functional reach in standing; picking up something off the floor; turning and looking behind; a 360° turn to the right and left; toe touches to a stool; the sharpened Romberg test; and single-leg stance [30] (Fig. 3). This test requires 10 to 20 minutes to perform [22].
Modified Rankin Scale
The mRS has proved to be a valid and reliable method to determine outcome in stroke patients [31,32]. The mRS defines 6 different grades of disability, from 0 for “no symptoms at all” to 5 for “severe disability or bedridden, incontinent, and requiring constant nursing care and attention”, and grade 6 for “death”. In this study, patients were assessed with mRS at enrollment and divided into mRS=1, 2, or 3 group.
Charlson Comorbidity Index
The CCI is frequently utilized in outcome studies to adjust comorbid conditions of patients. Cerebrovascular disease (weight 1) and hemiplegia (weight 2) were originally included in CCI. These components are excluded as they are already reflected when evaluating with stroke patients [33].
Nutritional Risk Screening 2002
The ESPEN guideline proposed the nutritional screening tool, which includes a nutritional score, a severity of disease score, and an age adjustment for patients aged >70 years (+1). Nutritional score “1” is weight loss >5% in 3 months or food intake below 50%–75% in preceding week; “2” weight loss >5% in 2 months or BMI 18.5–20.5 kg/m2 and impaired general condition or food intake 25%–60% in preceding week; and “3” weight loss >5% in 1 month or >15% in 3 months or BMI <18.5 kg/m2 and impaired general condition or food intake 0%–25% in preceding week. Severity of disease score “1” is hip fracture, chronic patients with acute complications; “2” major abdominal surgery, stroke, severe pneumonia, hematological malignancies; and “3” head injury, bone marrow transplantation, intensive care patients with APACHE >10. With NRS2002 score, “0” patients are classified as no risk, “1–2” low risk, “3–4” medium risk, and “≥5” high risk [34,35].
Statistical analysis
Statistical analysis was conducted using SPSS version 17 for Windows (SPSS Inc., Chicago, IL, USA). Spearman correlation coefficient was used to analyze the relationship between ultrasonographic muscle thickness, the MRC sum score, and BBS and previous outcome measures for age-related sarcopenia. In addition, comorbidity, nutritional status, and stroke severity were adjusted using multiple linear regression analysis.
Receiver operating characteristic (ROC) analysis was used to explore the cut-off values of ultrasonographic muscle thickness, MRC sum score, and BBS and to evaluate the predictive validity of SMI using BIA, HG, and 4MGS.
RESULTS
Table 2 shows patient demographic characteristics and stroke-related variables. The study included a total of 40 patients, 23 women and 17 men, with a mean age of 66.8±15.3 years. Stroke type was ischemic (n=27) or hemorrhagic (n=13). This study included 27 hemiplegic patients, consisting of 20 with middle cerebral artery infarction, 2 with pontine infarction, and 5 with basal ganglia intracranial hemorrhage. Also, we included 13 quadriplegic patients, including 8 with subarachnoid hemorrhage, 4 with multiple territory infarction, and 1 with top of basilar syndrome. There were 12 (30%) patients with spasticity were and 21 (52.5%) with dysphagia. The mean duration from stroke onset to initial assessment was 9.9±16.9 weeks. The stroke severity assessed by mRS showed 5 patients of mRS=1, 19 patients of mRS=2, and 16 patients of mRS=3 group. There were no moderate and severe nutritional status by NRS2002. Only 25 patients of absent and 15 patients of mild nutritional status were confirmed. Table 3 shows the mean, standard deviation, and range of clinical test and measurement results.
Among the total patients, correlations between all measurements of age-related sarcopenia and the newly proposed measurements for stroke-related sarcopenia are presented in Table 4. In terms of muscle mass, ultrasonographic muscle thickness measurements of all muscles were correlated with SMI. Among these muscles, the TA showed the highest correlation coefficient (r=0.783, p<0.001). Regarding muscle strength, the MRC sum score was correlated with the maximum HG (r=0.660, p<0.001). For physical performance, the BBS was highly correlated with the 4MGS (r=0.834, p<0.001).
The patients were reanalyzed after subdivision into mRS=1 (n=5), mRS=2 (n=19), and mRS=3 (n=16) groups (Table 5). The mRS=1, 2, 3 groups showed correlation trends similar to those of the total population, except the correlation between ultrasonographic muscle thickness and SMI. In mRS=1, 2 group, strong correlations were observed in all cases except for SMI and ultrasonographic muscle thickness of BB and GCM (Table 5). In mRS=3 group, only RF (r=0.574, p=0.020) and TA (r=0.655, p=0.006) ultrasonographic muscle thickness showed strong correlation with SMI and no correlation between other muscles. Among the 6 muscle sites, the TA ultrasonographic muscle thickness showed highest correlation coefficient in all three groups.
Nine patients (5 men, 4 women) satisfied the AWGS diagnostic criteria of age-related sarcopenia. For muscle mass, SMI and ultrasonographic muscle thickness of TA and GCM revealed significant correlation. For muscle strength, the MRC sum score significantly correlated with maximum HG (r=0.872, p=0.002). For physical performance, BBS revealed significant correlation with 4MGS (r=0.515, p=0.037) (Table 6).
The ROC analysis was conducted to evaluate the cut-off value of newly suggested measurements for AWGS sarcopenia criteria. The SMI and sonographic muscle thickness of GCM and BB in men and VI, RF, and BB in women showed significant difference in area under curve (AUC), and other muscle thickness revealed no significant difference with SMI. The differences of AUC between HG and MRC sum score, and between 4MGS and BBS, were not significant (Fig. 4). From ROC analysis, the optimal cutoff values of ultrasonographic muscle thickness, MRC sum score, and BBS were presented in Table 7. For ultrasonographic muscle thickness, only TA muscle revealed significant p-value of AUC for both men (AUC=0.790; p=0.026) and women (AUC=0.970; p<0.001), and each cut-off value of TA muscle showed adequate sensitivity and specificity, including men ≤2.790 cm, sensitivity 100%, specificity 66.7%, women ≤2.055 cm, sensitivity 100%, specificity 93.7%. For muscle strength, the MRC sum score revealed significant AUC p-value for both men (AUC=0.738, p<0.019) and women (AUC=0.810, p<0.002), and cut-off value showed adequate sensitivity and specificity including men ≤54.00, sensitivity 77.8%, specificity 50.0%, women ≤53.42, sensitivity 80.1%, specificity 63.9%. In physical performance, the BBS also revealed significant AUC p-value (AUC=0.930, p<0.001), and the cut-off value of BBS was ≤41, with 78.1% sensitivity and 100% specificity.
Multiple linear regression analysis was performed with all patients to adjust factors of stroke severity by mRS, comorbidity by CCI, and nutritional status by NRS2002 (Table 8). With SMI as the dependent variable, R2 value was 0.814 and beta values for the standardized coefficients were 0.438 for RF muscle thickness (p=0.017) and 0.527 for TA muscle thickness (p=0.001). With HG as dependent variable, R2 value was 0.637 and beta value for the standardized coefficient was 0.314 for MRC sum score (p=0.044). For 4MGS as dependent variable, R2 value was 0.732 and beta value for the standardized coefficient was 0.588 for BBS (p=0.003).
DISCUSSION
In the present study, we suggested new ways of using measurements that could evaluate sarcopenia in the stroke patient. These measurements, which include ultrasonographic muscle thickness for muscle mass, MRC sum score for muscle strength, and BBS for physical performance, showed correlation with current evaluation tools of sarcopenia in stroke patients in each category even when adjusting for stroke severity, comorbidity, and nutritional status. In addition, based on the results of the ROC curve, a cut-off value of ultrasonographic muscle thickness, MRC sum score, and BBS were revealed to have adequate sensitivity and specificity.
In previous studies, ultrasonographic muscle measurement (thickness or cross-sectional area) revealed strong correlation with muscle mass measurements of MRI, CT, and BIA in the older individual to evaluate sarcopenia [11]. In addition, Berenpas et al. [36] suggested the quantitative muscle ultrasound as a feasible technique for chronic stroke survivors. Until now, however, no researchers have studied the correlation between ultrasonographic muscle thickness and BIA in stroke patients to evaluate sarcopenia. In addition, based on our result of correlation and ROC curve analysis, we could suggest TA as a target muscle, when measuring muscle mass for sarcopenia in a stroke patient.
With respect to muscle strength, many studies have shown that HG correlates well with overall strength and function of the upper limb in patients with stroke and other diseases [37]. However, there is some controversy regarding the use of grip strength to chrarcterize overall muscle strength [38]. Also, the HG might reveal floor or ceiling effect when evaluating muscle strength in stroke patients, who suffer from neurologic weakness. The MRC sum score is a simple and routine method to evaluate overall muscle strength in patients without requiring any device. In the present study, we first applied MRC to evaluate sarcopenia in stroke patients and confirmed high correlation and appropriate sensitivity and specificity.
In physical performance, usual gait speed is a quick and easy method to evaluate physical performance in both sarcopenia and stroke patients [8,39]. However, the BBS was revealed to be a more responsive measurement than usual gait speed in severely affected stroke patients [39]. This characteristic of BBS could be an advantage in evaluating sarcopenia in stroke patients. Many previous studies found a strong correlation between gait speed and BBS in stroke patients as observed in our study results [40]. Also, this study was the first to incorporate BBS into the evaluation of physical performance of sarcopenia in stroke patients, although the study included patients who could walk independently.
Therefore, ultrasonographic muscle thickness, especially in TA muscle, the MRC sum score, and BBS might be appropriate methods to evaluate sarcopenia in stroke patients.
This study has some limitations. First, because of the small sample size, it was difficult to determine the exact cut-off value of newly suggested sarcopenia measurements in stroke patients. Second, our study only utilized age-related sarcopenia diagnostic criteria to evaluate sarcopenia in stroke patients without any invasive test such as muscle biopsy or blood test to verify the characteristics of stroke related sarcopenia. Third, our study suggested new measurements to evaluate sarcopenia in stroke patients without golden standard of stroke-related sarcopenia. Fourth, patients with mRS more than 3 were not included in this study. Fifth, it was unknown whether the patients had age-related sarcopenia prior to experiencing stroke. Lastly, we only evaluated ultrasonographic muscle thickness other than cross sectional area, pennation angle, and echo intensity. Future studies should reconsider these limitations, and additional research should be performed to determine the cutoff value of these tools in stroke patients with sarcopenia.
In conclusion, our results suggest that ultrasonographic muscle thickness especially in the TA muscle is a potential method to evaluate sarcopenia in stroke patients who can walk independently. In addition, the MRC sum score and the BBS could be alternative methods to HG and usual gait speed for the sarcopenia in stroke patients with mRS 3 or less. A larger scale study with invasive measurement component is needed to confirm these suggested methods to evaluate stroke-related sarcopenia.