

INTRODUCTION
Many people suffer from low back pain, the lifetime prevalence of which is about 84%. Low back pain usually leads to disability in activities of daily living and is very costly. Most patients with acute low back pain tend to recover from pain within 8-10 weeks regardless of the treatment, but many suffer recurrence of pain, with some experiencing chronic low back pain that lasts for more than 6 months.1,2
Back muscles act to support the spine and maintain the stability of the spine. The weakness of back muscles can lead to low back pain and is known as a main cause of recurrence.3,4 Especially, the multifidus and erector spinae, which mainly consist of back muscles, act as back extensors.5 In patients with chronic low back pain, reflex inhibition induced by pain leads to atrophy of the back muscles and stiffness of the ligaments and joints. Patients reduce their activities due to pain and stiffness, which results in muscle spasm and strain, and eventually this situation aggravates pain in a vicious cycle.6-8 Many studies have documented an association between chronic low back pain and deficits in back muscle strength and endurance.9,10 Therefore, evaluation of the strength of the back muscles may represent the function of back muscle and the degree of disability caused by the pain. Quantitative evaluation of back muscle strength involves measuring the cross sectional area (CSA) of the multifidus and the erector spinae, and measuring the isometric and isokinetic strength of the trunk muscles. Because muscular strength is proportional to the CSA of the muscle (and is also associated with histologic characteristics such as composition and muscle fiber type), measurement of the CSA of muscle has usually been used to evaluate lumbar muscular strength.11 It has been reported that in patients with sub acute and chronic low back pain, the CSA of lumbar muscles and fat tissue (as shown by CT analysis) was relatively smaller than that of the control group.5,12 However, the relationship between the CSA of the back muscles and functional aspects such as pain or disability has been a matter of controversy.13
Measurement of isokinetic strength is an effective means of evaluating the functional ability of lumbar muscles, and it is widely used in the field of rehabilitation.14 The relationships of torque-velocity, in particular, have variability in low back pain, and the therapists can devise the ideal therapy for each patient, taking into account these individual variabilities.15 There is still controversy about the relationship between the CSA of lumbar muscles and isokinetic strength.16,17
Keller et al.18 reported that for assessing the results of an isokinetic trunk muscle test of chronic low back pain patients, CSA, gender, and pain on exertion should be taken into account. However, this study measured the isokinetic torque of total trunk muscles, which is summation of the torques of the trunk flexors and trunk extensors. Considering the fact that the erector spinae mostly acts globally as a back extensor, the study of the relationship between the muscular strength of back extensors and flexors needs to be approached separately, but no such study has been reported yet. Also, prior to this study, there were no studies in Korea about the relationship between isokinetic strength and the CSA of back muscles.
To analyze the associations between the morphologic characteristics and the functional aspects of back muscles, and to find out the factors that influence lumbar muscular function, we investigated the relationship between the CSA of back muscle and the isokinetic strength of trunk flexors and extensors of middle-aged chronic low back pain patients in Korea.
MATERIALS AND METHODS
Subjects
Patients with chronic low back pain lasting over 6 months who visited our hospital for physical therapy from November 2008 to October 2010 were enrolled. Except for the patients with spine fracture, the patients in the study had been treated with conservative treatment for sprain and degenerative diseases. We investigated the medical records retrospectively for the patients who had had magnetic resonance imaging (MRI) and isokinetic strength tests of the trunk flexors and extensor muscles among them. We recorded the clinical characteristics of the patients such as age, gender, body mass index (BMI), cause of pain, duration of disease and pain intensity, measured with numeric rating scale (NRS). Patients who could not fully perform in the isokinetic strength tests because of severe radiating pain in the lower extremities were excluded from the study. Others excluded from the study were those who showed abnormal neurologic signs, had undergone spinal surgery with implantation of fixating devices, were pregnant woman or had a serious medical illness. In the end, data of twenty-eight patients were gathered. The characteristics of all of the patients were as follows. The patients were composed of 7 men and 21 women and their average age was 48.4±11.9 years. The average duration of the disease was 15.7±8.4 months, and average pain intensity, NRS, was 4.2±1.1 (moderate intensity pain). The causes of low back pain were intervertebral disc herniation for 13 patients and lumbar sprain for 15 patients. The average body weight and height were 59.1 kg and 161.7 cm respectively, and the average BMI was 22.9±2.74. Based on the BMI, one patient belonged to the low body weight category (under 18.5), 21 patients belonged to the normal body weight category (18.5-22.9), and 6 patients belonged to the overweight category (25-29.9).
Methods
Measurement of back muscle cross sectional area (CSA) and fat composition
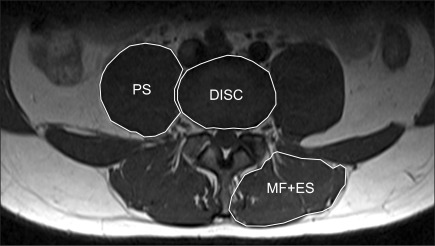
We captured images of magnetic resonance image (MRI; T1 weighted axial view) at the level of the 4-5 lumbar intervertebral disc using the Picture Archiving and Communication System (PACS). Cross sectional areas (CSA) of both sides of the back muscles (multifidus and erector spinae) and intervertebral disc were measured by drawing outlines of them with the Regions of interest (ROI) of PiView (Infinitt, Seoul, Korea) program and were calculated as mm2 (Fig. 1). In this study, the multifidus and erector spinae were measured together as back muscles. For the analysis, we measured the CSA of both paraspinal muscles (CSA, PSM) and the CSA of the disc (CSA, disc). Then we calculated the relative CSA (rCSA), which is the ratio of the CSA of back muscles to that of the disc at the same level, and this ratio was used to compensate for the influence of body shape, body weight and height on the CSA of the back muscles.19,20
The fat composition was measured in the captured MRI images to evaluate atrophy and degenerative changes of the back muscles. Separation of muscle fibers from fat tissue within a muscle in image cuts of MRI is easy because of the signal intensity difference between them. Therefore we can easily evaluate histological changes of muscle, such as the decrease in muscle size and accumulation of fat or connective tissue within the epimysium, which indicate degenerative change due to denervation or immobilization.21 Besides the measurement of the cross sectional area of back muscles, assessment of fat composition can also be used to estimate the degree of atrophy of the back muscle. The fat distribution in both sides of the back muscles was measured semi-quantitatively with the 4-point visual scale at the level of L4-5. Assessment with the 4-point visual scale is based on the distribution of fat tissue inside the muscle. The scale defined Grade 1 as a fat portion below 25%, Grade 2 as 25-50%, Grade 3 as 50-75% and Grade 4 as over 75%.22
Isokinetic strength test
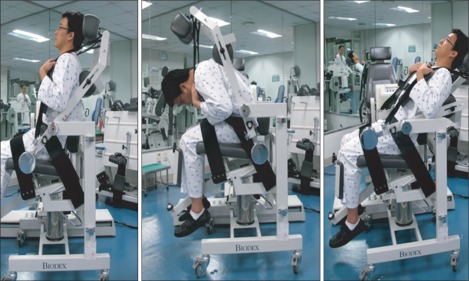
The isokinetic strength test is used widely to quantitatively assess muscle strength through measurement of the torque of the muscle during movement of a joint at a constant angular velocity.23,24 We used the isokinetic dynamometer Biodex® isokinetic dynamometer (Biodex Corporation, New York, USA) to measure the torque of the trunk flexors and extensors. The examination was performed by seating the patient comfortably in the device, fixing both thighs and the back to the chair by a strap, and making the patient hold the handle placed near the front chest in order to prevent motion of the upper limb and hip joint. If movement of either the upper limbs or hip joints were observed, that data was excluded. The axis of the dynamometer was located on the anterior superior iliac spine of the pelvis of the patient. The range of motion of the arm was adjusted individually according to the patient's maximal flexion and extension. All patients were instructed to flex and extend the back 5 times at an angular velocity of 60°/sec as warm-up before examination. During examination, patients were instructed to execute flexion and extension of the back with maximum effort 5 times at an angular velocity of 60°/sec. The device measured the peak torque (PT) (Nm) and the peak torque per body weight (PT/Bwt) (Nm/kg) (Fig. 2). The peak torque per body weight is used to compensate for individual differences in muscle power related to body type, height and body weight.
Statistical analysis
For analysis of the correlation between CSA and isokinetic strength, simple Pearson correlation analysis was used with CSA and rCSA. Because the CSA and rCSA can influence each other, the analysis was done separately.
Multiple linear regression analysis with backward elimination was done with CSA or rCSA and clinical characteristics, such as age, sex, BMI, pain intensity, duration of back pain, cause of back pain as the independent variables, and isokinetic strength (peak torque, peak torque per body weight) as the dependent variable, to find out whether CSA and demographic characteristics influence muscle strength. Because the CSA and rCSA can influence each other, the analysis for each of these was done separately. Because much more women than men were included in the study, multiple linear regression analysis with backward elimination was done separately only with the female patients. The correlation between variables was analyzed by Spearmans' rank correlation, and if the p-value was under 0.05, the correlation was determined to be statistically significant. Correlations were classified according to their correlation coefficients, and were considered as a "definite association" (r=0-0.01) or as a "moderate association" (r=0.01-0.05). Statistical analysis was done by using SPSS version 17.0.
RESULTS
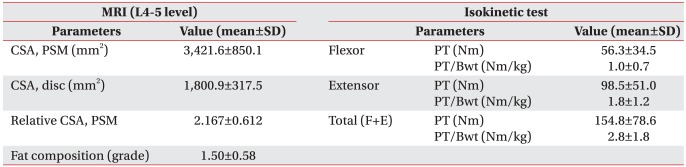
The average CSA of the back muscles with MRI was 3421 mm2, the average CSA of the disc was 1,800.9 mm2, rCSA was 2.18 and fat composition was 1.5. The average peak torque and average peak torque per body weight as measured by the isokinetic test were 56.3±34.5 (Nm) and 1.0±0.7 (Nm/kg) for trunk flexors, 98.5±51.0 (Nm) and 1.8±1.2 (Nm/kg) for trunk extensors, and 154.8±78.6 (Nm) and 2.8±1.8 (Nm/kg) for total trunk muscles (the sum of trunk flexors and trunk extensors) (Table 1). The correlations between CSA or rCSA and the variables with the isokinetic strength test were not statistically significant on simple univariate analysis using Spearman's rank correlation.
The results of the multiple linear regression analysis with backward elimination are as follows.
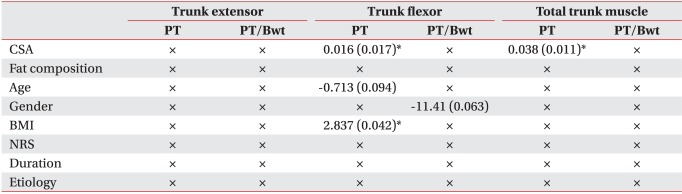
With CSA as an independent variable, no variables were statistically significant with respect to the isokinetic strength of trunk extensors. CSA and BMI had a statistically significant association with the peak torque of trunk flexors, and the regression coefficient of CSA and BMI were 0.016 and 2.837. The p-value for age was 0.094 and was therefore not a statistically significant association factor. With the peak torque/body weight of trunk flexors, gender was likely to be associated (regression coefficient of -11.41), but was not a statistically significant associated factor and the other variables had no significant associations. With the peak torque of total trunk muscles, CSA was significantly associated and no variables were found significant with the peak torque per body weight. Intensity of pain, duration of pain and cause of low back pain had no associations with the strength of trunk muscles (Table 2).
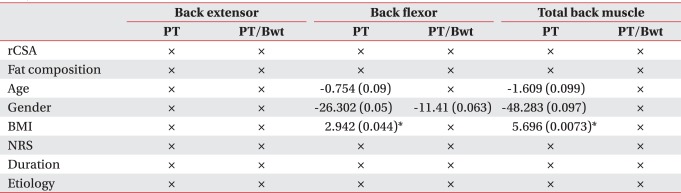
When rCSA was included as an independent variable, gender and BMI were significantly associated with the peak torque of the trunk flexors. With the trunk flexors' peak torque per body weight, gender was not significantly associated despite regression coefficient of -11.41. With the peak torque of total trunk muscle, age was significantly associated and gender and BMI were not significantly associated despite regression coefficients of -1.609 and -48.283. Intensity of pain, duration of pain and the cause of pain were not associated with trunk muscle strength (Table 3).
Even though gender was not an associated factor with trunk muscle power, the number of female patients was three times larger than that of male patients, therefore we analyzed multiple linear regression analysis with backward elimination with only female patients.
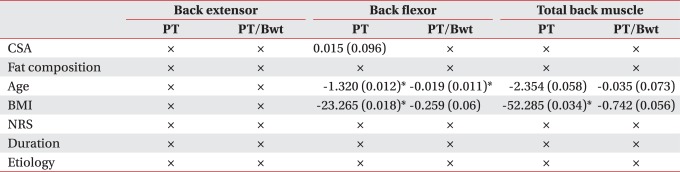
When CSA was included as an independent variable, age and BMI were significantly associated with the peak torque of trunk flexors. With the peak torque per body weight of trunk flexors, age was significantly associated and BMI was not significantly associated despite a high regression coefficient. With the peak torque of total trunk muscles, BMI was significantly associated and age was not significantly associated despite high a regression coefficient. With the peak torque of total trunk muscles, age and BMI were not significantly associated, with p-values of 0.073 and 0.056 (Table 4).
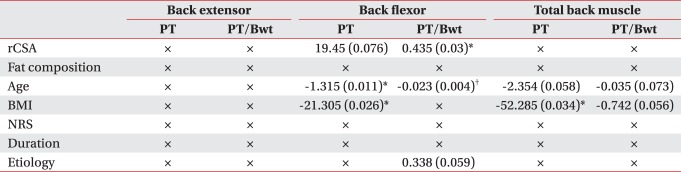
When rCSA was included as an independent variable, with peak torque of trunk flexors, age and BMI was significantly associated and rCSA was not significantly associated for a p-value of 0.076. With the peak torque per body weight of trunk flexors, rCSA and age were significantly associated, and the cause of low back pain was not significantly associated for a p-value of 0.059. With peak torque of total trunk muscles, BMI was significantly associated and age was not significantly associated for a p-value of 0.058 despite a high regression coefficient. With peak torque per body weight of total trunk muscles, age and BMI were significantly associated and other factors were not statistically significant (Table 5).
DISCUSSION
The cross sectional area of the back muscles of patients with chronic low back pain was reported to be smaller than that of people without low back pain.25,26
We expected a correlation between the decreased CSA of back muscles and peak torque of trunk extensors. In the result analysis, correlation between the CSA of back muscles and the strength of trunk flexors and also correlation between the CSA of back muscles and strength of total trunk muscles were found. Also no relationship was found between the CSA of back extensors and the strength of trunk extensors.
One factor in the results is that the CSA of the back muscles was calculated as the sum of the multifidus and erector spinae muscles. As for back extensors, the erector spinae acts as a global muscle that affects movement and muscular strength and the multifidus acts as a local muscle which works as a segmental stabilizer.27 Therefore, the erector spinae muscle might be more related to the isokinetic strength of trunk extensors than the multifidus muscle. It was difficult to separate the multifidus and erector spinae in captured images of MRI, so we measured the cross sectional area of back muscles as the sum of the two muscles and this might act as a limitation in this study. In some patients these two muscles were clearly separated as in other studies, but in others it was hard to separate them as shown in Fig. 1. Therefore, if enough data of patients whose muscles can be separated are gathered, we could consider analyzing the relationship between the CSA of erector spinae and isokinetic strength.
Other factor is the influence of core stabilizing muscles. The core muscles is a group of trunk muscles that surround the vertebrae and peritoneum, and the group includes not only the diaphragm, hip muscles but also the multifidus, longissimus, ilocostalis, quadratus lumborum in the back and the transversus abdominis, internus abdominis, rectus abdominis in the abdomen.28 The core muscles contribute to control of the motion of the lumbar spine and stabilize segments of the lumbar spine. Exercise to increase muscular strength to stabilize the lumbar spine is called core muscle strengthening exercise, and recently much attention has been focused on its effect in decreasing disability and pain of chronic low back pain patients.29 The results of this study suggest that the decrease in the CSA may be related to the weakened strength of trunk flexors and the strength of rectus abdominis, which is a global muscle acting as a trunk flexor among the core muscles and which may have an important role in producing lumbar muscular strength in patients with low back pain.
Another factor is the characteristics of muscle fiber type of back muscles. In the erector spinae of low back pain patients, although structure changes occurred in Type I muscle fiber, it was reported that atrophy of Type II muscle fiber was prominent and that the proportion of Type I muscle fiber in back muscles was higher in women than in men.30,31 If the patients had a high proportion of Type I fiber in back muscles, the isokinetic test might not be appropriate for evaluating the strength. Also, while measuring the isokinetic strength of trunk flexors, eccentric contraction of the back muscles might occur to maintain the stability of the trunk. However we did not measure eccentric torque with the isokinetic dynamometer because eccentric contraction has a higher possibility of causing muscle fiber injury than concentric contraction, and we could not find studies about back muscle strength with eccentric torque. Keller et al.18 reported that there is a correlation between the decreased CSA of back muscle and peak torque, but the measured strength was the peak torque of total trunk muscle, not that of trunk flexors. The results of our study are somewhat similar to the results of this report.
Degenerative change in back muscle may lead to a decrease in the cross sectional area and atrophy of back muscle, so isokinetic strength can be expected to decrease. However, Parkkola et al.25 reported that although the sign of muscle atrophy was replacement of muscle with adipose tissue or connective tissue, the amount of fat infiltration in lumbar muscle was not related to isokinetic strength. In our study, it also was observed that fat composition and muscular strength have no correlation. But this finding could have resulted from the fact that the fat composition of most patients was grade 1 and 2 (average 1.50), which means no moderate or severe degenerative changes of back muscles, and most of the patients in the study were middle aged.
The result of analysis revealed that factors associated with isokinetic strength of trunk muscles were BMI in all patients and age and BMI in female patients. BMI was found to be associated with peak torque of trunk flexors, and positive regression coefficients (2.837 in CSA and 2.942 in rCSA) were found, which suggests that the bigger the body shape or body weight the stronger the trunk flexor. In regression analysis with rCSA as an independent variable, a high regression coefficient was found between gender and the strength of trunk flexors despite the p-value being over 0.05, which suggests that women may have weaker trunk flexors than men.
Analysis of only the female patients revealed that age and BMI influenced the strength of trunk flexors and total trunk muscles more than CSA did. Although the influence of gender on strength could not be evaluated properly due to a much smaller proportion of male patients in our study, female patients tend to show more weakness of trunk muscles with age, which is similar to the report of Keller et al.18 BMI and strength of trunk muscle were negatively correlated in the women which is opposite to the results of all the patients. We can assume that, unlike men, obese women might become inactive and obesity in the abdomen might be associated with weakness of the abdominal muscles, which might lead to weakness of the trunk flexors.
There is a limitation with performing the isokinetic test, and that is the precondition of this test is the maximal voluntary participation of the patients. Pain or psychological factors, such as anxiety, could have prevented maximal contraction of the muscles, resulting in the recording of strength values that are less than the real values. In patients with chronic low back pain, anxiety and other psychological aspects caused by chronic pain can have an influence on back muscle performance. Keller et al.18 reported pain on exertion was a significant predictor of isokinetic back muscle strength bedsides the cross sectional area of muscle, and self-efficacy for pain was a significant predictor of strength only in men. However we did not evaluate the effect of pain and psychological aspects on trunk muscle strength. Additional study on whether or not the psychological problems of anxiety and depression might have an influence on trunk muscle strength in patients of chronic lumbar sprain after trauma such as traffic accident should be considered, because such psychological problems could affect the perception of pain.
CONCLUSION
We found that the cross sectional area of back muscle was an influencing factor in the strength of trunk flexors and total trunk muscles in middle aged chronic low back pain patients in Korea. Besides the cross sectional area of back muscle, physical conditions such as gender and BMI were also influencing factors in the entire population of patients in our study, and age and BMI were influencing factors in the female population of our study.